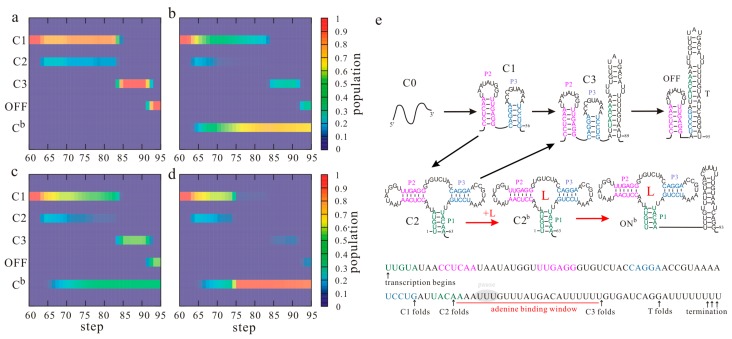
Figure 2.
The ligand-dependent co-transcriptional folding behaviors of the pbuE riboswitch. The population kinetics of main structures from step 60 under different transcription conditions are shown: 20 nt/s, 0 µM adenine (a); 20 nt/s, 100 µM adenine (b); 50 nt/s, 100 µM adenine (c); 50 nt/s, 100 µM adenine with pausing (60 s) at step 67 (d). The superscript “b” denotes the corresponding state with the ligand bound and Cb denotes the ensemble of all the bound states. Main co-transcriptional folding pathways and folding events are mapped in (e). T is the terminator hairpin; L is the ligand (adenine). Nucleotides within paired regions of the aptamer structure are colored differently.

