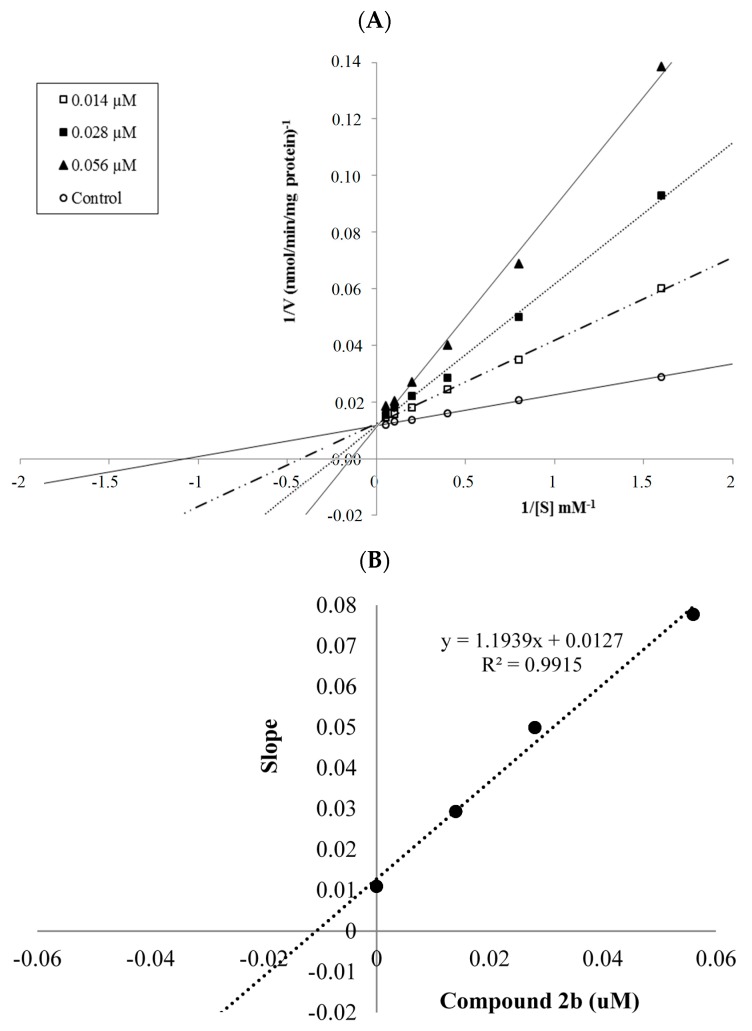
Figure 3.
(A) Lineweaver-Burk plots for the inhibition of hMAO-A by compound 2b. [S], substrate concentration (μM); V, reaction velocity (nmol/min/mg protein). Inhibitor concentrations (IC50/2, IC50, and 2 × IC50) are shown at the left along with negative control. Km values from IC50/2 to control; 2.831, 3.398, 5,014 and 0.940 (μM). Vmax value of the competitive inhibition; 79.360 ± 5.704 (nmol/min/mg protein). (B) Secondary plot for calculation of steady-state inhibition constant (Ki) of compound 2b. Equation corresponding to the line at this graph is y = 1.1939x + 0.0127, R2 = 0.9915. Ki was calculated as 0.011 μM.

