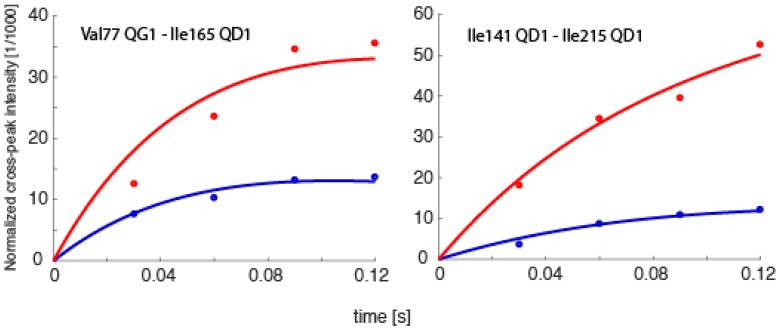
Figure 9.
NOE buildup curves obtained from the 360 kDa half-proteasome. Bi-directional buildup intensities for the spin pairs Val77Qγ1–Ile165Qδ1 and Ile141Qδ1–Ile215Qδ1 are shown. The intensities are normalized to the diagonal-peak intensities at the onset of mixing, which are obtained together with auto-relaxation rates from fits to the diagonals.

