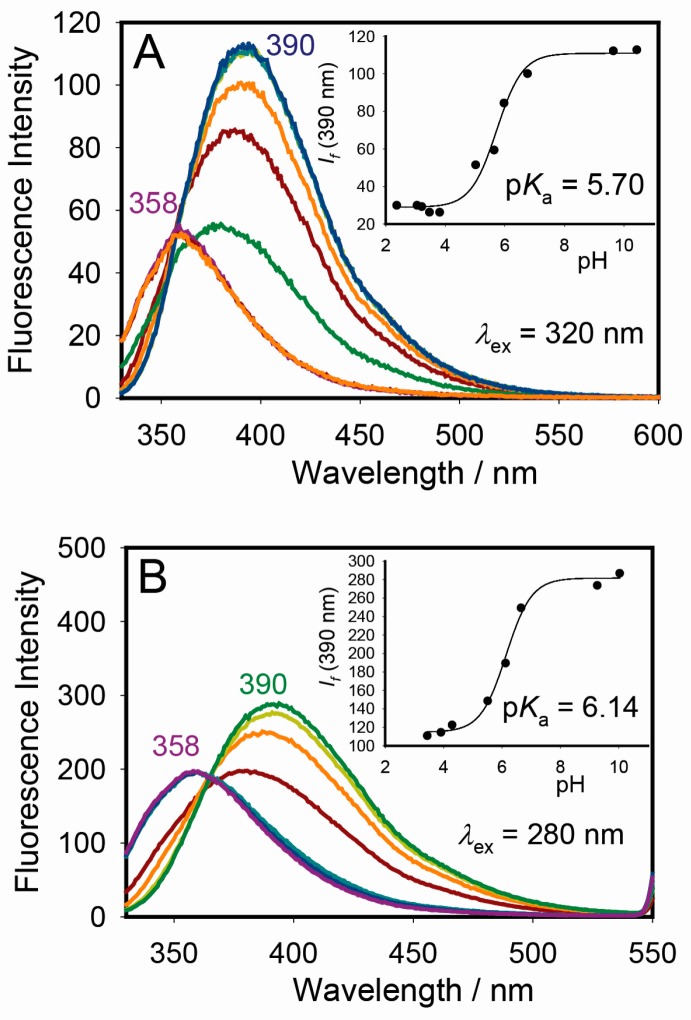
Figure 3.
Fluorescence spectra of W (25 μM) at different pH values with excitation at 320 nm (A); and 280 nm (B); the inset shows the experimental fit to a sigmoidal function (solid line), which gives pKa = 5.70 ± 0.07, and 6.14 ± 0.05, respectively. Slit widths were 5 nm for excitation and 10 nm for emission monochromators in spectra B.

