Abstract
Paeonia rockii is a wild tree peony species with large and dark purple variegations at the base of its petals. It is the genetic resource for various variegation patterns in tree peony cultivars, which is in contrast to the pure white petals of Paeonia ostii. However, the molecular mechanism underlying the formation of variegation in this plant is still unknown. Here, we conducted Illumina transcriptome sequencing for P. rockii, P. ostii (with pure white petals) and their F1 individuals (with purple-red variegation). A total of 181,866 unigenes were generated, including a variety of unigenes involved in anthocyanin biosynthesis and sequestration and the regulation of anthocyanin biosynthesis. The dark purple or purple-red variegation patterns mainly occurred due to the proportions of cyanidin (Cy)- and peonidin (Pn)-based anthocyanins. The variegations of P. rockii exhibited a “Cy > Pn” phenotype, whereas the F1 progeny showed a “Pn > Cy” phenotype. The CHS, DFR, ANS, and GST genes might play key roles in variegation pigmentation in P. rockii according to gene expression and interaction network analysis. Two R2R3-MYB transcription factors (c131300.graph_c0 and c133735.graph_c0) regulated variegation formation by controlling CHS, ANS and GST genes. Our results indicated that the various variegation patterns were caused by transcriptional regulation of anthocyanin biosynthesis genes, and the transcription profiles of the R2R3-MYBs provided clues to elucidate the mechanisms underlying this trait. The petal transcriptome data produced in this study will provide a valuable resource for future association investigations of the genetic regulation of various variegation patterns in tree peonies.
Keywords: anthocyanin biosynthesis, comparative transcriptomic, R2R3-MYB, P. rockii, variegation formation
1. Introduction
Tree peony is a woody shrub of the Moutan section of the genus Paeonia, family Paeoniaceae. It is an important traditional ornamental plant with large, attractive and distinct petal colors. There are ten wild species of tree peony: P. suffruticosa, P. ostii, P. rockii, P. jishanensis, P. qiui, and P. decomposita belonging to subsect Vaginatae and P. delavayi, P. lutea, P. potanini and P. ludlowii belonging to subsect Delavayanae [1]. Interestingly, P. rockii has distinct black variegation at the base of white petals, whereas P. ostii lacks petal variegation. Flower color is a commercially important characteristic of tree peonies, and there is much interest in cultivars that bear flowers with unique colors. To date, about 1500 cultivars with a wide variation in color hues and patterns have been produced by conventional breeding in China; some of these cultivars exhibit variegation at the base of each petal or two distinct colors on individual petals. Most cultivars with variegation are most likely to be the progeny of P. rockii [2]. Because the variegation on the petals enhances the ornamental value of tree peony, clarifying the mechanism underlying variegation formation in P. rockii has great significance.
In plant science, anthocyanins are the most studied and best understood compounds, and their metabolic pathways have been extensively described [3,4]. The activity of anthocyanin biosynthesis enzymes is primarily regulated by transcription factors, including R2R3-MYB, bHLH and WD40 [5]. Variegation formation on the petals is due to the spatially and temporally restricted deposition of anthocyanin pigments, which is controlled by the spatial and temporal expression of anthocyanin-related genes [4]. Cyanidin (Cy)-based glycosides, which accumulate abundantly at the basal petal, result in blotch formation in the Xibei tree peony [6]. Co-expression of PsCHS, PsF3’H, PsDFR and PsANS has been reported to be responsible for purple spot pigmentation in the tree peony [7]. The spot pattern is associated with the differential expression of DFR2 in the red-purple spot in Clarkia gracilis [8].
The regulation mechanisms responsible for the restricted pigment deposition have been revealed in some model plants [9,10]. The R2R3-MYB transcription factors are predominantly responsible for the variegation patterns. In snapdragons, Rosea1 and Rosea2 determine whether the petals are fully pink, whereas Venosa regulates venation [9,10]. In C. gracilis, CgMYB1 activates spot formation; different CgMYB1 alleles expressed in different domains, leading to spot formation in different petal locations [11]. In Phalaenopsis spp, PeMYB11 has been verified to regulate variegated pigmentation by activating the expression of anthocyanin biosynthetic genes PeF3H5, PeDFR1 and PeANS3 [12]. However, the mechanism on variegation formation in P. rockii has not been fully understood.
It is well known that tree peony has a huge genome (13–16 Gb) [13], which often exhibits high heterozygosity and gametophytic self-incompatibility, and a long life cycle (3–4 years from sowing to anthesis). In the absence of a complete genome sequence, RNA sequencing technology based on Illumina sequencing is the most effective and popular tool to obtain information on the expressed fraction of the genome. To date, several anthocyanin biosynthesis-related genes in tree peony have been identified [7,14,15,16,17,18,19,20]. However, the overall molecular mechanisms underlying variegation formation in P. rockii are not known.
In the present study, a comparative transcriptomics analysis was conducted using next-generation sequencing to examine the transcript profiles from the petals of P. rockii (PR), P. ostii (PO) and F1 progeny individuals (RO) with different pigmented patterns. Candidate genes involved in variegated pigmentation process were obtained by annotating and analyzing DEGs. The objective of this study is to reveal the mechanisms on complicated variegation traits. Understanding the molecular mechanisms of variegated pigmentation in P. rockii will advance the knowledge of the genetics underlying variegation formation in tree peony and provide a valuable resource for the identification of genes expressed in the two wild populations.
2 Results
2.1. F1 Progeny
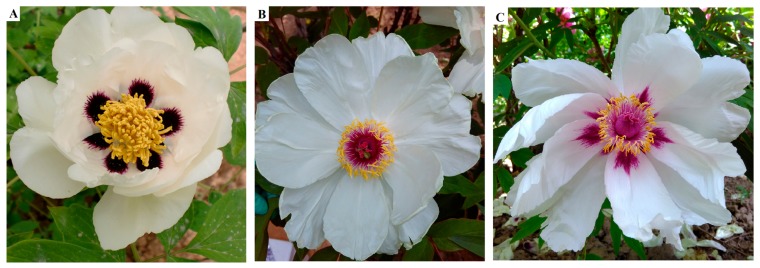
To determine the genetic background of the variegation trait, F1 plants (RO) were derived from crossing between PO and PR. All of the 60 F1 plants exhibited variegation at the base of the petals (Figure 1). Therefore, the variegation of PR exhibited dominant inheritance.
Figure 1.
Fully open flowers of individuals selected for sequencing. (A) Paeonia rockii; (B) Paeonia ostii; (C) F1 individual derived from crossing between P. rockii and P. ostii.
2.2. Color Indices
According to the Royal Horticultural Society Colour Chart (RHSCC), the background color in the PR and RO flowers at stage 5 was the same white as the PO petals, whereas the colors of the variegations in the PR and RO flowers at stage 5 were difference. The color of the variegation was dark purple in PR and purple-red in RO (Table 1). The L*, a* and C* values of the variegation in the RO petals were higher than those in the PR petals. However, the b* value of the variegation was lower in the RO petals than that in PR. Conversely, the color indices of the background in the PR and RO progeny petals were similar to those in PO. These color indices showed that the color of the variegation in RO petals was lighter and more vivid than that in PR. Therefore, these analysis results were consistent with the visual results.
Table 1.
The Flower color, TA, TF and CI of the background and variegation of materials at fully open stage.
| Materials | Parts | Color Scheme | CIE L* a* b* Color Coordinates | TA b | TF b | CI b | |||
|---|---|---|---|---|---|---|---|---|---|
| L* a | a* a | b* a | C* a | ||||||
| PO c | B d | White | 77.51 ± 0.988 | −8.18 ± 0.933 | 6.45 ± 1.001 | 10.25 ± 0.114 | 0 | 44.41 ± 1.002 | ∞ |
| PR c | V d | Dark purple | 19.37 ± 0.546 | −1.35 ± 0.221 | 0.96 ± 0.116 | 1.65 ± 0.065 | 43.9 ± 0.532 | 16.36 ± 0.423 | 0.37 |
| B | White | 81.2 ± 0.541 | −9 ± 0.311 | 7.8 ± 0.135 | 11.91 ± 0.214 | 0 | 31.66 ± 0.358 | ∞ | |
| RO c | V | Purple-red | 33.53 ± 0.621 | 35.03 ± 0.081 | −7.1 ± 0.952 | 35.75 ± 1.021 | 8.36 ± 0.975 | 12.83 ± 0.896 | 1.53 |
| B | White | 82.84 ± 0.465 | −9.68 ± 0.389 | 8.76 ± 0.552 | 13.17 ± 0.485 | 0 | 28.86 ± 0.493 | ∞ | |
a L*, lightness; a*, b*: chromatic components; C*, chroma (brightness). b TF: Total anthocyanins (mg/100 mg dry petals); TF: Total flavones and flavonols (mg/100 mg dry petals); CI, copigment index = TF/TA.
2.3. Spatial Location of the Pigments
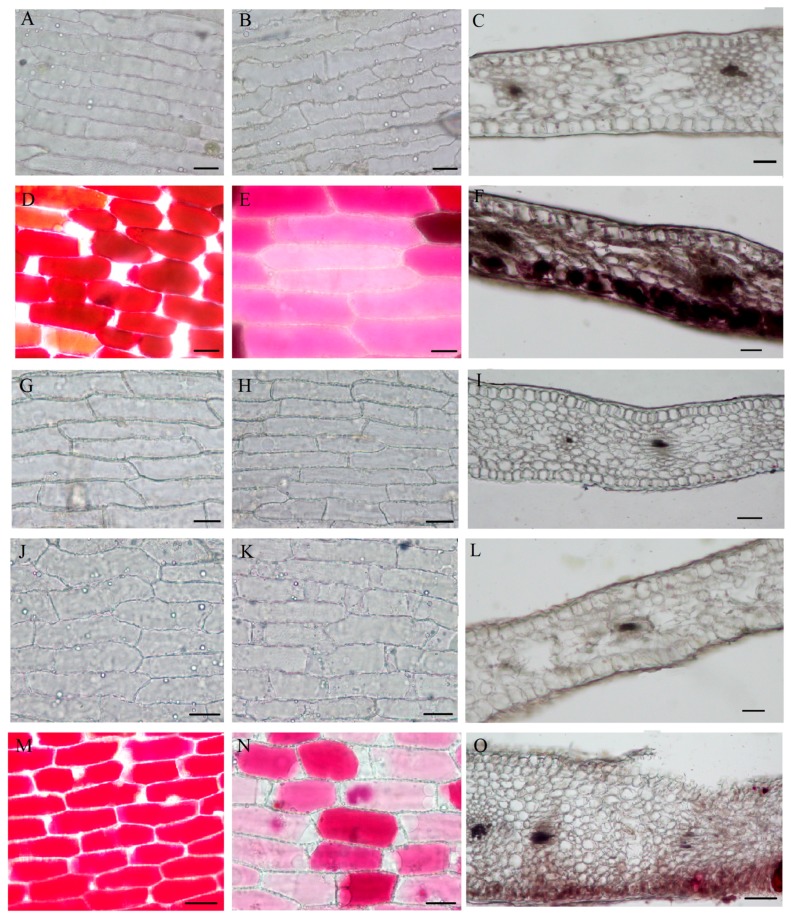
To elucidate the mechanism underlying variegation formation, the spatial location of the pigment was examined within the PR, PO and RO flower petals. As shown in Figure 2C,F,I,L,O, the cross sections of the petals showed a typical structure consisting of an upper epidermis, palisade mesophyll, spongy mesophyll, and lower epidermis. No pigmented cells were found in the non-variegated petals (Figure 2C,I,L). In contrast, the pigmented cells were primarily located in the upper and lower epidermises and the palisade mesophyll (Figure 2F,O).
Figure 2.
Cellular features of the flower materials. Bar = 100 mm. ((A)–(C), (G)–(I) and (J)–(L)) the abaxial, adaxial and cross section of the background petals of P. rockii, P. ostii and the F1 progeny, respectively; ((D)–(F) and (M)–(O)) the upper epidermis, lower epidermis and cross section of the background petals of P. rockii and the F1 progeny, respectively.
The pigmented cells corresponding to variegation in PR were also located in the inner (adaxial) epidermis, which might contribute to the much deeper color of the variegation in PR (Figure 2F). The colored cells in the variegated petals were primarily located in the upper and lower epidermal layers, although the upper epidermal cells showed much deeper color than the lower epidermal cells (Figure 2D–N). In the non-variegated petals, the epidermal cells were colorless (Figure 2A,B,G–K). Therefore, the variegation was caused at least in part by differences in the spatial location of the colored cells within the tissues.
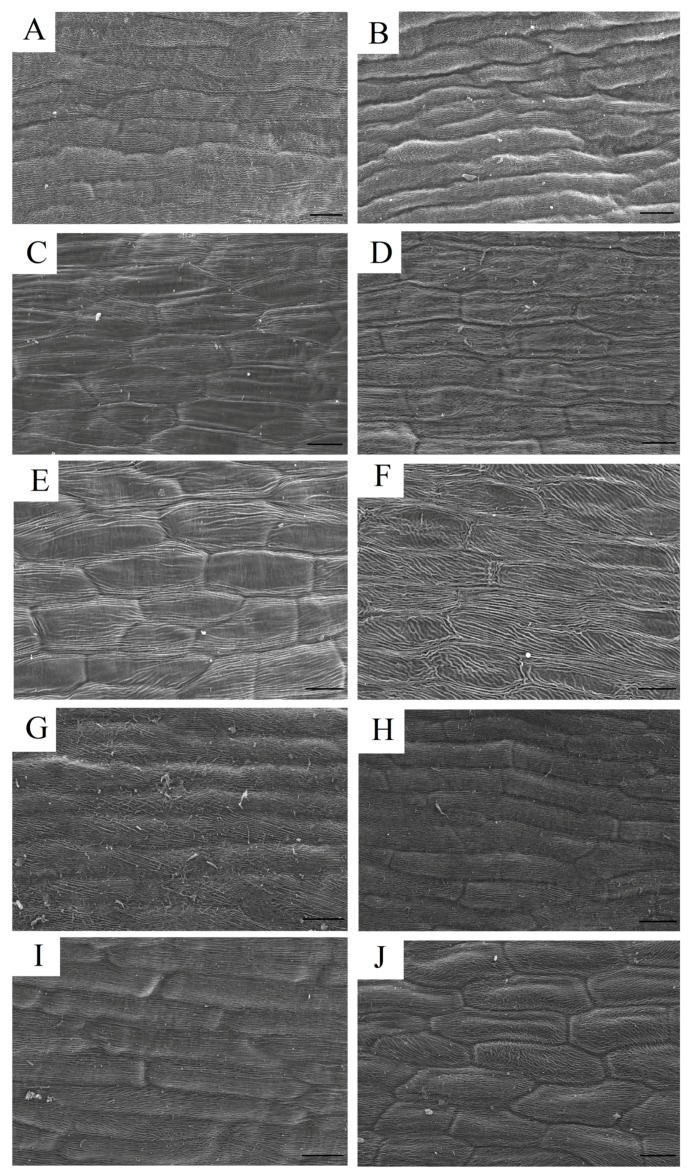
To the best of our knowledge, the shape of the pigmented cells influences their optical properties and thus affects our sensation of color. To analyze interactions between color and surface geometry, the epidermal cell shapes in the variegated and non-variegated petals were examined by scanning electron microscopy (Figure 3).
Figure 3.
Scanning electron micrograph (SEM) of papillate cells from the outer epidermis of petals from the materials. Bar = 40 μm. ((A,B), (E,F) and (G,H)) the upper and lower epidermis of the background petals of P. rockii, P. ostii and the F1 progeny, respectively. ((C,D) and (I,J)) the upper and lower epidermis of the variegated petals of P. rockii and the F1 progeny, respectively.
The cell shapes between the variegated and non-variegated petals were similar. All epidermal cells were elongated and explanate (Figure 3). These results suggested that the variegation formation in tree peony was not associated with the epidermal cell shape.
2.4. Qualitative and Quantitative Analysis of Pigments
The HPLC analysis revealed that the pigments in the variegations in the P. rockii and F1 progeny petals contained four anthocyanins (Cy3G5G, Cy3G, peonidin (Pn) 3G5G and Pn3G) (Table 2). The variegation in PR showed a “Cy > Pn” phenotype, with Cy3G representing the most abundant anthocyanin (28.36 ± 0.063 mg/g), whereas RO had a “Pn > Cy” phenotype with high Pn3G5G (4.27 ± 0.046 mg/g) and Cy3G5G contents (2.51 ± 0.011 mg/g). No anthocyanins were detected in the background petals in RO and PR or the whole petals of PO.
Table 2.
The contents of anthocyanins in variegation of P. rockii and F1 progeny at fully open stage.
| Materials | Cy3G5G a (mg/g) | Cy3G a (mg/g) | Pn3G5G a (mg/g) | Pn3G a (mg/g) |
|---|---|---|---|---|
| Variegation of PR | 6.51 ± 0.050 | 28.36 ± 0.063 | 5.21 ± 0.115 | 3.82 ± 0.125 |
| Variegation of RO | 2.51 ± 0.011 | 0.72 ± 0.024 | 4.27 ± 0.046 | 0.87 ± 0.098 |
a Cy3G, cyanidin 3-O-glucoside; Cy3G5G, cyaniding 3,5-di-O-glucoside; Pn3G, peonidin 3-O-glucoside; Pn3G5G, peonidin 3,5-di-O-glucoside.
Additionally, flavonoid, flavone and flavonol were detected in the variegations, including Qu 3,7-di-O-glucoside, Km 3,7-di-O-glucoside, Is 3,7-di-O-glucoside, Qu 3-O-glucoside, Lu 7-O-glucoside, Ap 7-O-glucoside, Is 3-O-glucoside, and Ap 7-O-neohesperidoside (Table 3). Tremendous differences in the compositions were found in different petals (Table 3). In the variegations of PR petals, the main component was Ap 7-O-glucoside (3.64 ± 0.062 mg/g), followed by Lu 7-O-glucoside (3.08 ± 0.010 mg/g), Km 3,7-di-O-glucoside (2.25 ± 0.034 mg/g), Qu 3-O-glucoside (2.16 ± 0.036 mg/g), Is 3,7-di-O-glucoside (1.69 ± 0.037 mg/g), Ap 7-O-neohesperidoside (1.58 ± 0.053 mg/g), Is 3-O-glucoside (1.01 ± 0.055 mg/g) and Qu 3,7-di-O-glucoside (0.95 ± 0.021 mg/g). However, the most abundant compound in the variegations of the F1 progeny was Is 3,7-di-O-glucoside (3.41 ± 0.055 mg/g), followed by Lu 7-O-glucoside (2.42 ± 0.085 mg/g), Km 3,7-di-O-glucoside (1.38 ± 0.031 mg/g) and Is 3,7-di-O-glucoside (1.26 ± 0.058 mg/g). In contrast, the main compositions detected in the PO petals and the non-variegated petals from PR and RO were Ap 7-O-neohesperidoside, Ap 7-O-glucoside, Km 3,7-di-O-glucoside and Lu 7-O-glucoside (Table 3).
Table 3.
The contents of glycosides of flavone and flavonol in the backgroud and variegation of materials at fully open stage.
| Compound (mg/g) | B b of PO | V b of PR | B of PR | V of RO | B of RO |
|---|---|---|---|---|---|
| Qu a 3,7-di-O-glucoside | - | 0.95 ± 0.021 | - | 1.16 ± 0.035 | 2.39 ± 0.039 |
| Km a 3,7-di-O-glucoside | 8.51 ± 0.110 | 2.25 ± 0.034 | 5.52 ± 0.10 | 1.38 ± 0.031 | 4.33 ± 0.097 |
| Is a 3,7-di-O-glucoside | 12.11 ± 0.089 | 1.69 ± 0.037 | 0.0 ± 0.012 | 3.41 ± 0.055 | 4.54 ± 0.072 |
| Qu a 3-O-glucoside | - | 2.16 ± 0.036 | - | 2.1 ± 0.026 | 0.31 ± 0.011 |
| Lu a 7-O-glucoside | 0.05 ± 0.008 | 3.08 ± 0.010 | 0.24 ± 0.009 | 2.42 ± 0.085 | 6.01 ± 0.154 |
| Ap a 7-O-glucoside | 9.34 ± 0.132 | 3.64 ± 0.062 | 15.01 ± 0.135 | 0.35 ± 0.065 | 4.18 ± 0.426 |
| Is a 3-O-glucoside | 3.45 ± 0.054 | 1.01 ± 0.055 | - | 1.26 ± 0.058 | 0.14 ± 0.035 |
| Ap a 7-O-neohesperidoside | 10.95 ± 0.113 | 1.58 ± 0.053 | 10.82 ± 0.110 | 0.75 ± 0.031 | 6.96 ± 0.082 |
a Qu, quercetin; Km, kaempferol; Is, isorhamnetin; Lu, luteolin; Ap, apigenin. b B, the background part of petals; V, the variegation part of petals.
TFs in the non-variegated areas were twice as much as the TFs in the variegated areas, and the TAs were four times higher in the variegations of PR than in RO. Furthermore, the CI was used to determine the co-pigmentation effect between anthocyanins and flavonoids. The CI value in the variegations of RO was higher than that in PR (Table 1). The petal color appeared to be strongly influenced by the variety and concentration of pigments, prompting us to further investigate the molecular processes at the transcriptome level.
2.5. Transcriptome Sequencing and Annotation
To identify the key genes involved in variegation formation in PR, we performed a comparative transcriptomic analysis among three different pigmentation patterns from PR, PO, and RO using the Illumina HiSeqTM 2500 technique. A total of 181,866 unigenes from nine libraries were generated, of which 57,913 (31.84%), 43,307 (23.81%), 34,125 (18.76%), 18,986 (10.44%), 33,409 (18.37%), 24,154 (13.28%), and 47,410 (26.07%) unigenes were annotated to the NCBI Non-redundant Protein database (NR), Protein Family (Pfam), SwissProt protein database (SwissProt), Kyoto Encyclopedia of Genes and Genomes database (KEGG), Gene Ontology (GO) and Cluster of Orthologous Groups of Proteins database (COG) and euKaryotic orthologous groups (KOG) database, respectively (Table S1).
When compared with the KEGG database, 130 pathways were associated the unigenes (Table S2). These pathways represented metabolism, genetic information processing, organism systems and cellular processes. As far as we known, four secondary metabolic pathways were related to flower pigmentation: phenylpropanoid biosynthesis (250, 1.04%), flavonoid biosynthesis (64, 0.26%), anthocyanin biosynthesis (4, 0.02%), and flavone and flavonol and biosynthesis (6, 0.02%) (Table S2). Of these pathways, 44, six, five, two, five, two, three, four and four unigenes were annotated as PAL, CHS, CHI, F3H, F3’H, FLS, DFR, ANS and AOMT, respectively, three unigenes were annotated as 3GT, and one unigene was aligned to 5GT (Table S3). Additionally, 64 candidate unigenes were predicted to encode glutathione S-transferase (GST) proteins, which are required for transporting pigments to vacuoles (Table S4). In higher plants, the gene expression of anthocyanin biosynthesis pathway was regulated by a ternary complex consisting of the R2R3-MYB, bHLH, and WD40 transcription factors [21]. Accordingly, 88, 16 and 44 unigenes were predicted to encode R2R3-MYBs, bHLHs, and WD40s, respectively (Table S4).
2.6. Comparative Analysis of the P. rockii, P. ostii and F1 Progeny Transcriptomes
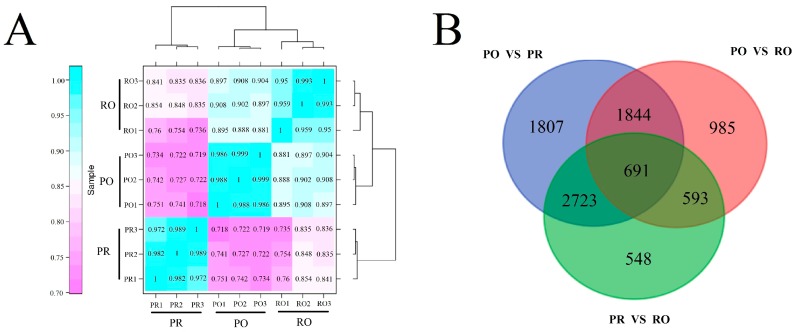
The gene expression variations in the nine RNA-seq samples were divided into clustered into three groups with three replicate samples according to their special coloration patterns (Figure 4A). Additionally, the levels of gene expression in RO were more similar to those observed in PO than PR.
Figure 4.
Gene expression profiles in three differentially colored tree peonies. (A) Cluster dendrogram of gene expression profiles between biological replicates and among different tree peonies. The color scale represents Pearson correlation coefficients among different samples. The higher the Pearson correlation coefficient, the closer the relationship between two libraries is. The blue represents a closer relationship, and pink represents a distant one transcriptome relationship between different samples; (B) Comparison in pairs of differentially expressed genes (with an FDR < 0.001 and a |log2 ratio| > 1) in different groups. The Venn diagram depicts the overlaps between each pairwise comparison. The Venn diagram was constructed online using Venny (http://bioinfogp.cnb.csic.es/tools/venny/).
To identify candidate genes involved in variegation formation in P. rockii, a comparative analysis of the PR, PO and RO libraries was performed. Based on the threshold value of FDR < 0.001 and |log2 ratio| > 1, 7065 unigenes were identified as differentially expressed genes (DEGs) in the PO petals compared with the PR petals (Figure 4B), including 3147 up-regulated genes and 3918 down-regulated genes (Figure 4B), 4113 DEGs were identified in PO vs. RO, including 1925 up-regulated genes and 2188 down-regulated genes, and 4947 DEGs in PR vs. RO, including 2615 up-regulated genes and 2332 down-regulated genes (Figure 4B). Moreover, a total of 691 unigenes showed significantly different expression levels in all of the three groups (Figure 4B).
GO enrichment analysis was performed for the DEGs in the three groups. 9191 DEGs were categorized into 50 functional groups, including 20, 14 and 16 groups in the biological process, cellular component and molecular function categories, respectively. Metabolic process and cellular process were the most frequent terms in the biological process category, cell part and organelle accounted for the major proportions in the cellular component category, and catalytic activity and binding were the dominant functions in the molecular function category (Figure S1).
Furthermore, the DEGs were aligned to the KEGG database for a functional annotation analysis. As expected, in the PO vs. PR comparison, four pathways related to pigmentation were identified: phenylpropanoid biosynthesis (39 DEGs, ko00940), flavonoid biosynthesis (10 DEGs, ko00941), flavone and flavonol biosynthesis (2 DEGs, ko00944) and anthocyanin biosynthesis (1 DEG, ko00942) (Table S5). For the PR vs. RO comparison, three pathways involved in pigmentation were identified: phenylpropanoid biosynthesis (29 DEGs), flavonoid biosynthesis (four DEGs) and anthocyanin biosynthesis (1 DEG) (Table S6). In contrast, phenylpropanoid biosynthesis (25 DEGs), flavonoid biosynthesis (6 DEGs), flavone and flavonol biosynthesis (one DEG) and anthocyanin biosynthesis (one DEG) were identified in the PO vs. RO comparison (Table S7).
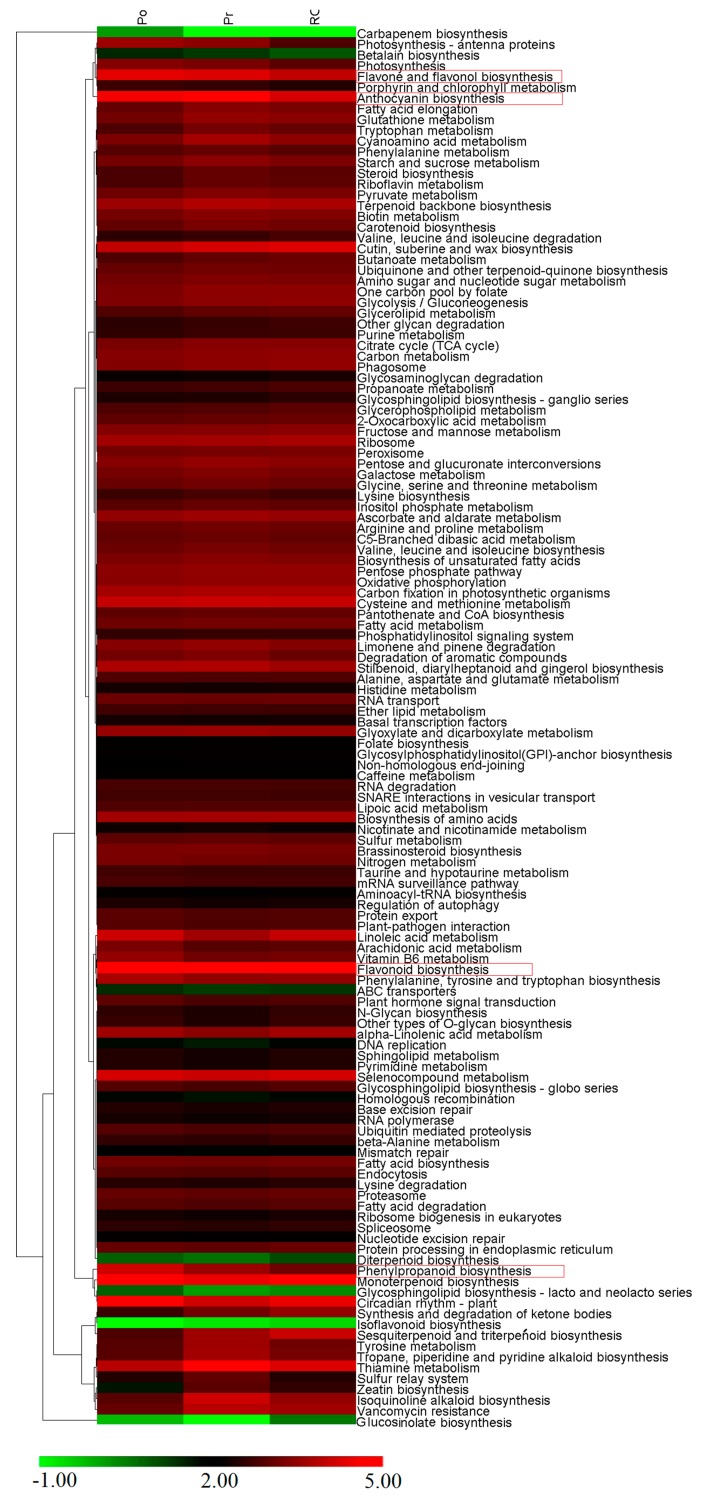
The expression profiles of the metabolic pathways identified in KEGG were clustered (Figure 5). Among the four pathways involved in pigmentation, phenylpropanoid biosynthesis and flavone and flavonol biosynthesis were abundant in PO, flavonoid biosynthesis showed a high abundance in PO and RO, and anthocyanin biosynthesis was relatively abundant in PR.
Figure 5.
Expression profiles of 130 KEGG pathways. The heatmap is generated according to the average expression levels of the genes in each pathway based on log ratio FPKM data. The color scale represents log2 transformed FPKM values. Green indicates low expression, and red indicates high expression.
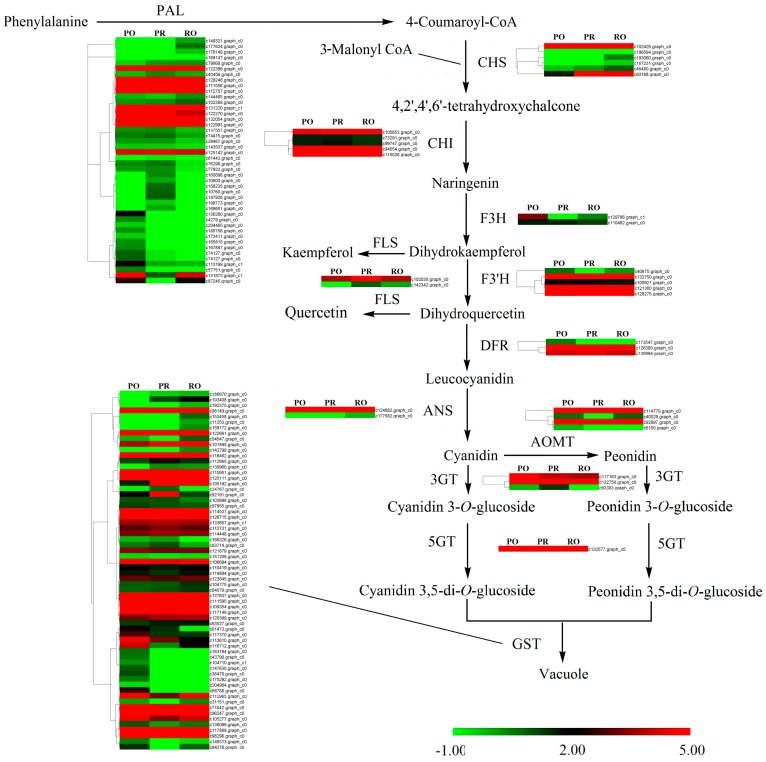
Previous research has demonstrated that variegation formation in the tree peony is mainly due to the spatial biosynthesis of anthocyanins (Cy and Pn). Therefore, the expression patterns of core genes in the anthocyanin metabolic pathway were studied in detail (Figure 6). Many unigenes were expressed with significantly different levels. Most members of the CHS, CHI, FLS, ANS and 3GT genes were up-regulated in PR or RO, whereas most members of F3H, F3’H, AOMT and 5GT were up-regulated in PO (Figure 6). Among three DFR unigenes, two members were up-regulated in PO, while c126380.graph_c0 was abundant in PR and RO. Some members of the PAL genes were abundant in PR or RO, such as c149321.graph_c0, c79868.graph_c0 and c102388.graph_c0. As expected, the generally expression level of GST unigenes in PR was three times higher than that in PO and 1.5-fold of that in RO. But the changes in the expression levels of all GST unigenes were complicated, of which some members were significantly up-regulated in PR and RO, including c186670.graph_c0, c103408.graph_c0, c112665.graph_c0, c139960.graph_c0, c105192.graph_c0 and c114448.graph_c0 (Figure 6), and some were up-regulated in PO or RO, such as c112965.graph_c0, c105277.graph_c0, c71042.graph_c0, c117370.graph_c0, c113610.graph_c0, c96247.graph_c0, c98296.graph_c0, especially c113610.graph_c0 and c98296.graph_c0 were significantly abundant in PO.
Figure 6.
A detailed schematic of anthocyanin metabolism related to flower pigmentation in PO, PR and RO. Enzyme names and expression patterns are indicated beside each step. The expression pattern of each gene is shown in a heatmap. The color scale represents log2 transformed FPKM values. Green indicates low expression, and red indicates high expression.
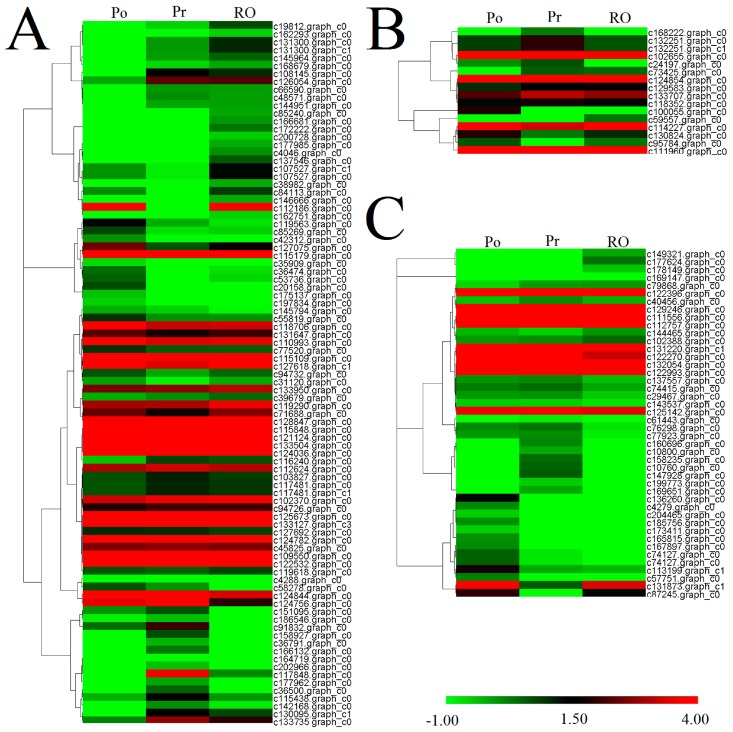
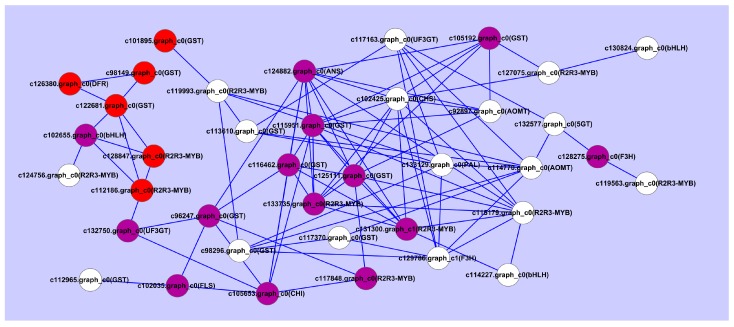
Moreover, analysis of the expression levels of the R2R3-MYB, bHLH and WD40 unigenes indicated that some R2R3-MYB, bHLH and WD40 genes were significantly up-regulated in PR or RO (Figure 7). A total of 28 DEGs encoding anthocyanin biosynthesis associated genes involved in variegation pigmentation were predicted (Table S8). Fourteen DEGs encoding R2R3-MYBs and 4 DEGs encoding bHLHs were also detected (Table S9). To analyze the interactions of phenylpropanoid biosynthesis, anthocyanin biosynthesis, flavonoid biosynthesis and flavone and flavonol biosynthesis with variegation formation in PR, a network comprised of differentially expressed genes was constructed (Figure 8). Obviously, the unigenes with the highest numbers of positive correlations were c124882.graph_c0 (ANS), c115951.graph_c0 (GST), c102425.graph_c0 (CHS), c125111.graph_c0 (GST), c131300.graph_c0 (R2R3-MYB) and c133735.graph_c0 (R2R3-MYB). Of these unigenes, c124882.graph_c0 (the late gene ANS) shared positive correlations with CHS (c102425.graph_c0), AOMT (c92897.graph_c0), five GST unigenes (c105192.graph_c0, c115951.graph_c0, c116462.graph_c0, c125111.graph_c0 and c96247.graph_c0) and three R2R3-MYB unigenes (c133735.graph_c0, c131300.graph_c0 and c115179.graph_c0).
Figure 7.
All unigenes encoding the R2R3-MYB (A), bHLH (B) and WD40 (C) transcription factors were hierarchically clustered and mapped using the FPKM values. Colors indicate log2 transformed FPKM values. Green indicates low expression, and red indicates high expression.
Figure 8.
A co-expression network of the DEGs involved in pigmentation. The white, purple, and red circles represent the genes with the highest expression levels in the P. ostii, P. rockii and F1 progeny petals, respectively.
Meanwhile, c131300.graph_c0 (R2R3-MYB transcription factor), which was highly abundant in PR, shared positive correlations with ten unigenes, including two R2R3-MYB unigenes, three GST unigenes, one ANS unigene, one CHS unigene, one AOMT unigene and one bHLH unigene. Moreover, five GST genes that exhibited much higher expression levels in PR than in PO and RO all belonged to the large hubs. So c131300.graph_c0 and c133735.graph_c0 may influence the variegation formation of P. rockii by regulating CHS, ANS, AOMT, GST genes.
2.7. Validation of the Expression Levels of Differentially Expressed Genes at Different Stages
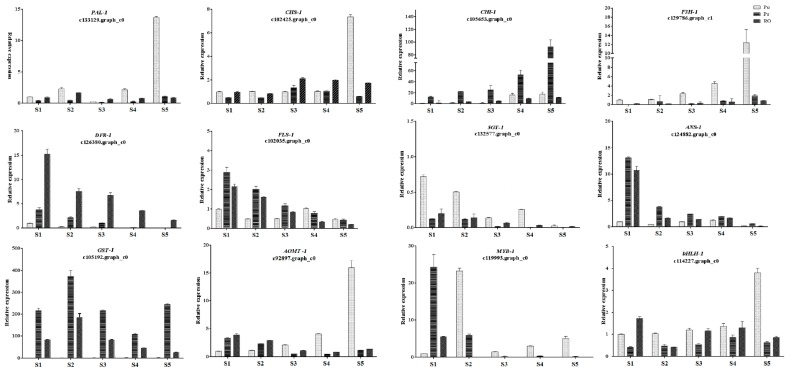
To validate the expression profiles obtained from the transcriptome data, twelve pigmentation-related DEGs were selected for qRT-PCR analysis to evaluate their expression patterns in the PO, PR and RO petals during flower development. As shown in Figure 9, PAL-1 (c133129.graph_c0), CHS-1 (c102425.graph_c0), F3H-1 (c129786.graph_c1), 5GT-1 (c132577.graph_c0), AOMT-1 (c92897.graph_c0), MYB-1 (c119993.graph_c0) and bHLH-1 (c114227.graph_c0) showed higher expression levels in PO than in PR and RO. Among these genes, the expression of F3H-1 was extremely high in PO petals, conversely, it was barely detected in PR and RO petals throughout the entire flower pigmentation process. MYB-1 (c119993.graph_c0) up-regulated at the stage 1 of PR and RO, and then down-regulated. Interestingly, MYB-1 was significantly abundant in stage 2 of PO. Conversely, CHI-1 (c105653.graph_c0), DFR-1 (c126380.graph_c0), FLS-1 (c102035.graph_c0), ANS-1 (c124882.graph_c0), GST-1 (c105192.graph_c0) showed significantly higher expression levels in the PR and RO petals than in the PO petals. In particular, DFR-1, ANS-1 and GST-1 were barely expressed in the PO petals during flower development. In terms of the overall trend, the expression levels of the upstream genes involved in anthocyanin biosynthesis (with the exception of FLS) showed an uptrend during flower development, whereas the downstream genes DFR-1, 5GT-1 and ANS-1 were continuously reduced with flower development. The AOMT-1 transcript levels were complex, with an uptrend in PO and downward trend in PR and RO during flower development. These results demonstrated that the expression patterns of the twelve selected DEGs analyzed by qRT-PCR were in agreement with the expression patterns obtained by Illumina sequencing (Figure 9).
Figure 9.
qRT-PCR analysis of twelve pigmentation-related candidate unigenes in the materials. The qRT-PCR analysis was performed using RNA from the petals at each floral developmental stages (S1–S5).
3. Discussion
P. rockii has large, deep purple variegations at the base of its petals and contributes to variegation patterns in tree peony cultivars, which exhibit very high ornamental and commercial values. However, all F1 progeny derived from crossing between P. rockii and the other tree peony wild species (P. ostii) with pure white petals exhibited variegation at the base of their petals, suggesting that the variegation of P. rockii exhibited dominant inheritance.
A comparative transcriptomic analysis among the petals of PR, PO and RO individuals was conducted using Illumina sequencing. A total of 181,866 unigenes were assembled (Table S1), of which 70,944 unigenes were annotated in various databases. Pathway analysis of the DEGs indicated that the three comparisons shared 100 KEGG pathways, including phenylpropanoid biosynthesis, flavonoid biosynthesis and anthocyanin biosynthesis. The phenylpropanoid biosynthesis and flavone and flavonol biosynthesis pathways were abundant in PO, flavonoid biosynthesis showed a high abundance in PO and RO, and anthocyanin biosynthesis was relatively abundant in PR. These results validated the conclusion that anthocyanin accumulation was the main contributor to variegation in PR.
The spatial distribution of different pigment compositions is a primary cause of variegation formation on the petals [4]. Petal pigments usually are primarily distributed in the upper epidermal cells but are also found in the palisade tissue and the lower epidermis of the dark colored petals [22,23,24,25]. The various shapes of petal epidermal cells also have an important impact on flower coloration [26,27,28]. Therefore, the spatial location of the pigment within the petals and the shape of the pigmented cells were examined in the PR, PO and RO flowers. The colored cells in the variegated petals were primarily located in the upper and lower epidermal layers. However, the upper epidermal cells showed much deeper color than the lower epidermal cells (Figure 2). Moreover, all of the epidermal cells between the variegated and non-variegated petals were elongated and explanate (Figure 3), suggesting that the variegation was caused by differences in the spatial location of the colored cells within the tissues.
Additionally, the pattern and color of the variegation in RO were triangular and vivid purple-red, whereas those in PR were circular and dark purple (Figure 1 and Table 1). The anthocyanin compositions were Cy3G, Cy3G5G, Pn3G and Pn3G5G in the variegation of the PR and RO petals (Table 2), which was consistent with the results reported by Zhang et al. [6]. Moreover, the variegation in PR was “Cy > Pn” phenotype, whereas the variegation in RO had the opposite phenotype (Table 2). The total anthocyanin in the variegation of PR was five times higher than that in RO, whereas the total flavonoid content was the highest in the background of PR (Table 1). These results indicated that Cy-based pigments resulted in the dark purple variegation formation in P. rockii, which was consistent with the results obtained by Zhang et al. [6]. These physiological results were in perfect agreement with the results obtained in the anthocyanin biosynthetic gene expression analysis. As shown in Figure 6, most members of CHS, CHI, FLS, ANS, and 3GT genes involved in anthocyanin biosynthetic were up-regulated in PR or RO, whereas the members of F3H, F3’H, AOMT and 5GT genes were up-regulated in PO. One of the three DFR unigenes was significantly abundant in PR and RO. Moreover, co-expression of PsCHS, PsF3’H, PsDFR and PsANS contributed to the abundant anthocyanin accumulation involved in spot formation in the tree peony ‘Jinrong’ [7]. Anthocyanins are transported to the vacuoles by GSTs, resulting in coloration [29,30]. Based on the DEG analysis, 28 DEGs were predicted to be the key genes involved in variegation formation (Table S9). Among them, CHI-1 (c105653.graph_c0), DFR-1 (c126380.graph_c0), FLS-1 (c102035.graph_c1), ANS-1 (c124882.graph_c0) and GST-1 (c105192.graph_c0) showed significantly higher expression in PR and RO than in PO. Specifically, DFR-1, ANS-1 and GST-1 were barely expressed in PO during flower development (Figure 9). In the anthocyanin biosynthetic pathway, CHI-1 catalyzes the isomerization of 4,2′,4′,6′-tetrahydroxychalcone to form naringenin, which is required in the metabolic branch pathways of flavone and anthocyanin synthesis. Dihydrokaempferol represents a branch point in anthocyanin biosynthesis in the production of both colorless kaempferol through FLS-1 and cyanidin through co-expression of DFR-1 and ANS-1 (Figure 9). Interestingly, some members of AOMTs, which are responsible for the methylation of anthocyanins and contribute to the purple coloration in Paeonia plants, were expressed at higher levels in PR than in RO, whereas other members were abundantly expressed in both RO and PO (Figure 6). To the best of our knowledge, methylated peonidin, Pn3G and Pn3G5G were more abundant in PR than in RO, and some methylated colorless flavonoids, such as Is (isorhamnetin), accumulated more in PO and RO petals than in PR. Additionally, the interaction network analysis showed that ANS (c124882.graph_c0), CHS (c102425.graph_c0) and GST (c115951.graph_c0) exhibited the most positive correlations with other genes, including structural genes and transcription factors (Figure 8). Among them, CHS (c102425.graph_c0) was markedly up-regulated in all materials in the anthocyanin biosynthetic pathway and provided more substrates for anthocyanin and flavonoid biosynthesis. Therefore, we concluded that CHS, DFR, ANS, and GST were mainly responsible for variegation pigmentation in P. rockii.
Because the expression of the CHS (c102425.graph_c0), DFR (c126380.graph_c0), ANS (c124882.graph_c0) and GST (c115951.graph_c0) were coordinately up-regulated in PR and RO, the transcriptional regulation of these structural genes is most likely to influence the variegation formation. In higher plants, the R2R3-MYB, bHLH, and WD40 transcription factors, especially the R2R3-MYBs, are the primary regulatory genes that influence the anthocyanin biosynthesis intensity and patterns to form different variegation patterns [21]. LhMYB12 is responsible for the coordinated expression of LhCHSa, LhCHSb, LhF3H, LhF3’H, LhDFR and LhANS and controls the splatter-type tepal spots in Asiatic hybrid lilies [4,31] and PeMYB11 activates the expression of anthocyanin biosynthetic genes PeF3H5, PeDFR1 and PeANS3, and results in the red spot in the callus in Phalaenopsis spp. [12]. Correspondingly, in the present work, we detected 14 DEGs encoding R2R3-MYBs and 4 DEGs encoding bHLHs (Table S9). Among them, c131300.graph_c0, c133735.graph_c0 and c115179.graph_c0 exhibited the most positive correlations with other genes, including other R2R3-MYB unigenes and GST, ANS, CHS, AOMT and bHLH unigenes (Figure 8). Moreover, c133735.graph_c0 and c131300.graph_c0 were both annotated as anthocyanin regulatory C1 protein [32,33] and showed significantly higher expression in PR and RO petals than in PO. However, another R2R3-MYB DEG (c119993.graph_c0), which was also annotated as anthocyanin regulatory protein and up-regulated in PO, interacted with c133128.graph_c0 (PAL), c114770.graph_c0 (AOMT) and other GST unigenes that up-regulated in PO. Thus, c131300, graph_c0 and c133735.graph_c0 were more likely to regulate the biosynthesis of anhocyanins in P. rockii petals. To sum up, based on our results we speculated that two R2R3-MYB genes (c131300.graph_c0 and c133735.graph_c0 ) acted as hub genes to regulate variegation formation by triggering or coordinating other coloration-associated genes, such as CHS, ANS, and GST, in PR. Hence, whether these two R2R3-MYB transcription factors function with bHLH transcription factors and how to influence the spatial formation of variegation in P. rockii, and the up- and down factors associated with these two R2R3-MYB transcription factor function should be further investigated. Fortunately, the large number of gene sequences produced by petal transcriptome generated by our work will accelerate such investigations.
4. Materials and Methods
4.1. Plant Material
P. rockii (PR) and P. ostii (PO) were grown in the germplasm repository of the College of Landscape Architecture and Art, Northwest A&F University, Shaanxi, China. To analyze the segregation of the variegation characteristic, PR was crossed with PO, and their F1 progeny (RO) were grown under the same conditions (Figure 1). All of the ground plants grew well with sufficient light and water supply. For the transcriptome sequencing, petal samples were separately collected at five different opening stages from the end of April to early May in 2015. The flower opening stages were described by Shi et al. [15] as follows: stage 1, unpigmented tight bud; stage 2, slightly pigmented soft bud; stage 3, initially opened flower; stage 4, half opened flower; and stage 5, fully opened and pigmented flower with exposed anthers. To measure the pigment contents, the variegation and background in each petal at stage 5 were separated and pooled. The samples were immediately frozen in liquid nitrogen and stored at −80°C prior to analysis. Additionally, the stage 5 petals were separately detached and used immediately for the morphological and anatomical observation.
4.2. Petal Color Variable Measurements
The variegation and background colors of all samples at stage 5 were compared with the Royal Horticultural Society Color Chart (RHSCC) and then measured with a chroma meter (CR-400, Konica Minolta Sensing, Inc., Osaka, Japan) using three color parameters (the L*, a* and b* values). In these measurements, L* represents lightness ranging from black (L* = 0) to white (L* = 100), a* represents the balance between red and green, b* represents the ratio of yellow and blue, and C* represents the saturation of the color [6]. Five replicates were recorded [22,34].
4.3. Microscopic Observation of the Epidermal Cells and Transverse Sections
Fresh petals with variegation and background from all samples at stage 5 were cross-sectioned. The upper and lower epidermal layers were peeled off using a razor blade. The layers were placed onto a glass slide with a drop of water and then immediately observed under a light microscope (BX43, Olympus, Tokyo, Japan) equipped with a DS cooled camera head with the FNIS-Elements image processing software.
4.4. Scanning Electron Microscopy (SEM)
To identify the cell shapes associated with upper and lower variegation and background in the petals from all samples, SEM was performed according to the method of Qi et al. [22].
4.5. Pigment Measurement
Pigment extraction was conducted according to the method of Hashimoto et al. [35]. The extracts were filtered through a membrane filter (0.45 μm) for HPLC analysis. The pigment composition was determined using HPLC-ESI-MSn (LCQ Deca XP MAX, Thermo Scientific, Waltham, MA, USA) according to the method of Zhang et al. [6]. The anthocyanin and flavonoid contents were measured semi-quantitatively based on simple linear regression using malvidin-3, 5-di-oglucoside (Mv3G5G) and rutin as the standards at 520 nm and 350 nm, respectively. The anthocyanin and flavonoid contents were calculated in milligrams per gram fresh weight (as a quantity of Mv3G5G in mg/g and a quantity of rutin in mg/g, respectively). The mean values and standard deviations (SDs) were gained from three biological replicates. The CI (co-pigmentation index) was calculated by dividing TF (total flavone and flavonol in mg/100 mg dry petals) by TA (total anthocyanidin mg/100 mg dry petals) (i.e., CI = TF/TA) [6].
4.6. RNA Extraction, Library Construction, and RNA-seq
For each biological replicate of PR, PO and PR, an equal amount of petals at five different opening stages was pooled, respectively. Total RNA was extracted from 1-mg pooled samples of petals from PR, PO and PR obtained by homogenizer (TissueLyzer; Qiagen, Valencia, CA, USA) using the Quick RNA Isolation Kit (Bioteke Corporation, Beijing, China) according to the manufacturer’s protocols. The RNA purity was examined by using the NanoDrop 2000 spectrophotometer (Thermo Scientific, Waltham, MA, USA) and 1% agarose gel electrophoresis. The RNA integrity was checked using an Agilent 2100 Bioanalyzer (Santa Clara, CA, USA) with an RIN (RNA integrity number) > 8.0. The Bioanalyzer results of all RNA samples were listed in Table S10. 6-μg total RNA of three biological replicates from PR, PO and PR were used for library construction. The library construction and the RNA-seq analysis were performed by the Biomarker Biotechnology Corporation (Beijing, China) using an Illumina HiSeqTM 2500 platform. All sequencing data were deposited in the National Center for Biotechnology Information (NCBI) Sequence Read Archive with accession number SRP109687.
4.7. De Novo Assembly and Annotation
After excluding poor quality reads with adaptors, ambiguous nucleotides and low quality, clean reads were obtained from the raw reads and then assembled de novo using the Trinity software (Windows v3.0) (http://trinityrnaseq.sourceforge.net/) with K-mer = 25 and group pairs distance = 300 [36]. For the functional annotation, the resulting unigenes were aligned to a series of public databases, including such as NCBI NR, Pfam, SwissProt database, KEGG database, GO and COG and KOG databases using Blastx (e-value < 0.00001).
4.8. Differential Gene Expression Analysis
The expression levels of unigenes were calculated using the FPKM (fragment per kilobase per million mapped reads) method [37]. Then, edgeR (Windows v3.0) (http://bioconductor.org/packages/release/bioc/html/edgeR.html) was used to normalize the expression level of each unigene in the three samples to identify the differentially expressed genes by pairwise comparisons. The false discovery rate (FDR) control and the ratio of FPKM values from two samples were used to compute significant differences in the gene expression levels. Here, thresholds of an FDR ≤ 0.001 and an absolute value of log2 ratio ≥ 2 were used to judge the significance of the observed differential gene expression. Additionally, the DEGs were annotated and categorized automatically using the GO and KEGG databases to screen for DEGs involved in petal variegation formation. To analyze variegated pigment interactions, a network of all differentially expressed pigmentation-related genes was constructed using the R package “weighted correlation network analysis” [38] according to the protocol [39]. Two nodes were determined to be connected if the absolute value of the Pearson correlation coefficient >0.93 [40]. Then the networks were visualized using Cytoscape (v.3.1.0) [41].
4.9. qRT-PCR Analysis
Twelve variegation-related genes were subjected to qRT-PCR on the ABI 7500 Sequence Detector (Applied Biosystems, Foster, CA, USA) using a SYBR Premix Ex Taq Kit (Takara; Otsu, Japan) according to the manufacturer’s protocol. Specific primers were designed using the Primer Premier software (Table S11). The cDNA synthesis and qRT-PCR were performed as described previously [17]. The relative expression levels of genes in the petals at the different opening stages were normalized to the TUB gene expression level in the same sample and calibrated to the transcription level in the PR petals at stage 1. All reactions were conducted in three biological replicates and three technical replicates. A two-sided t test was used to compare the expression levels.
Acknowledgments
This work is supported by Natural Science Foundation of Shannxi Province, China (2017JQ3024), the Special Fund for Scientific Research in the Public Welfare (201404701), the Scientific Starup foundation for Doctor of Northwest A&F University (Z109021611) and Fundamental Research Funds for the Central Universities (Z109021606).
Abbreviations
| 3GT | anthocyanin 3-O-glucosyltransferase |
| 5GT | anthocyanin 5-O-glucosyltransferase |
| a*, b* | chromatic components |
| ANS | anthocyanin synthase |
| AOMT | anthocyanin O-methyltransferase |
| Ap | apigenin |
| bHLH | basic helix-loop-helix |
| C* | chroma (brightness) |
| CHI | chalcone isomerase |
| CHS | chalcone synthase |
| CI | Co-pigment index |
| COG | Cluster of orthologous groups of proteins database |
| Cy3G | cyanidin 3-O-glucoside |
| Cy3G5G | cyaniding 3,5-di-O-glucoside |
| DEGs | differentially expressed genes |
| DFR | dihydroflavonol 4-reductase |
| F3’H | flavonoid 3’-hydroxylase |
| F3H | flavanone 3-hydroxylase |
| FDR | false discovery rates |
| FLS | flavonol synthase |
| FPKM | fragments per kilobase per million mapped reads |
| GO | gene ontology |
| GST | glutathione S-transferase |
| HPLC | hogh-performance liquid chromatography |
| Is | isorhamnetin |
| KEGG | Kyoto encyclopedia of genes and genomes database |
| Km | kaempferol |
| KOG | euKaryotic orthologous groups |
| L* | lightness |
| Lu | luteolin |
| Nr | Non-resundant protein database |
| PAL | phenylalanine ammonia-lyase |
| Pfam | protein family |
| Pn3G | peonidin 3-O-glucoside |
| Pn3G5G | peonidin 3,5-di-O-glucoside |
| qRT-PCR | quantitative reverse transcription PCR |
| Qu | quercetin |
| R | pearson’s correlation coefficient |
| RHSCC | Royal horticultural society colour chart |
| SwissProt | SwissProt protein database |
| TA | total anthocyanin |
| TF | total flavone and flavonol in mg/100 mg dry petals. |
Supplementary Materials
Supplementary Materials are available online.
Author Contributions
S.Q. and L.L. performed the experiments, data analysis and wrote the manuscript. Z.X., L.X. and Z.L. performed some experiments for this paper. L.J. and H.L. helped ready for plant material. Z.Y. designed this research. All authors read and approved the final manuscript.
Conflicts of Interest
The authors declare no conflict of interest.
References
- 1.Li J.J. Tree Peony and Herbaceous Peony. China Forestry Publishing House; Beijing, China: 1996. [Google Scholar]
- 2.Wang L., Hashimoto F., Shiraishi A., Shimizu K., Aoki N., Sakata Y. Petal coloration and pigmentation of tree peony cultivars of Xibei (the Northwest of China) J. Jpn. Soc. Hortic. Sci. 2000;69:233. [Google Scholar]
- 3.Tanaka Y., Ohmiya A. Seeing is believing: Engineering anthocyanin and carotenoid biosynthetic pathways. Curr. Opin. Biotechnol. 2008;19:190–197. doi: 10.1016/j.copbio.2008.02.015. [DOI] [PubMed] [Google Scholar]
- 4.Suzuki K., Suzuki T., Nakatsuka T., Dohra H., Yamagishi M., Matsuyama K., Matsuura H. RNA-seq-based evaluation of bicolor tepal pigmentation in Asiatic hybrid lilies (Lilium spp.) BMC Genom. 2016;17:611. doi: 10.1186/s12864-016-2995-5. [DOI] [PMC free article] [PubMed] [Google Scholar]
- 5.Schaart J.G., Dubos C., Romero D.L., Fuente I., Houwelingen A.M., Vos R.C., Jonker H.H. Identification and characterization of MYB-bHLH-WD40 regulatory complexes controlling proanthocyanidin biosynthesis in strawberry (Fragaria × ananassa) fruits. New Phytol. 2013;197:454–467. doi: 10.1111/nph.12017. [DOI] [PubMed] [Google Scholar]
- 6.Zhang J., Wang L., Shu Q., Liu Z., Li C., Zhang J., Wei X., Tian D. Comparison of anthocyanins in non-blotches and blotches of the petals of Xibei tree peony. Sci. Hortic. 2007;114:104–111. doi: 10.1016/j.scienta.2007.05.009. [DOI] [Google Scholar]
- 7.Zhang Y., Cheng Y., Ya H., Xu S., Han J. Transcriptome sequencing of purple spot region in tree peony reveals differentially expressed anthocyanin structural genes. Front. Plant Sci. 2015;6:964–972. doi: 10.3389/fpls.2015.00964. [DOI] [PMC free article] [PubMed] [Google Scholar]
- 8.Martins T., Berg J., Blinka S., Rausher M., Baum D. Precise spatial-temporal regulation of the anthocyanin biosynthetic pathway leads to petal spot formation in Clarkia gracilis (Onagraceae) New Phytol. 2013;197:958–969. doi: 10.1111/nph.12062. [DOI] [PMC free article] [PubMed] [Google Scholar]
- 9.Schwinn K., Venail J., Shang Y., Mackay S., Alm V., Butelli E., Oyama R., Bailey P., Davies K., Martin C. A small family of MYB-regulatory genes controls floral pigmentation intensity and patterning in the genus Antirrhinum. Plant Cell. 2006;18:831–851. doi: 10.1105/tpc.105.039255. [DOI] [PMC free article] [PubMed] [Google Scholar]
- 10.Shang Y., Venail J., Mackay S., Bailey P., Schwinn K., Jameson P., Martin C., Davies K. The molecular basis for venation patterning of pigmentation and its effect on pollinator attraction in flowers of Antirrhinum. New Phytol. 2011;189:602–615. doi: 10.1111/j.1469-8137.2010.03498.x. [DOI] [PubMed] [Google Scholar]
- 11.Martins T., Jiang P., Rausher M. How petals change their spots: Cis-regulatory re-wiring in Clarkia (Onagraceae) New Phytol. 2016 doi: 10.1111/nph.14163. [DOI] [PubMed] [Google Scholar]
- 12.Hsu C., Chen Y., Tsai W., Chen W., Chen H. Three R2R3-MYB transcription factors regulate distinct floral pigmentation patterning in Phalaenopsis spp. Plant Physiol. 2015;168:175–191. doi: 10.1104/pp.114.254599. [DOI] [PMC free article] [PubMed] [Google Scholar]
- 13.Bennett M.D., Leitch I.J. Nuclear DNA amounts in angiosperms: Targets, trends and tomorrow. Ann. Bot. 2011;107:467–590. doi: 10.1093/aob/mcq258. [DOI] [PMC free article] [PubMed] [Google Scholar]
- 14.Shi Q., Zhou L., Li K., Wang Y. Isolation and expression of PlbHLH3 transcription factor genes in Paeonia lutea. J. For. Res. 2015;28:488–496. [Google Scholar]
- 15.Shi Q., Zhou L., Wang Y., Li K., Zheng B.Q., Miao K. Transcriptomic analysis of Paeonia delavayi wild population flowers to identify differently expressed genes involved in purple-red and yellow petal pigmentation. PLoS ONE. 2015;10:e0135038. doi: 10.1371/journal.pone.0135038. [DOI] [PMC free article] [PubMed] [Google Scholar]
- 16.Shi Q., Zhou L., Wang Y., Zhai L.J., Li L. Isolation and expression of PlWDR3 and PlWDR18 transcription factor genes in Paeonia lutea. J. Northwest For. Univ. 2017;32:1–5. [Google Scholar]
- 17.Shi Q., Zhou L., Wang Y. Isolation and expression analysis of GST gene encoding glutathione S-transferase of Paeonia delavayi Var.lutea whild population in Yunnan. Sci. Silvae Sin. 2014;12:63–71. [Google Scholar]
- 18.Zhao D., Tang W., Hao Z., Tao J. Identification offlavonoids and expression offlavonoid biosynthetic genes in two coloured tree peony flowers. Biochem. Biophys. Res. Commun. 2015;459:450–456. doi: 10.1016/j.bbrc.2015.02.126. [DOI] [PubMed] [Google Scholar]
- 19.Zhou L., Wang Y., Peng Z. Molecular characterization and expression analysis of chalcone synthase gene during flower development in tree peony (Paeonia suffruticosa) Afr. J. Biotechnol. 2011;10:1275–1284. [Google Scholar]
- 20.Zhou L., Wang Y., Ren L., Shi Q.Q., Zheng B.Q., Miao K. Overexpression of Ps-CHI1, a homologue of the chalcone isomerase gene from tree peony (Paeonia suffruticosa), reduces the intensity of flower pigmentation in transgenic tobacco. Plant Cell Tissue Organ Cult. 2014;16:285–295. doi: 10.1007/s11240-013-0403-2. [DOI] [Google Scholar]
- 21.Xu W., Dubos C., Lepiniec L. Transcriptional control of flavonoid biosynthesis by MYB-bHLH-WDR complexes. Trends Plant Sci. 2015;20:176–185. doi: 10.1016/j.tplants.2014.12.001. [DOI] [PubMed] [Google Scholar]
- 22.Qi Y., Lou Q., Li H., Yue J., Liu Y., Wang Y. Anatomical and biochemical studies of bicolor flower development in Muscari latifolium. Protoplasma. 2013;250:1273–1281. doi: 10.1007/s00709-013-0509-8. [DOI] [PubMed] [Google Scholar]
- 23.Shoji K., Miki N., Nakajima N., Momonoi K., Kato C., Yoshida K. Perianth bottom-specific blue color development in Tulip cv. murasak-izuisho requires ferricions. Plant Cell Physiol. 2007;48:243–251. doi: 10.1093/pcp/pcl060. [DOI] [PubMed] [Google Scholar]
- 24.Yoshida K., Kitahara S., Ito D., Kondo T. Ferricions involved in the flower color development of the himalayan blue poppy Meconopsis grandis. Phytochemistry. 2006;67:992–998. doi: 10.1016/j.phytochem.2006.03.013. [DOI] [PubMed] [Google Scholar]
- 25.Yoshida K., Miki N., Momonoi K., Kawachi M., Katou K., Okazaki Y., Uozumi N., Maershima M., Kondo T. Synchrony between flower opening and petal-color change from red to blue in morning glory Ipomoea tricolor cv. Heavenly blue. Proc. Jpn. Acad. Ser. B Phys. Biol. Sci. 2009;85:187–197. doi: 10.2183/pjab.85.187. [DOI] [PMC free article] [PubMed] [Google Scholar]
- 26.Yoshida K., Kondo T., Okazaki Y., Katou K. Cause of blue petal colour. Nature. 1995;373:291. doi: 10.1038/373291a0. [DOI] [Google Scholar]
- 27.Vignolini S., Moyroud E., Hingant T., Banks H., Rudall P.J., Steiner U. The flower of Hibiscus trionum is both visibly and measurably iridescent. New Phytol. 2015;05:97–101. doi: 10.1111/nph.12958. [DOI] [PubMed] [Google Scholar]
- 28.Noda K., Glover B.J., Linstead P., Martin C. Flower colour intensitydepends on specialized cell shape controlled by a Myb-related transcription factor. Nature. 1994;369:661–664. doi: 10.1038/369661a0. [DOI] [PubMed] [Google Scholar]
- 29.Mueller L.A., Goodman C.D., Silady R.A., Walbot V. AN9, a petunia glutathione S-transferase required for anthocyanin sequestration, is a flavonoid-binding protein. Plant Physiol. 2000;123:1561–1570. doi: 10.1104/pp.123.4.1561. [DOI] [PMC free article] [PubMed] [Google Scholar]
- 30.Alexandra C., Nik K., Brian B., Samantha S., Andres B.R., Takashi U., Kevin W.E., Rrich G., Marisa S.O. Anthocyanin vacuolar inclusions form by a microautophagy mechanism. Plant Cell. 2015;27:2545–2559. doi: 10.1105/tpc.15.00589. [DOI] [PMC free article] [PubMed] [Google Scholar]
- 31.Yamagishi M., Toda S., Tasaki K. The novel allele of the LhMYB12 gene is involved in splatter-type spot formation on the flower tepals of Asiatic hybrid lilies (Lilium spp.) New Phytol. 2014;201:1009–1020. doi: 10.1111/nph.12572. [DOI] [PubMed] [Google Scholar]
- 32.Paz-Ares J., Ghosal D., Wienand U., Peterson P.A., Saedler H. The regulatory c1 locus of Zea mays encodes a protein with homology to myb proto-oncogene products and with structural similarities to transcriptional activators. EMBO J. 1987;6:3553–3558. doi: 10.1002/j.1460-2075.1987.tb02684.x. [DOI] [PMC free article] [PubMed] [Google Scholar]
- 33.Lepiniec L., Debeaujon I., Routaboul J.M., Baudry A., Pourcel L., Nesi N., Caboche M. Genetics and biochemistry of seed flavonoids. Annu. Rev. Plant. Biol. 2006;57:405–430. doi: 10.1146/annurev.arplant.57.032905.105252. [DOI] [PubMed] [Google Scholar]
- 34.Hu S.Y. The tour of a botanist in China. Arnoldia. 1976;35:264–295. [Google Scholar]
- 35.Hashimoto F., Tanaka M., Maeda H., Shimizu K., Sakata Y. Characterization of cyanic flower color of Delphinium cultivars. J. Jpn. Soc. Hort. Sci. 2000;69:428–434. doi: 10.2503/jjshs.69.428. [DOI] [Google Scholar]
- 36.Grabherr M.G., Haas B.J., Yassour M., Levin J.Z., Thompson D.A., Amit I. Full-length transcriptome assembly from RNA-Seq data without a reference genome. Nat. Biotechnol. 2011;29:644–652. doi: 10.1038/nbt.1883. [DOI] [PMC free article] [PubMed] [Google Scholar]
- 37.Trapnell C., Williams B.A., Pertea G., Mortazavi A., Kwan G., Van B.M.J. Transcript assembly and quantification by RNA-Seq reveals unannotated transcripts and isoform switching during cell differentiation. Nat. Biotechnol. 2010;28:511–515. doi: 10.1038/nbt.1621. [DOI] [PMC free article] [PubMed] [Google Scholar]
- 38.Langfelder P., Horvath S. WGCNA: An R package for weighted correlation network analysis. BMC Bioinform. 2008;9:559. doi: 10.1186/1471-2105-9-559. [DOI] [PMC free article] [PubMed] [Google Scholar]
- 39.Miller J.A., Horvath S., Geschwind D.H. Divergence of human and mouse brain transcriptome highlights Alzheimer disease pathways. Proc. Natl. Acad. Sci. USA. 2010;107:12698–12703. doi: 10.1073/pnas.0914257107. [DOI] [PMC free article] [PubMed] [Google Scholar]
- 40.Zheng Z.L., Zhao Y.H. Transcriptome comparison and gene coexpression network analysis provide a systems view of citrus response to ‘Candidatus Liberibacter asiaticus’ infection. BMC Genom. 2013;14:27. doi: 10.1186/1471-2164-14-27. [DOI] [PMC free article] [PubMed] [Google Scholar]
- 41.Shannon P., Markiel A., Ozier O., Baliga N.S., Wang J.T., Ramage D., Amin N., Schwikowski B., Ideker T. Cytoscape: A Software Environment for Integrated Models of Biomolecular Interaction Networks. Genome Res. 2013;13:2498–2504. doi: 10.1101/gr.1239303. [DOI] [PMC free article] [PubMed] [Google Scholar]
Associated Data
This section collects any data citations, data availability statements, or supplementary materials included in this article.


