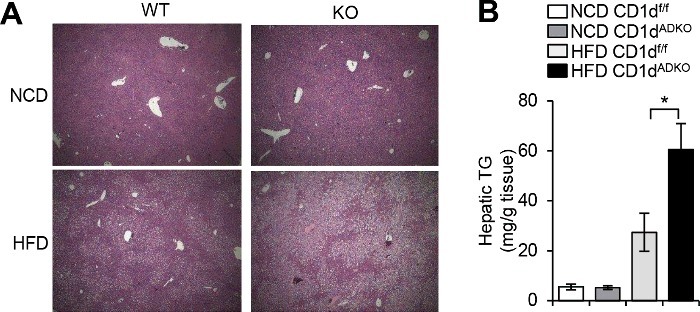
Figure 3.

Increased hepatic triglyceride accumulation in HFD-fed CDtdADKO mice A: H&E staining images of liver from CDldf/f and CDldADKO mice upon NCD and 12 weeks of 60% HFD feeding. n = 5. B: Hepatic triglyceride concentration. n = 5 for NCD and n = 8 for 60% HFD. *P < 0.05.
