. 2018 Sep 18;7:e39742. doi: 10.7554/eLife.39742

Figure 1. GLWamide precursor transcripts are expressed in ectodermal and endodermal epithelial cells of sea anemone planula larvae.

Z-projections of confocal sections of Nematostella vectensis at planula stages, labeled with an antisense riboprobe against GLWamide precursor transcript (‘glw’) and an antibody against acetylated ∂-tubulin (‘acTub’). Nuclei are labeled with DAPI. All panels show side views of animals with the blastopore/mouth facing up. The left columns (A and C) show superficial planes of section at the level of the ectoderm, and the right columns (B and D) show longitudinal sections through the center. (A, B) early planula. GLWamide transcripts are found in ectodermal sensory cells that are present in the outer epithelium and the pharynx (arrowheads in A and B). The inset in A show transcript-expressing epithelial cells in boxed regions with the apical side of the cell facing up. Note the spindle-shaped morphology characteristic of cnidarian sensory cells (Thomas and Edwards, 1991). (C, D) mid-planula. A subset of endodermal cells begin to express GLWamide transcript (arrowheads in D). The inset in D shows transverse sections of the pharynx, revealing the asymmetry in the spatial distribution of GLWamide-positive sensory cells. Abbreviations: ph pharynx; ec ectoderm; en endoderm; at apical tuft. Scale bar: 50 µm (A-D); 10 µm (inset in A).

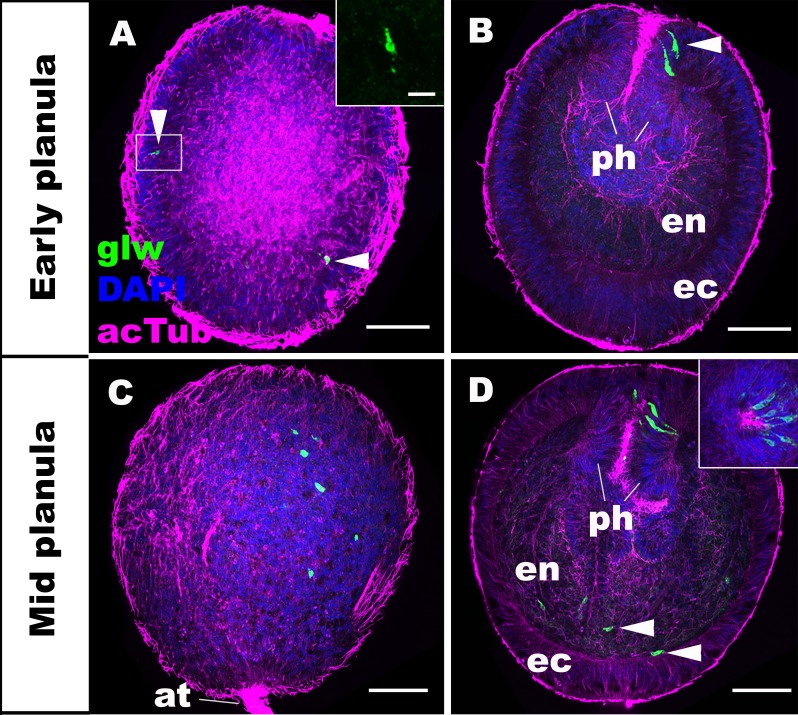
Figure 1—source data 1. A confocal image stack used to generate panels A and B (dapi_blue actub_purple glw transcript_green).
DOI: 10.7554/eLife.39742.004
Figure 1—source data 2. A confocal image stack used to generate panels C and D (dapi_blue actub_purple glw transcript_green).
DOI: 10.7554/eLife.39742.005

Figure 1.

Figure 1—figure supplement 1. Genomic organization, cDNA sequences, and predicted mature peptides of GLWamide gene.

Figure 1—figure supplement 1.

(A) Schematic view of the GLWamide genomic locus, located in scaffolds 229 of the N. vectensis genome (v.1.0; http://genome.jgi.doe.gov/Nemve1/Nemve1.home.html). Gene structure based on gene model prediction is shown at the top, and the revised structure based on the comparison of the N. vectensis genome and cDNA sequences is shown at the bottom. The number above the schematic indicate genomic coordinates within the scaffold. Grey boxes are untranslated regions; aqua-colored boxes are translated regions. Blue bars show predicted translation start sites; red bars show predicted translation termination sites; yellow bars show predicted GLWamide-encoding regions described below. The region boxed in purple is missing in the currently available genome of N. vectensis (v.1.0). Note that the revised gene structure contains two exons. (B) cDNA and deduced amino acid sequence of the GLWamide gene. Short peptides that are either repeated or similar, and are likely to be released by proteolytic cleavages are circled in yellow. It is assumed that single or multiple acidic and basic residues become cleaved as suggested in another sea anemone Anthopleura elegantissima (Darmer et al., 1991; Leviev and Grimmelikhuijzen, 1995). A purple arrowhead indicates the intron position. (C) Amino acid sequence alignment for GLWamides I-IX. We assume that upon release of the peptide, an N-terminal glutamine is spontaneously converted into a pyroglutamic acid residue (<Glu), and a C-terminal glycine becomes amidated by an α-amidating enzyme (cf. [Darmer et al., 1991]). The numbers on the right of each peptide sequence indicate copy numbers of each peptide that a single precursor protein is predicted to generate.