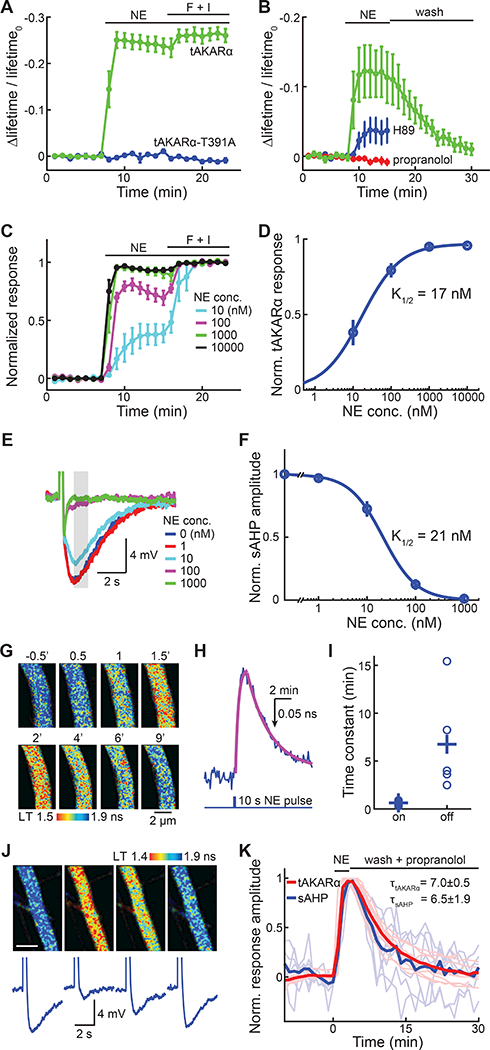
Figure 3. tAKARα response reflects physiologically relevant PKA signaling events.

(A) Δlifetime/lifetime0 of tAKARα and its phosphorylation site mutant (tAKARα-T391A) responding to 1 μM norepinephrine (NE) stimulation followed by forskolin/ IBMX (F + I) application.
(B) Δlifetime/lifetime0 of tAKARα in response to 30 nM norepinephrine followed by washout, or in the presence of 20 μM H89 or 1 μM propranolol. n = 4 – 6 neurons.
(C) tAKARα responses to indicated concentrations of norepinephrine normalized to the maximal responses induced by F + I. n = 4 – 6 neurons.
(D) Dose-response curve for tAKARα responding to norepinephrine, fitted by the Hill equation.
(E, F) Representative traces (E) and dose response curve fitted by the Hill equation
(F) of sAHP attenuated by increasing concentrations of norepinephrine. n = 6 neurons.
(G, H, I) Representative images (G), a representative trace and its fitted curves (H), and collective kinetic time constants (I) of tAKARα responding to iontophoresis-released pulses of norepinephrine. n = 5 neurons.
(J, K) Representative tAKARα 2pFLIM images (J, upper panels), representative sAHP traces (J, lower panels), and collective normalized timecourses (K) of neurons that were imaged or recorded in response to a 3-min pulse of bath-applied norepinephrine (0.5 μM) followed by wash in the presence of propranolol. Both individual (thin and lighter colored) and averaged traces are shown. n = 11 neurons for tAKARα and 7 for sAHP.
Error bars are s.e.m.
See also Figure S4.
