

SUMMARY:
Signaling by Toll-like receptors (TLRs) on intestinal epithelial cells (IECs) is critical for intestinal homeostasis. To visualize epithelial expression of individual TLRs in vivo, we generated five strains of reporter mice. These mice revealed that TLR expression varied dramatically along the length of the intestine. Indeed, small intestine (SI) IECs expressed low levels of multiple TLRs that were highly expressed by colonic IECs. TLR5 expression was restricted to Paneth cells in the SI epithelium. Intestinal organoid experiments revealed that TLR signaling in Paneth cells or colonic IECs induced a core set of host defense genes, but this set did not include antimicrobial peptides, which instead were induced indirectly by inflammatory cytokines. This comprehensive blueprint of TLR expression and function in IECs reveals unexpected diversity in the responsiveness of IECs to microbial stimuli, and together with the associated reporter strains, provides a resource for further study of innate immunity.
eTOC
Price et al generate five strains of reporter mice to visualize the expression of individual TLRs on intestinal epithelial cells (IECs). Their findings reveal unexpected diversity in the temporal and spatial patterns of TLR expression and in the responsiveness of IECs to microbial stimuli. of innate immunity.
Graphical Abstract
INTRODUCTION:
Dysregulated immune responses to commensal bacteria have been linked to the development of inflammatory bowel disease and colorectal cancer in humans (Chassaing and Darfeuille-Michaud, 2011; Tjalsma et al., 2012). Polymorphisms in receptors that recognize components of commensal microbes, including Toll-like receptors (TLRs), are associated with increased incidence of these diseases. More specifically, variants of TLR2, 4, 5, and 9 have been associated with the incidence or pathogenesis of Crohn’s Disease (Franchimont et al., 2004; Gewirtz et al., 2006; Pierik et al., 2006; Török et al., 2009), and one common clinical feature of this disease is the presence of antibodies to the TLR5 ligand flagellin (Lodes et al., 2004). In mice, deletion of TLR2, 4, 5, or 9 or the TLR signaling adapter MyD88 contributes to exacerbated disease in models of inflammatory bowel disease (Rakoff-Nahoum et al., 2004; Rhee et al., 2005; Rose et al., 2012). Thus, differences in TLR expression, localization, or signaling could potentially have dramatic effects on intestinal homeostasis.
The intestinal epithelium consists of a single layer of polarized cells that separates the intestinal lumen from the underlying lamina propria. Intestinal epithelial cells (IECs) are therefore uniquely positioned to interact with and influence the lumenal intestinal microbiota. It is commonly accepted that IECs are capable of directly recognizing microbial components through expression of pattern recognition receptors, including TLRs (Abreu, 2010; Peterson and Artis, 2014). Multiple studies in mice have hinted at a role for TLRs or TLR-associated signaling pathways specifically in the intestinal epithelium. Epithelial-specific deletion of TLR5 can result in microbial dysbiosis and low-grade inflammation (Chassaing et al., 2014). Transgenic expression of a constitutively active form of TLR4 specifically in IECs augments disease in mouse models of colitis and colitis-associated colorectal cancer (Fukata et al., 2011), while transgenic expression of unmodified TLR4 is associated with changes in microbial density and composition and alterations of the intestinal barrier (Dheer et al., 2016). TLR3 expression in epithelial cells has been linked to protection against rotavirus infection (Pott et al., 2012). Expression of MyD88 from a Paneth cell-specific transgene is sufficient to rescue production of the antimicrobial peptide Reg3γ and prevent bacterial translocation in MyD88−/− mice, potentially revealing a specific role for TLR signaling in Paneth cells (Vaishnava et al., 2008). Taken together, these studies suggest that TLR signaling in IECs may play a pivotal role in sensing and responding to commensal and pathogenic microbes in vivo. However, since most of these studies globally deleted or transgenically overexpressed TLRs or TLR signaling components in all IECs, the endogenous expression patterns of TLRs and the functional outcomes of signaling through these receptors in IECs are not well-defined.
Primary IECs are particularly difficult to study due to the rapid onset of cell death (anoikis) after detachment from the basement membrane (Frisch and Screaton, 2001). To overcome this obstacle, multiple groups have used epithelial cell lines to show TLRdependent production of proinflammatory cytokines and chemokines such as TNF, IL-6, and IL-8 (Stadnyk, 2002). However, it is unclear whether TLR expression in transformed cell lines mimics expression in vivo. Other studies have used quantitative RT-PCR to assess TLR expression in IECs, but this technique can be complicated by even very small numbers of contaminating TLR-expressing immune cells. The structurally complex nature of TLRs has made the generation of high-affinity antibodies difficult, which has complicated efforts to visualize TLR-expressing cells in situ. These technical obstacles have resulted in multiple conflicting and often contradictory reports on the expression of TLRs by IECs and the role of these signaling pathways in IEC-intrinsic responses to intestinal microbes.
Here, we generated TLR reporter mice to visualize TLR-expressing IECs in vivo. These tools revealed unexpected tissue-specific, cell type-specific, and temporal patterns of TLR expression in the intestinal epithelium. To complement the expression data, we used intestinal organoids to characterize IEC-intrinsic gene expression in response to a wide array of TLR ligands and cytokines. By providing both a map of TLR expression in the epithelium and a functional readout of these responses, this resource provides a framework for future studies focused on crosstalk between the epithelium and intestinal microbes. In addition, the mouse strains generated in this study should prove to be a valuable tool to investigators studying TLR biology in other contexts.
RESULTS:
Epithelial TLR expression differs dramatically between the SI and colon
To mark TLR-expressing cells, we generated mice that report the presence of endogenous TLR2, 4, 5, 7 or 9 transcripts with the concurrent expression of a fluorescent protein. These reporter mice were designed to include an epitope tag, either HA or FLAG, at the 3’end of the endogenous TLR gene followed by an internal ribosome entry site and GFP, YFP, or tomato (Figure 1A, Table S1). This strategy allows for the tracking of TLR-expressing cells via cytoplasmic fluorescence. Splenic dendritic cells (DCs) express TLR2, 4, 5, 7 and 9 (Edwards 2003), and we confirmed that each of the reporter genes was expressed in CD11c+ DCs isolated from reporter mouse spleens (Figure 1B).
Figure 1: Epithelial TLR expression differs dramatically between the SI and colon.

(A)Design of TLR reporter mice. A reporter cassette including an epitope tag (HA or FLAG) and an internal ribosome entry site followed by a fluorescent protein (eGFP, eYFP, or tdTomato) was inserted at the 3’ end of the endogenous TLR gene for the TLRs indicated. Note: for simplicity, the exon/intron structure for each TLR is not shown.
(B) Expression of TLR reporter genes was confirmed by measuring fluorescence (GFP/YFP or tomato) by flow cytometry from live, CD11c+ cells from the spleens of indicated mice. Flow cytometry plots are representative of 2 independent experiments, each including at least 3 mice of each genotype.
(C) SI and colon sections of reporter mice stained with Epcam (epithelial cells) and antibodies to either GFP/YFP or tomato (TLR reporters). All SI images were from the ileum. Images were taken at 20× magnification and exposures were set using staining of WT mouse tissues. Images are representative of at least 3 independent experiments, each including 2–5 mice of each genotype. Scale bars are 50 microns.
(D) TLR expression in IECs was assessed by RNA-sequencing performed on IECs isolated from WT mice from 2 litters. Values are displayed as a number of transcripts per million total reads. Error bars are mean +/− SEM.
(E) Proximal colon sections from radiation chimeras in which WT bone marrow was reconstituted into WT or TLR reporter mice stained with Epcam (epithelial cells) and antibodies to the HA epitope tag (TLR protein). HA staining is separated in bottom panels for easier visualization. Images were taken at 20× magnification and exposures were set using staining of WT mouse tissues. White arrows indicate apical staining, yellow arrows indicate basolateral staining, and stars indicate intracellular staining. Images are representative of 2 independent experiments, each including 1–4 mice of each genotype. Scale bars are 50 microns.
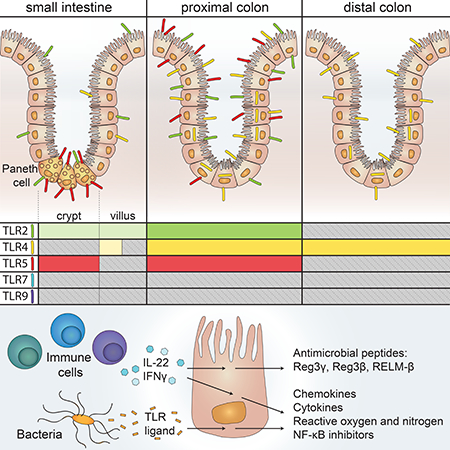
To visualize TLR expression in situ, we used antibodies specific for GFP/YFP or tomato in SI and colon tissue sections from TLR reporter mice (Figure 1C). This assay revealed that TLR expression was not uniform in the gastrointestinal tract. We observed very low GFP levels throughout the SI epithelium in TLR2GFP mice. Low levels of GFP were also present in the SI of TLR4YFP mice, although the expression was more heterogeneous. TLR5TOM mice had the most unique pattern of SI epithelial expression, with tomato excluded from all IECs except for a small subset of cells in the SI crypt. When we looked more closely along the length of the SI (Figure S1), we noticed similar low levels of reporter expression throughout the epithelium of TLR2GFP and TLR4YFP mice. Tomato staining in the SI crypt of TLR5TOM mice was minimal in the proximal SI and more prominent in the distal SI. In contrast to the low or restricted staining in the SI, we observed high levels of epithelial reporter expression in the proximal colons of TLR2GFP, TLR4YFP, and TLR5TOM mice and similarly high levels in the distal colons of TLR4YFP reporter mice (Figure 1C). We did not observe epithelial reporter expression in SI and colon sections from TLR7TOM and TLR9GFP mice. This lack of expression directly contrasts with strong staining of TLR7- and TLR9-expressing cells in the lamina propria of these mice and suggests that these two TLRs are not expressed or are expressed at extremely low levels in IECs under homeostatic conditions.
To confirm these distinct expression profiles, we assayed reporter fluorescence in isolated IECs using flow cytometry (Figure S2A). Significant levels of autofluoresence of IECs in the GFP/YFP fluorescent channel reduces the sensitivity of this approach; however, we were able to detect low levels of GFP/YFP fluorescence in proximal and distal colon IECs from TLR4YFP mice and much more substantial tomato fluorescence in proximal colon IECs from TLR5TOM mice. We further confirmed the presence of TLR2 and TLR5 protein in SI IECs and TLR2, TLR4, and TLR5 protein in colon IECs using the HA epitope tag inserted at the C-terminus of the TLR protein in these reporter mice (Figure S2B).
We reasoned that epithelial TLR expression might change during intestinal inflammation. However, we did not observe any differences in TLR expression by IECs during dextran sodium sulfate (DSS)-induced colitis (Figure S3) or infection with Salmonella Typhimurium (data not shown), suggesting that homeostatic TLR expression patterns in IECs are preserved during intestinal infection and inflammation.
To complement our reporter mouse experiments and characterize the expression of additional TLRs, we performed RNA-sequencing on IECs isolated from C57BL/6 wild-type (WT) mice SI and colons (Figure 1D, Table S4). This analysis confirmed our observation of undetectable/extremely low epithelial expression of TLR7 and TLR9. TLR6, 8, 11, 12, and 13 were similarly not detected or had extremely low levels of recovered sequences in both SI and colon IECs. These data also verified our observed low level of expression of TLR2, 4, and 5 in SI IECs and higher expression of these same TLRs in colon IECs. TLR1, which must dimerize with TLR2 to function, was expressed at a moderate level in SI IECs and a significantly higher level in colon IECs. TLR3 was expressed at similar levels by both SI and colon IECs.
The cellular localization of TLRs in IECs has been a matter of some debate in the field. To determine the localization of TLRs in our reporter mice, we utilized the HA epitope tag that was engineered into TLR2GFP, TLR4YFP, TLR5TOM, and TLR9GFP mice. Since we observed high levels of TLR expression in lamina propria cells, we first generated radiation chimeras by reconstituting TLR reporter mice with WT bone marrow to limit HA staining to nonhematopoietic cells and potentially a small percentage of radioresistant host immune cells. When we looked at the localization of HA in the proximal colons of these chimeras (Figure 1E), we noticed apical and basolateral staining in IECs from TLR2GFP, TLR4YFP, and TLR5TOM mice. We also observed intracellular clusters of HA in some IECs in TLR4YFP mice, which corroborates previous reports of intracellular TLR4 in epithelial cell lines (Hornef et al., 2002). We did not observe epithelial HA staining in TLR9GFP mice above background levels. Unfortunately, we were unable to reliably detect HA staining in SI IECs, likely due to lower levels of TLR expression and higher levels of background in this tissue. These findings support a model in which colon IECs can recognize TLR ligands present in both the lumen and lamina propria.
TLR5 expression is restricted to Paneth cells in the SI epithelium
We next sought to identify the cell type(s) expressing TLR5 in the SI crypt. We observed that tomato staining in the SI crypts of TLR5TOM mice specifically co-stained with the Paneth cell-specific marker lysozyme (Figure 2A), suggesting that the TLR5expressing cells were Paneth cells. Using TLR5TOM reporter mice to crossed LGR5-GFP mice, in which intestinal stem cells are marked with GFP (Barker et al., 2007), we found that tomato very clearly colocalized with lysozyme staining but not with GFP+ stem cells (Figure 2B). Analysis of the other TLR reporter mice indicated that Paneth cells also express low levels of TLR2 but undetectable levels of TLR4, TLR7, or TLR9 (Figure 2A).
Figure 2: TLR5 expression is restricted to Paneth cells in the SI epithelium.

(A) SI sections from reporter mice stained for lysozyme (Paneth cells) and antibodies to either GFP/YFP or tomato (TLR reporters). Images were taken at 63× magnification and exposures were set using staining of WT mouse SI. Images are representative of at least 2 independent experiments, each including 2–5 mice of each genotype. Scale bars are 50 microns.
(B) SI sections from TLR5TOM x LGR5-GFP mice were stained for tomato (TLR5), GFP (LGR5), and lysozyme (Paneth cells). Images were taken at 63× magnification and exposures were set using staining of WT mouse SI. Images are representative of 2 independent experiments, each including 2–5 mice. Scale bars are 10 microns.
(C) Tomato fluorescence from total IECs (live, CD45-Epcam+) or Paneth cells (live, CD45-Epcam+CD24+SSChi) isolated from crypt preparations from the SI of WT or TLR5TOM mice.
(D) Flow cytometry plot of total IECs from crypt preparations from TLR5TOM mice pregated on tomato expression. Tomato+ cells are shown in red and tomato-cells are shown in black. For C-D, flow cytometry plots are representative of 3 independent experiments, each including 2–5 mice.
(E) Tomato+ and tomato- IECs were sorted from SI crypt preparations from TLR5TOM mice and gene expression was assessed by quantitative RT-PCR. Due to low cell numbers, cells from three separate sorting experiments, including IECs from over twenty mice, were pooled to generate results. Results are shown as expression relative to beta actin.
(F) Paneth cells (CD24+SSChi) were gated from SI crypt preparations from indicated mice and reporter fluorescence was assessed using flow cytometry. Plots are representative of at least 3 independent experiments, each including 2–5 mice of each genotype.
To confirm TLR5 expression by Paneth cells using a non-histologic approach, we isolated IECs from SI of TLR5TOM mice using a crypt enrichment protocol described by Sato et al. (Sato and Clevers, 2013a) (Figure 2C-F). In these preparations, a small percentage of cells from TLR5TOM mice were tomato-positive, but this percentage was increased substantially by pre-gating on cells that were CD24+ and side-scatter high, parameters previously shown to enrich for Paneth cells (Sato et al., 2011) (Figure 2C, D). Additionally, we performed quantitative RT-PCR on sorted tomato-positive and -negative cells from crypt-enriched IEC preparations from TLR5TOM mice. These analyses confirmed that tomato levels correlated with both TLR5 expression and higher levels of alpha defensins, which are specifically expressed by Paneth cells (Figure 2E). Finally, we measured reporter fluorescence in CD24+SSChi Paneth cells gated from crypt preparations of all of our reporter mice (Figure 2F). We only detected reporter fluorescence in TLR5TOM mice, although it is possible that the autofluorescence of IECs limited our ability to detect low levels of GFP or YFP in these cells. Together, these results suggest that TLR5 is particularly important for microbial sensing by Paneth cells.
SI TLR5 expression gradually decreases during the neonatal period
We postulated that alterations in TLR expression might correlate with changes in microbial composition during early life or serve to protect neonatal mice from infections. Therefore, we examined reporter expression in SI and colons from mice at day 1 (d1) post-birth (Figure 3A, S4A). We observed no significant differences in neonatal SI or colon IECs from TLR2GFP, TLR4YFP, TLR7TOM or TLR9GFP mice compared to their adult counterparts. The pattern of tomato staining in colon IECs of d1 TLR5TOM mice was also similar to adult mice (Figure S4A) and was maintained throughout the neonatal period (Figure S4B). In contrast to TLR5TOM adults, TLR5TOM neonates had strong tomato staining throughout the SI epithelium (Figure 3A) that gradually diminished until roughly the time of weaning (Figure 3B). As tomato expression decreased in the villus epithelium, we began to observe expression of tomato in clustered lysozyme-positive Paneth cells in the SI crypt. Flow cytometric analyses of IECs isolated from the SI of TLR5TOM mice also confirmed the gradual decrease of TLR5 during the neonatal period (Figure 3C). In contrast, approximately 20–40% of colon IECs were tomato positive at all time points (Figure S4C).
Figure 3: SI TLR5 expression gradually decreases during the neonatal period.

(A) SI sections from d1 WT and TLR reporter mice were stained with antibodies to Epcam (epithelial cells) and GFP/YFP or tomato (TLR reporters). Images were taken at 20× and exposures were set using staining of WT sections. Images are representative of 2 independent experiments, each including 2–5 mice of each genotype. Scale bars are 50 microns.
(B) Timecourse of tomato reporter expression in SI sections from TLR5TOM mice stained with DAPI (nuclei), lysozyme (Paneth cells) and tomato (TLR5) and images were separated for easier comparison. Arrows denote tomato+ Paneth cells while asterisks denote tomato+ nonepithelial cells in the lamina propria. Images were taken at 20× and exposures were set using staining of WT sections. Images are representative of 2 independent experiments, each including 2–3 mice. Scale bars are 50 microns.
(C) Tomato fluorescence from total IECs isolated from WT or TLR5TOM SI at the indicated time points assessed using flow cytometry. Data are representative of 3 independent experiments, each including 2–5 mice of each genotype.
(D) The percentage of tomato+ SI IECs from indicated mice beginning one week after birth quantified by flow cytometry using gating strategy from (C). Results are pooled from 2–3 independent experiments and each time point includes mice from at least 2 separate litters. Error bars are mean +/− SEM.
(E) IECs were isolated from the SI of WT mouse from our colony (SPF) and WT mice housed in germ-free isolators (GF) and quantitative RT-PCR was performed to measure TLR expression over time. Values are normalized to expression of beta actin and then expressed as fold over the expression observed in IECs collected at day 7. For SPF mice, data represent 4 mice per time point and the experiment was repeated 2 times. For GF mice, results from 2 separate experiments were pooled to generate results. Error bars are mean +/− SD. Stars denote significant differences between expression values at a time point compared to the value at day 7.Significance was calculated using one-way ANOVA. All points without stars are not significant.
(F) Expression of TLR5 over time in SI IECs isolated from SPF and GF mice. Expression is relative to expression of beta actin. Significance was analyzed using students t-test. For E-F * p ≤ 0.5, ** p ≤ .01, *** p ≤ 0.001.
The decrease in TLR5 expression coincides with a period of significant change in the neonatal intestinal epithelium, and many of the transcriptional changes in that period are dependent on TLR and IL-1 family signaling (Rakoff-Nahoum et al., 2015). To determine whether signaling through TLR5 or other TLRs was responsible for the decrease in TLR5 expression, we crossed TLR5TOM mice to MyD88−/−Trif−/− mice, which are unable to signal through TLRs or IL-1 family cytokine receptors. We observed no differences in SI or colon IEC tomato expression between TLR5TOM and TLR5TOMxMyD88−/−Trif−/− mice (Figure 3D, Figure S4D).
To determine whether other signals from the microbiota regulate TLR expression during this neonatal window, we isolated IECs from WT mice raised in our facility (SPF) and from WT mice maintained in a germ-free (GF) facility and measured TLR expression at various time points using quantitative RT-PCR (Figure 3E, S4E). We did not see major changes in TLR expression in SPF or GF colon IECs over time (Figure S4E). Similarly, TLR2 and TLR4 expression in SI IECs from both sets of mice remained relatively constant (Figure 3E). In both SPF and GF SI IECs, TLR3 expression increased during the neonatal period, which has been reported previously in conventionally raised mice (Pott et al., 2012). TLR5 expression decreased in both SPF mice and GF mice. Closer comparison of the two sets of mice (Figure 3F) revealed that TLR5 expression decreased in GF mice to a similar degree as SPF mice up until weaning at d21. At this time point, TLR5 expression plateaued in GF mice while it continued to decrease in SPF mice. This difference suggests that the early signals that lead to decreased expression of TLR5 do not depend on the microbiota, while the adult level of TLR5 expression may be finetuned by direct or indirect signals from the microbiota. For example, it is possible that microbial signals lead to decreased expression of TLR5 specifically in Paneth cells.
The distinct patterns of TLR expression in adult IECs are maintained in intestinal organoids
IECs are conditioned by signals from commensal bacteria and underlying immune cells in the lamina propria (Peterson and Artis, 2014). We therefore investigated whether the patterns of TLR expression we observed in IECs were intrinsic to these cells or if they required external stimuli. We used epithelial organoids, which are three-dimensional epithelial structures generated from isolated primary gastrointestinal crypts. Organoids are superior to epithelial cell lines for multiple reasons, including the absence of transformation, the maintenance of apical-basolateral polarity, the presence of both crypt and villus structures, and the maintained composition of all epithelial cell lineages (Sato and Clevers, 2013b). We generated organoids from WT and TLR reporter mouse SI and colons. We also followed a protocol from Yin et al (Yin et al., 2014) to generate SI organoids that are “skewed” to generate a much higher proportion of Paneth cells. The Paneth cell skewed organoids appeared smaller and more granular than SI or colon organoids (Figure 4A). Nanostring transcript analysis confirmed the separate identity of SI, Paneth cell skewed, and colon organoids (Figure 4B). Paneth cell skewed organoids expressed higher levels of the Paneth cell specific lysozyme and alpha defensin genes, while colon organoids expressed higher levels of Lypd8 and Muc1.
Figure 4: The distinct patterns of TLR expression in adult IECs are maintained in intestinal organoids.

(A) Images from SI organoids, SI organoids skewed to enrich for Paneth cells, and colon organoids. Paneth cell skewed organoids are smaller, rounder, and contain dark granules. Images are representative of at least 5 independent experiments.
(B) RNA was isolated from SI, Paneth cell skewed, and colon organoids at day 6 after passage and the gene expression in these organoids was assessed using Nanostring. Each point represents an independent experiment. Values shown are the normalized number of transcripts detected. Error bars are mean +/− SEM. * p ≤ 0.5, ** p ≤ .01, *** p ≤ 0.001.
(C)Reporter fluorescence (YFP/GFP or tomato) in live, CD45-Epcam+ total IECs isolated from indicated organoids on day 6 after passage compared to baseline WT fluorescence in these channels. Flow cytometry plots are representative of 3 independent experiments, each including 2–5 mice of each genotype.
(D) TLR expression in SI and colon organoids at day 6 after passage assessed using RNA-sequencing. Values are transcripts per million. Error bars are mean +/− SEM.
(E) Tomato fluorescence in total IECs (live, CD45- Epcam+) or Paneth cells (live, CD45- Epcam+CD24+SSChi) from SI organoids from WT and TLR5TOM mice. Flow cytometry plots are representative of 3 independent experiments.
(F) Tomato fluorescence in total IECs (live, CD45- Epcam+) or Paneth cells (live, CD45- Epcam+CD24+SSChi) from organoids generated from d7 TLR5TOM mice. WT mouse organoids are shown as a control. Flow cytometry plots are representative of 2 independent experiments.
Reporter expression in organoids very closely mimicked expression in adult IECs in vivo, suggesting that IEC TLR expression patterns do not depend on signals from immune cells or the microbiota (Figure 4C). Specifically, we observed reporter fluorescence in TLR2GFP, TLR4YFP, and TLR5TOM colon organoids, but not in TLR7TOM or TLR9GFP colon organoids. We observed a hint of GFP fluorescence in TLR2GFP SI organoids but no fluorescence above background in SI organoids from TLR4YFP, TLR5TOM, TLR7TOM or TLR9GFP mice. The absence of detectable fluorescence in TLR4YFP mice is likely due to a combination of low expression of the reporter and high levels of autofluorescence in these cells, as we were able to detect Tlr4 transcripts in RNA-sequencing performed on cells isolated from WT SI organoids, albeit at very low levels (Figure 4D). The absence of detectable tomato in TLR5TOM SI organoids is likely due to the fact that TLR5 is only expressed in Paneth cells in these organoids, which comprise only 1–5% of the total cells. Indeed, when we pre-gated on CD24+SSChi cells to enrich for Paneth cells in IECs obtained from these SI organoids, the percentage of tomato positive cells increased from 1% to approximately 30% (Figure 4E). In Paneth cell skewed organoids, we observed a small level of GFP fluorescence in TLR2GFP organoids and a substantial population of tomato positive cells in TLR5TOM organoids (Figure 4D), which was increased by pre-gating on Paneth cell markers (Figure 4E). It is notable that the pattern of TLR5 expression in SI organoids is similar to the adult Paneth cell-restricted pattern rather than the neonatal pattern of ubiquitous epithelial expression.
This finding suggests that microbial signals are not required for Paneth cell-restricted TLR5 expression. The adult pattern of TLR5 expression is also observed when we generate organoids from 1 week old mice (Figure 4F), suggesting that neonatal intestinal stem cells are not intrinsically programmed to generate organoids that ubiquitously express TLR5. It is likely that there are additional signals in the neonatal intestinal environment that promote TLR5 expression in IECs.
TLR5 signaling initiates a common gene program in colon IECs and Paneth cells
The unique epithelial expression pattern of TLR5, with widespread expression in colon IECs and specific expression in SI Paneth cells, prompted us to investigate the consequences of TLR5 signaling in these two cell types. To measure TLR5-induced gene expression changes, we stimulated SI organoids, colon organoids, and Paneth cell skewed organoids by adding flagellin to the growth medium for 4 hours and then harvested RNA for RNA sequencing (Table S5). This approach preferentially stimulates the basolateral surface of IECs, which is supported by our observation of basolaterally-localized TLR5 in Figure 1E. RNA-sequencing confirmed that TLR5 was expressed at low levels in SI organoids and significantly higher levels in colonic IECs and Paneth cell skewed organoids (Figure 5A). We observed very minimal gene induction in flagellin-stimulated WT SI organoids, suggesting that the small percentage of TLR5-expressing Paneth cells in these cultures was insufficient to cause marked changes in global organoid gene expression (Figure 5B). In contrast, we observed significant gene induction in stimulated colon organoids and Paneth cell skewed organoids. Many genes were strongly induced in both cell types, including genes associated with NF-κb signaling and inhibition, such as NFkb2, Ikbα (Nfkbia), and A20 (Tnfaip3); cytokines and chemokines, including M-CSF (Csf1), TNF, and Ccl20; and genes involved in the generation of reactive oxygen and nitrogen species, such as Duox2, Nox1, and iNOS (Nos2) (Figure 5B, C). We confirmed the induction of many of these genes using quantitative RT-PCR (Figure S5A). Since flagellin can also activate the Naip/NLRC4 inflammasome and NLRC4 is expressed and functional in IECs (Figure S5B)(Rauch et al., 2017), we further confirmed that the gene induction we observed was dependent on TLR5 (Figure S5A). We also observed no obvious flagellin-induced cell death in organoids during the period of stimulation (data not shown).
Figure 5: TLR5 signaling initiates a common gene program in colon IECs and Paneth cells.

(A) Expression of TLR5 in Paneth cell skewed and colon organoids assessed using RNA-sequencing. Values are transcripts per million. Significance was determined using one-way ANOVA ** p ≤ .01.
(B) Volcano plots showing the results of RNA-sequencing on SI organoids, colon organoids, and Paneth cell skewed organoids. Genes are plotted by the average fold change vs. significance of their induction after stimulation with flagellin for 4 hours. Log10(q values) were capped at 20 for this analysis. Selected significantly induced genes are labeled.
(C) The top 30 most highly induced genes from flagellin-stimulated Paneth cell skewed organoids and colon organoids, listed from highest to lowest fold change in Paneth cell skewed organoids. Genes were pre-filtered on significance, with q values of <0.05. Genes from the top 30 most induced genes in stimulated Paneth cells that are induced less than 1.5-fold in colon organoids are highlighted in orange, and genes from the top 30 most induced genes in colon organoid that are induced less than 1.5 fold in Paneth cell skewed organoids are highlighted in purple. p-values listed as NA were not calculated because the counts for indicated genes included at least one outlier that did not fall within the normal distribution.
(D) Top 10 gene sets enriched in Paneth cell skewed organoids stimulated with flagellin using gene set enrichment analysis. For A-D, RNA-sequencing was performed on RNA from unstimulated and flagellin-stimulated SI organoids isolated from 3 independent experiments, colon organoids isolated from 4 independent experiments, and Paneth cell skewed organoids isolated from 6 independent experiments.
The degree of overlap between the genes induced by flagellin stimulation of colon organoids and Paneth cell skewed organoids was notable. Of the 30 most highly induced genes in stimulated Paneth cells organoids, only 5 were not also induced at least 1.5-fold in stimulated colon organoids. Similarly, of the 30 most highly induced genes in colon organoids only 6 were not induced at least 1.5-fold in stimulated Paneth cell organoids. We also did not identify significant induction of genes previously associated with Paneth cell function, such as antimicrobial peptides or intestinal growth factors (Clevers and Bevins, 2013). Instead, gene set enrichment analysis on induced genes in Paneth cell skewed organoids revealed multiple enriched gene sets associated with inflammatory signaling (Figure 5D). Taken together, these data indicate that TLR5 signaling initiates a common gene program in both colon enterocytes and Paneth cells.
Transcript analysis reveals distinct patterns of TLR- and cytokine-induced gene expression in SI and colon IECs.
We next examined whether the gene induction program we observed in flagellin-stimulated colon IECs and Paneth cells was unique to TLR5 signaling or was induced by TLR stimulation of IECs more generally. We also assessed responses to stimulation with IL-1β and IL-18, cytokines that signal through MyD88 and have been implicated in mucosal homeostasis, and to stimulation with IL-22 and IFNγ, cytokines that have been shown to regulate epithelial and Paneth cell responses. Building on our RNA-sequencing analyses, we designed a Nanostring codeset that included genes we identified as strongly induced by flagellin stimulation, genes previously associated with TLR-induced responses, genes associated with epithelial homeostasis, and Paneth cell-associated genes (Clevers and Bevins, 2013; Stadnyk, 2002). We analyzed RNA from WT SI, colon, and Paneth cell skewed organoids stimulated with ligands for TLR2, TLR3, TLR4, TLR5, TLR7, or TLR9 or stimulated with IL-1β, IL-18, IL-22, or IFNγ (Figure 6A, Table S2, Table S6).
Figure 6: Transcript analysis reveals distinct patterns of TLR- and cytokineinduced gene expression in SI and colon IECs.

(A) Heat map of gene expression results from Nanostring analysis. Organoids were stimulated with the indicated ligands or cytokines for 4 hours and total RNA was isolated and used for Nanostring analysis. Values shown are fold change over unstimulated organoids, calculated from the average of 3 independent experiments.
(B) Heat map of Nanostring results for a subset of genes associated with antimicrobial responses. Stimulation conditions that resulted in reproducible induction of multiple genes are shown. Values were calculated as in (A).
(C) Reg3γ expression levels in organoids stimulated with TLR ligands and cytokines determined using Nanostring. Results shown are normalized transcript counts.
(D) Fold induction of genes significantly induced by TLR ligands but not by IL-22 or IFNγ. TLR ligands that induced the strongest responses in Paneth cell skewed and colon organoids are shown. For C-D, each point represents Nanostring results from a separate experiment. Error bars are mean +/− SEM. Significance was determined by comparing normalized transcript counts to unstimulated condition using one-way ANOVA. * p ≤ 0.5, ** p ≤ .01, *** p ≤ 0.001.
As expected, TLR5 ligand stimulation of Paneth cell skewed organoids induced expression of the same genes identified in our RNA-sequencing analyses shown in Figure 5. In contrast, TLR2 ligand and IL-1β induced only a few of these genes. Ligands for other TLRs led to little, if any, gene induction, supporting the conclusion that TLR5 is the main TLR utilized for microbial sensing by Paneth cells.
Also as expected, we observed robust gene induction in colon organoids stimulated with TLR5 ligand. We observed a very similar pattern of gene induction in colon organoids stimulated with TLR2 ligand and IL-1β, which also overlapped with the genes induced by TLR5 stimulation of Paneth cells. This indicates that TLR or IL-1 family signaling induces a similar gene program in both enterocytes and Paneth cells. We confirmed the TLR-induced increases in iNOS (Nos2), Cxcl1, and Cxcl2 in colon organoids using flow cytometry or ELISA (Figure S6A-B).
One unexpected finding from this analysis was the lack of responses to TLR ligands or IL-1β in unskewed SI organoids. These functional data corroborate our findings from RNA-sequencing and analysis of our reporter mice, which both revealed very low TLR expression in SI IECs. We also observed lower expression of the IL1r1 chain of the IL-1 receptor in the SI compared to the colon (Figure S6C). We confirmed that downstream TLR signaling proteins and adaptors are expressed in SI IECs, further supporting that the lack of functional responses in these cells is due to low TLR expression levels and not limiting levels of accessory proteins (Figure S6D).
In contrast to our results with TLR ligands, we observed multiple genes induced in response to IL-22 and IFNγ in SI IECs, Paneth cell skewed organoids, and colon organoids. These cytokine responses correlated with high expression of IL-22 and IFNγR subunits in SI and colon IECs (Figure S6C). In Paneth cell skewed and colon organoids, multiple genes induced by TLR ligands were also induced by IL-22 and IFNγ. This overlap suggests that there may be some shared features of the in vivo epithelial response to IL-22 and IFNγ, which are secreted by immune cells in the lamina propria, and to cell intrinsic signaling through epithelial TLRs.
We observed almost no gene induction in response to stimulation of any organoids with ligands for TLR4, TLR7, TLR9, or with IL-18. The lack of a response to TLR7 and 9 ligands corresponds with our inability to detect reporter expression in IECs from TLR7TOM and TLR9GFP mice. The lack of response to stimulation with the TLR4 ligand lipopolysaccharide (LPS) is unexpected, as we see evidence of very high expression of TLR4 in colon IECs and colon organoids using reporter mice and RNA-sequencing. We confirmed that the same lot of LPS was capable of inducing a strong response in bone marrow macrophages (Figure 6E). We also observed limited gene induction in response to stimulation with the TLR3 ligand poly I:C in all organoids. However, since TLR3 signals through the adaptor TRIF, while all other TLRs assessed signal at least partially through MyD88, it is possible that our gene set underestimates Trif-induced responses.
One of the main subsets of genes that we expected to be modulated by TLR expression were antimicrobial genes. However, we did not observe significant increases in any of these genes in response to TLR stimulation (Figure 6B). This was most unexpected for Reg3γ, as levels of this protein can be modulated by Paneth cell specific expression of MyD88 (Vaishnava et al., 2008). Although we did see an increase in Reg3γ in colon organoids in response to stimulation with TLR2 ligands, this induction was not statistically significant (Figure 6C). In contrast, we observed very robust induction of Reg3γ and Reg3β by IL-22 and IFNγ in all organoids and induction of the antimicrobial protein RELM-β (Retnlb) by IL-22 and IFNγ in colon organoids. A role for IL-22 in inducing production of antimicrobial peptides has been well documented (Kinnebrew et al., 2012; Zheng et al., 2008), and while IFNγ has been directly linked to Paneth cell extrusion and release of antimicrobial contents (Farin et al., 2014; Raetz et al., 2013), the contribution of IFNγ to the expression of these genes is less well established. These results indicate that secretion of IL-22 and IFNγ by lamina propria immune cells likely plays a more significant role in induction of antimicrobial peptide expression by IECs than cell-intrinsic TLR signaling.
Identification of a TLR-specific gene program in IECs
Although many genes included in our gene set were induced by both TLRs and IL-22/IFNγ stimulation, a small set of genes was only induced by TLR ligands and IL-1β. This subset includes genes associated with NF-κB signaling (Nfkb2, Relb, and Ikbα (Nfkbia)), Birc3, TGFβ, and multiple components associated with the Nox1 NADPH oxidase (Nox1, Noxa1, Noxo1, and Cyba) (Figure 6D, S7A). The chemokine Ccl20 was also specifically induced by TLR/IL-1β stimulation, while Ccl20 levels were slightly decreased in response to IL-22 and IFN−γ stimulation (Figure 6A, Table S2).
The dramatic increase in Ccl20 levels in response to stimulation with multiple TLR ligands and the specific nature of its induction suggests that Ccl20 might be one of the most sensitive indicators of TLR signaling in IECs. We confirmed the presence of Ccl20 protein by ELISA in stimulated organoids (Figure S7B), and then used this chemokine as a readout for epithelial TLR signaling. Ccl20 levels were not increased in response to stimulation with ligands for TLR11/12 or TLR13 (Figure S7C), which corroborate our RNA sequencing results suggesting that these receptors are not expressed by IECs. Although we observed very low levels of expression of TLR6 by RNA sequencing, we observed responses to the TLR2/6 ligands Pam2Csk4, FSL-1, and MALP-2 in both Paneth cell skewed and colon organoids, suggesting that the very low level of TLR6 in IECs is functional. Finally, we determined that flagellin-induced Ccl20 levels are abrogated in MyD88−/− but not Trif−/− colon organoids, proving that TLR5 signaling in IECs, similar to its signaling in immune cells, relies primarily on MyD88 and not Trif as an adaptor (Figure S7D), contrasting with a previously published report (Choi et al., 2010).
In vivo confirmation of a TLR-induced gene program
To validate this TLR-induced gene program in vivo, we injected mice intraperitoneally with flagellin and used Nanostring to analyze transcriptional effects. In this model, injected flagellin will presumably preferentially access the basolateral surface of IECs. We focused on responses in colon IECs, as our reporter mice revealed that TLR5 is highly expressed in these cells and is present on the basolateral surface. To try to minimize potential secondary effects from immune cell signaling, we isolated colon IECs one hour after injection. We confirmed TLR5-dependent induction of multiple genes identified using TLR-stimulated organoids (Figure 7A), and a majority of the strongly induced genes were shared between in vivo and organoid analysis, although the fold change varied somewhat (Figure 7B). We corroborated these results at the protein level in radiation chimeras generated by reconstituting WT mice with TLR5−/− bone marrow. After injecting these chimeras with flagellin, we observed significantly increased protein levels of the chemokines Ccl20 and Cxcl1 in colonic homogenates. This rapid induction of chemokines by TLR signaling in the epithelium may play a role in responding to encroaching or translocated bacteria by contributing to the recruitment of immune cells crucial for the generation of a protective immune response.
Figure 7: In vivo confirmation of a TLR-induced gene program.

(A) Nanostring gene expression analysis of total RNA from colon IECs harvested 1 hour after intraperitoneal injection of 20 μg of flagellin or PBS. Results shown are normalized transcript counts. Each point represents an individual mouse. Error bars are mean +/− SEM. Significance was determined using one-way ANOVA. * p ≤ 0.5, ** p ≤ .01, *** p ≤ 0.001.
(B) Comparison of average fold change between flagellin-stimulated ex vivo colon IECs and colon organoids. Selected genes are labeled. Added line is x=y.
(C) Ccl20 and Cxcl1 levels in colon homogenates from indicated radiation chimeras 1 hour after intraperitoneal injection with PBS or 20 μg flagellin measured using ELISA. Error bars are mean +/− SEM. Results are representative of two independent experiments, each including 3–6 mice per condition. Significance was determined using one-way ANOVA. * p ≤ 0.5, ** p ≤ .01, *** p ≤ 0.001.
DISCUSSION:
IECs are uniquely poised to directly interact with intestinal microbes, and elucidating the specific mechanisms and consequences of these interactions is necessary for a complete understanding of intestinal homeostasis and immunity. Although it has been widely claimed that IECs express most TLRs, reports supporting these findings often utilized cell lines, quantitative PCR, or antibodies of questionable specificity. Additionally, a vast majority of these studies used cell lines rather than primary IECs or epithelial organoids, leaving the transcriptional response to TLR activation in primary IECs incompletely characterized. In this resource, we addressed both of these unresolved issues in the field. First, we used five strains of TLR reporter mice to define spatial and temporal patterns of TLR expression in the epithelium of the SI and colon. Next, we utilized intestinal organoids and multiple analytical methods to determine the transcriptional response to stimulation with a variety of TLR ligands. Together, these results outline the expression and function of TLRs specifically in IECs and clarify the potential role of epithelial TLRs in immune responses to commensal or pathogenic microbes.
One of the most surprising findings from this study was the spatial compartmentalization of TLR expression and TLR-induced functional responses in the intestine. We observed very low or no expression of TLR2, 4, 5, 7, and 9 in the SI epithelium, which was further supported by the minimal responses to TLR stimulation in SI organoids. In contrast, expression of TLR2, 4, and 5 was much greater in the colon, and colon organoids responded robustly when stimulated with TLR2 and TLR5 ligands. It is unclear why TLR expression is segregated in this fashion in the intestinal tract. Unrestrained TLR signaling in IECs has been shown to result in intestinal pathology (Fukata et al., 2011; Vereecke et al., 2010), and it is possible that the SI is more sensitive to these perturbations than the colon. Since the SI and colon harbor a distinct composition and different densities of bacteria (Donaldson et al., 2016), it is also possible that the bacteria in the SI are more immunostimulatory and that these responses need to be actively suppressed in this tissue.
The HA epitope tag in our reporter mice allowed us to visualize the localization of TLR proteins in the epithelium in situ. Although multiple reports have suggested a restricted localization of TLR proteins to the basolateral surface of IECs (Yu and Gao, 2015), most notably for TLR5 (Gewirtz et al., 2001; Rhee et al., 2005), we observed HA staining in TLR2GFP, TLR4YFP, and TLR5TOM mice on both the apical and basolateral surfaces of proximal colon IECs. We additionally noted intracellular TLR4 in colon IECs. This suggests that IECs can respond to both lumenal ligands and ligands from microbes that have translocated across the epithelium. Our functional assays relied on adding ligands to whole organoids, which preferentially stimulates the basolateral surface of IECs where we observed strong HA staining, but it remains formally possible that stimulation of apical TLRs could lead to a distinct transcriptional response.
We also revealed that TLR5 expression is restricted to Paneth cells in the SI epithelium. Our results demonstrated that the transcriptional response to TLR5 ligand in Paneth cells is very similar to the response in colon enterocytes, raising the possibility that TLR5 is expressed in Paneth cells not because of a unique function of these cells, but rather due to the unique localization of these cells in the SI crypt. Sensing of cryptlocalized bacteria by TLR5 during infection or inflammation-induced dysbiosis may contribute to a localized immune response, both directly through generation of reactive oxygen and nitrogen and indirectly through the production of factors that lead to the recruitment and enhanced function of immune cells. It has also been proposed that Ccl20 can be directly antimicrobial (Yang et al., 2003), and thus the rapid induction of this chemokine might enhance local immunity through multiple mechanisms. By initiating immune responses in the crypt, TLR5 in Paneth cells may protect intestinal stem cells and Paneth cells themselves from damage. This role might be especially relevant as dysregulated Paneth cell responses have been associated with the development of inflammatory bowel disease (Adolph et al., 2013).
Another interesting observation was the gradual decrease of TLR5 expression in SI IECs during the postnatal period. The reason for this decrease and the mechanisms leading to this effect remain unclear. We hypothesize that the high level of neonatal TLR5 expression may play an important role in SI IECs during this developmental window. Our results with SI organoids and GF mice suggest that microbial signals are not required for adoption of the adult pattern of TLR5 expression. Although more challenging to test, it appears likely that the decrease in TLR5 may be a regulated developmental process. It is interesting that, of the TLRs we tested, TLR5 is uniquely regulated in a spatial, cell-type specific, and temporal manner. Unlike other TLRs, TLR5 recognizes a bacterial component, flagellin, that is often associated with pathogens. Thus, it is possible that epithelial TLR5 levels are regulated to protect the SI from motile intestinal pathogens during specifically vulnerable time periods (such as early life) and at specifically vulnerable locations (such as the SI crypt).
Although we observed TLR4 expression in SI and colon IECs and colon organoids, we were unable to detect functional responses to the TLR4 ligand LPS in organoids. This suggests that there may be additional mechanisms in place to specifically blunt TLR4 signaling. It has been reported that signaling through epithelial TLR4 immediately after birth leads to the induction of the microRNA miR-146a, which subsequently degrades the signaling molecule IRAK1 and promotes epithelial innate immune tolerance (Chassin et al., 2010). It is possible that our analysis missed an initial rapid burst of TLR4 signaling that resulted in tolerance and blunted our ability to detect later transcriptional responses. Alternatively, although we observe TLR4 protein on both the apical and basolateral surface of colon IECs ex vivo, it is possible that TLR4 protein is post-transcriptionally regulated or differentially localized in organoids. The specific regulation of TLR4 signaling in IECs may be necessary to preserve intestinal homeostasis, as over-active epithelial TLR4 signaling leads to enhanced pathology in multiple mouse models (Fukata et al., 2011).
The epithelial TLR-induced gene program that we identified confirmed many previously identified TLR target genes and also provided some unexpected results. Chemokines have been one of the most consistent readouts of epithelial TLR signaling, and correspondingly, we observed increased expression of Cxcl1, Cxcl2, and Ccl20. Although iNOS (Nos2) has been well characterized as a TLR-induced gene, we were not expecting to observe such strong induction of multiple components of two NADPH-oxidases, Duox2 and Nox1. It is unclear whether the reactive oxygen species generated by these complexes in IECs would be directly antimicrobial, as has been demonstrated for Duox2 in protecting against microbial challenge in Drosophila (Ha et al., 2005), or if reactive oxygen plays an indirect role in enhancing inflammatory signaling pathways (Ogier-Denis et al., 2008). Perhaps more surprising was the lack of significant induction of genes that have been previously associated with epithelial TLR signaling, such as amphiregulin, epidermal growth factor, trefoil factors, and antimicrobial peptides (Abreu, 2010). It is likely that epithelial expression of these genes is induced in different contexts and may depend on extrinsic signals from other intestinal cell types. For example, our data suggest that expression of Reg3β and Reg3γ is potently induced by IL-22 and IFNγ, which are secreted locally by innate and adaptive immune cells in the lamina propria.
Although IECs reside at a critical interface between commensal and host, the difficulties associated with isolating and manipulating these cells have hindered investigations into the role of these cells during homeostasis and inflammation. By elucidating the expression and function of critical pattern recognition receptors on these cells, our study provides an important framework for understanding the role of IECs in directly sensing commensal bacteria and initiating defense programs. These interactions could prove crucial in the maintenance of intestinal homeostasis and also as factors contributing to the initiation and pathogenesis of inflammatory bowel disease and colorectal cancer.
STAR METHODS:
Contact for Reagent and Resource Sharing:
Further information and requests for resources and reagents should be directed to and will be fulfilled by the Lead Contact, Greg Barton (barton@berkeley.edu).
Experimental Model and Subject Details:
Germ-free C57BL/6 mice were maintained in gnotobiotic isolators at the University of California, Berkeley. All other mice were housed under specific pathogen-free conditions at the University of California, Berkeley. All mouse experiments were performed in accordance with the guidelines of the Animal Care and Use Committee at University of California Berkeley. Unless noted, mice were analyzed at 6–12 weeks of age. C57BL/6 mice and Lgr5-GFP were obtained from Jackson Laboratories and colonies were maintained in our laboratory. MyD88−/−, Trif−/−, and TLR5−/− mice were obtained from S. Akira (Osaka University). TLR7TOM, TLR9GFP, and TLRKO (TLR2−/−xTLR4−/−xUnc93b13d/3d) mice have been described (Roberts et al., 2017; Sivick et al., 2014).
To generate TLR2GFP, TLR4YFP, and TLR5TOM mice, targeting vectors were designed to include a 5’ homologous arm, a HA tag at the 3’ end of the endogenous gene, an IRES followed by a fluorescent protein (GFP for TLR2GFP, YFP for TLR4YFP, and tdTomato for TLR5TOM), and a 3’ homologous arm. The vector also introduced a loxP-flanked neomycin resistance cassette. Targeting vectors were electroporated into C57BL/6derived embryonic stem cells by the Mouse Biology Program at UC Davis. Targeting was assessed by Southern blot and correctly targeted ES cells were injected into ICR/CD1 blastocysts. Chimeric males were mated with C57BL/6 background EIIA-Cre females to remove the neomycin resistance cassette. Genotypes of resulting mice were confirmed by PCR. TLR2GFP, TLR4YFP, TLR5TOM, TLR7TOM, and TLR9GFP mice are available at The Jackson Laboratory Repository with the following JAX stock numbers: TLR2GFP (031822), TLR4YFP (031824), TLR5TOM (031825), TLR7TOM (031827), and TLR9GFP (031829). Queries can be initiated at http://jaxmice.jax.org/query.
Method Details:
Generation of radiation chimeras:
Chimeric mice were generated by irradiation of C57BL/6 mice with 900 rads. Indicated recipient mice were reconstituted with 5–10 × 106 bone marrow cells from donor mice. Mice were analyzed 10–12 weeks after cell transfer.
Imaging:
GFP/YFP and tomato staining: SI and colons were harvested from mice and flushed with calcium and magnesium free phosphate buffered saline (PBS, Gibco). Tissues were then cut into 5 cm pieces and incubated in PLP buffer (1% paraformaldehyde, 0.075 M Llysine, 0.37 M sodium phosphate and 0.01 M sodium periodate at pH 7.4) for 16–24 hours and then in 30% sucrose in PBS for 6–24 hours. Tissues from mice greater than 14 days of age were then flushed with a 50:50 mixture of PBS and optimal cutting temperature compound (OCT, Tissue-Tek) and all tissues were embedded in OCT. Tissue blocks were cut into 8 micron sections using a Leica cryostat, blocked with TrisNaCl blocking buffer (TNB, Perkin Elmer), mouse Fc block (UCSF antibody core) and 2.5% donkey serum (Jackson Immunoresearch) for 30 minutes, and stained with antibodies in TNB buffer. Antibodies used were polyclonal rabbit anti-GFP (1:1000 Novus), polyclonal rabbit anti-dsRed (1:400 Rockland), rabbit anti-human lysozymeFITC (1:400 Dako), and rat anti-mouse Epcam-APC (1:400 ebioscience clone G8.8). Donkey anti-rabbit Cy3 (1:400 Jackson Immunoresearch) was used as a secondary antibody and 4’,6-diamidino-2-phenylindole (DAPI, Thermo-Fisher) was used to stain cell nuclei. In between each step, slides were washed 2× with PBS.
HA staining of tissue sections:
Tissues were fixed and embedded as described for GFP/YFP and tomato staining. HA staining was adapted from a protocol by Farin et al. (Farin et al., 2016). Tissue blocks were cut into 50 micron sections using a Leica cryostat, incubated with Bloxall endogenous peroxidase and alkaline phosphatase blocking solution (Vector Labs) for 10 minutes, and blocked with M.O.M blocking reagent (Perkin Elmer) according to manufacturer’s instructions. Sections were then incubated with rat anti-HA in TNB buffer (1:500 Roche clone 3F10) at 4C overnight, incubated with rabbit anti-rat (1:400, Southern Biotech) in TNB for 1 hr at room temperature, and then incubated with PowerVision anti-rabbit poly-HRP (Leica Biosystems) for 30 minutes at room temperature. The latter two reagents were pre-blocked with 5% mouse serum. Sections were then incubated with TSA-Cy3 (Perkin-Elmer) diluted in Amplification Diluent per manufacturer’s instructions and then costained with rat anti-mouse EpcamAPC (1:200 ebioscience clone G8.8) and DAPI (Thermo-Fisher). In between each step, slides were washed 2× with PBS.
All slides were mounted using Vectashield mounting medium (Vector Labs) and images were collected using a LSM710 confocal microscope (Zeiss) at the Biological Imaging Facility at UC Berkeley and processed using ImageJ and Zen analysis software (Zeiss).
Isolation of intestinal epithelial cells:
SI and colons were harvested from mice, flushed with PBS, cut open longitudinally, and incubated with EDTA and 1 mM DTT for 30 minutes at 4C on a rocker. For RNA experiments 3 mM EDTA was used and for flow cytometry 30 mM EDTA was used. Supernatants were then passed through a 100 micron filter and centrifuged at 650×g for 5 minutes. For RNA, IECs were then resuspended in RNAzol, homogenized by passing repeatedly through a 25-gauge needle, and stored at 80C until RNA was isolated. For flow cytometry, IECs were further digested in 0.3 U/mL Dispase I (Roche) and 1 mg/mL DNAase I (Sigma) for 10 minutes at 37C. IECs were then centrifuged at 650×g for 5 minutes and resuspended in flow cytometry buffer (PBS plus 3% fetal calf serum, 1mM EDTA, and 0.05% azide) before treating with antiCD16/32 antibodies (UCSF Antibody core) and staining with antibodies to Epcam (ebioscience clone G8.8), CD45 (ebioscience clone 30-F11), and CD24 (ebioscience clone M1/69). 4’,6-diamidino-2-phenylindole (DAPI, Thermo-Fisher) was used to exclude dead cells. Before running, IECs were passed through a tube-top 35 micron filter. Data were collected on a LSR Fortessa (BD Biosciences) and analyzed using FlowJo software. Purity of IEC isolations was repeatedly assessed for RNA experiments and was consistently 95–99% CD45-IECs.
Isolation of splenic cells:
Spleens were minced with scissors and digested for 45 minutes with 50 mg/mL collagenase 8 (Sigma) and 5 ug/mL DNase (Sigma) in RPMI. Tissue was dissociated through a 70 micron filter, treated with ACK Lysis Buffer (Gibco) to eliminate red blood cells, and then resuspended in flow cytometry buffer. For flow cytometry, cells were stained with antibodies to CD11c (Tonbo clone N418) and dead cells were excluded using DAPI. Data were collected on a LSR Fortessa (BD Biosciences) and analyzed using FlowJo software.
Intestinal organoids:
SI and colon organoids were generated from indicated mice following the protocol from Sato et al (Sato and Clevers, 2013a). Briefly, SI and colons were collected, flushed with PBS, and cut open longitudinally. Villi were mechanically scraped from SIs, and SIs and colons were incubated with 3 mM EDTA for 30 minutes at 4C on a rocker. Supernatants were discarded and remaining tissue pieces were repeatedly dissociated in PBS by pipetting repeatedly through a 10 mL stripette. Resulting supernatants were passed through a 100 micron filter and crypts were enriched by repeated centrifugation at low speeds. Crypts were then embedded in Matrigel (BD) in 24 well plates. SI and colon organoids were incubated in Advanced DMEM/F12 (Life Technologies) supplemented with glutamine, penicillin/streptomycin, HEPES, B-27 (Life Technologies), N-acetylcysteine (Sigma), mouse epidermal growth factor (Life Technologies), mouse Noggin (R&D Systems) and 10% conditioned media from 293T cells expressing human R-spondin 1 (obtained from Calvin Kuo, Stanford University). Organoids were passaged every 6–7 days.
Skewing to Paneth cells:
following a protocol by Yin et al (Yin et al., 2014), SI organoids were first cultured in organoid media additionally supplemented with CHIR99021 (Stemgent) and valproic acid (Sigma) to expand stem cells, passaged, and then cultured in media supplemented with the inhibitors CHIR99021 and DAPT (Stemgent). Paneth cell identity was confirmed using flow cytometry, and cultures routinely contained 3060% Paneth cells.
Flow cytometry:
organoids were washed with warm PBS and then incubated with TrypLE Express (Gibco) for 10–15 minutes. Organoids were scraped from the plate and separated into single cells by repeated pipetting. Organoid-derived IECs were washed in PBS, treated with anti-CD16/32 and then stained with antibodies as described above for primary IECs. For intracellular staining of iNOS, organoids were fixed and permeabilized using BD Fix/Perm kit before staining with anti-iNOS antibody (Invitrogen clone CXNFT).
RNA experiments:
organoids were washed with warm PBS and incubated in Cell Recovery Solution (Corning) for 30 minutes at 4C with slow rocking. Organoids were then moved into 15 mL conicals, and gently dissociated with repeated pipetting. Cells were washed twice in cold PBS before resuspending in RNAzol (Molecular Research Center), homogenized by passage through a 25 gauge needle, and stored at −80 C until RNA isolation.
TLR ligand and cytokine stimulation:
organoids were stimulated by adding ligands and cytokines directly to the growth media. Ligands used were: (all from Invivogen, unless indicated otherwise): Pam3Csk4 (1 ug/mL), Pam2Csk4 (1 ug/mL), FSL-1 (20ug/mL), poly I:C (20 ug/mL), Ultrapure LPS from E. coli 0111:B4 (5 ug/mL), Ultrapure flagellin from S. typhimurium (100 ng/mL), R848 (1 ug/mL), CpG (1 nM), ORN Sa19 (1 ug/mL), MALP-2 (50 ng/mL, Novus Biologicals), profilin from Toxoplasma gondii (2 ug/mL, Sigma). Cytokines were purchased from R&D and used at the following concentrations: IL-1β (100 ng/mL), IL-18 (100 ng/mL), IL-22 (50 ng/mL), IFNγ (20 ng/mL). Organoids were stimulated for 4 hours before harvesting for RNA or 16 hours before collecting supernatants for ELISA.
Paneth cell sorting:
For isolation of tdTomato+ Paneth cells, crypts were prepared from SI of TLR5TOM mice following the crypt isolation protocol used for organoids described above. Crypts were then stained with antibodies and tomato+DAPI-CD45-Epcam+CD24+SSClo Paneth cells and control cells were sorted using an Influx sorter (BD Biosciences). Sorted cells were centrifuged in PBS, resuspended in RNAzol, and frozen at −80C until RNA isolation.
RNA isolation and PCR:
RNA from IECs and organoids was stored at −80C in RNAzol until purification. Total RNA was isolated using a DirectZol RNA purification kit (Zymo Research). RNA was treated with Turbo DNAse (Thermo Fisher) for 30 minutes and purified using a RNA Clean and Concentrator kit (Zymo Research). Total RNA was used for RNA-sequencing and Nanostring. cDNA was generated using iScript Reverse Transcription Supermix (Life Sciences). For quantitative RT-PCR, cDNA was mixed with appropriate primers (see Table S3) and SYBR green master mix (Thermo Fisher) and run on a QuantStudio 5 (Applied Biosystems).
RNA-sequencing:
For experiments using either isolated IECs or organoids, 1 ug of total RNA was used for rRNA depletion with the RiboZero depletion kit to prepare RNAsequencing library by using the TruSeq RNA sample prep kit (Illumina) according to manufacturer’s instructions. 50-cycle single-end RNA sequencing was performed on a HiSeq 4000 (Illumina). RNA library generation and sequencing was performed by the Functional Genomics Lab and the Vincent J. Coates Genomics Sequencing Laboratory at University of California Berkeley. Sequenced reads were quality-trimmed (cut-off of 30) with cutadapt and aligned to the mouse transcriptome (GRCm38, release 79) with Kallisto (Bray et al., 2016). Using R and Bioconductor packages, counts for each transcript were extracted using Sleuth, collapsed at the gene level, and analyzed for differential expression using DESeq2. Q-values (Benjamini-Hochberg correction) lower than 0.05 were considered significant. Heat maps were generated using MeV (Multiple Experiment Viewer) software. For analysis of primary SI and colon IECs, RNA from IECs isolated from 4 WT mice aged 4–8 weeks and RNA was analyzed (see Table S4). For RNA-sequencing of organoids, analysis was performed on RNA isolated from 3 separate experimental replicates of both unstimulated and flagellin-stimulated SI organoids, 4 separate experimental replicates of unstimulated and flagellin-stimulated colon organoids, and 6 separate experimental replicates of unstimulated and flagellinstimulated Paneth cell-skewed organoids (see Table S5).
Nanostring RNA analysis:
A gene codeset was designed to include TLR-induced genes from our RNA-sequencing experiments, genes associated with TLR signaling in other studies, intestinal homeostasis genes, and controls. To assess levels of alpha defensins, a universal probe that bound with over 95% identity to 16 alpha defensin genes was used. Total RNA from organoid samples or in vivo IEC samples were isolated as described above and run on a nCounter Sprint and data was normalized and analyzed using nSolver software (Nanostring). Normalized transcript counts are shown in Table S6.
ELISA:
Organoid supernatants and intestinal homogenates were assayed for Ccl20, Cxcl1, and Cxcl2 levels using mouse DuoSet ELISA kits (R&D Systems). For the development step, ELISA was incubated with OPD (Sigma) and hydrogen peroxide followed by incubation with 3M HCl. For homogenates, 2–3 cm of SI and colons were flushed with 5 mL PBS and homogenized in PBS using a Polytron rotor stator homogenizer. Homogenates were spun at 10,000×g for 5 minutes and supernatants were used for analysis. TNF and IL-6 levels were assessed using cytometric bead array mouse inflammation kit (BD) following the manufacturer’s instructions.
Immunoblot analysis:
total SI IECs, colon IECs or splenocytes were isolated using the protocols described above, centrifuged at 650×g for 5 minutes, and resuspended in 1 mL of lysis buffer (0.5M EDTA, 5M NaCl, 1M Tris-HCL, 0.5% NP-40) supplemented with protease and phosphatase inhibitors (Roche). Cell lysates were immunoprecipitated with anti-HA matrix. After washing in lysis buffer, matrix beads were boiled in SDS-PAGE loading buffer. Protein was run on a 7% gel and transferred to Immobilon-FL membrane. After blocking, membranes were probed with anti-HA antibody (Roche clone 3F10), followed by goat anti-rat-680 (Life Technologies). Membranes were scanned using a LiCor Odyssey, and images were analyzed using ImageJ.
In vivo flagellin injection:
Mice were injected intraperitoneally with 20 ug of flagellin (Invivogen, standard flagellin from S. typhimurium) in 300 ul PBS.
Dextran sodium sulfate (DSS) colitis model:
2% DSS (Affymetrix MW 40,000–50,000) was administered to indicated cohorts of mice in the drinking water. All cohorts used for experiments exhibited signs of colitis, including weight loss, watery or bloody stool, and shortened colons
Quantification and Statistical Analysis:
Statistical analysis was performed with the Prism software (GraphPad software). P values were determined using ordinary unpaired ANOVA or two-tailed Students’s t test as indicated. ◸p < 0.05, ◸◸p < 0.01, ◸◸◸p < 0.001.
Data and Software Availability:
The accession number for the RNA-sequencing of primary IECS from WT mice reported in this paper is GEO: GSE117520.
The accession number for the RNA-sequencing of flagellin-stimulated intestinal organoids reported in this paper is GEO: GSExxxxx.
Supplementary Material
Table S4: RNA-sequencing of primary IECs from WT mice, (related to Figure 1, STAR Methods). Gene expression data from RNA-sequencing performed on primary IECs isolated from SI and colons of WT mice. Values are transcripts per million. Further experimental details are provided in STAR methods.
Table S5: RNA-sequencing of flagellin-stimulated intestinal organoids, (related to Figure 5, STAR methods). Gene expression data from RNA-sequencing performed on WT SI, colon, and Paneth cell skewed organoids left unstimulated or stimulated with the indicated TLR ligands and cytokines for 4 hours. Values are transcripts per million. Further experimental details are provided in STAR methods.
Table S6: Nanostring transcript analysis of stimulated organoids, (related to Figure 6, STAR methods). Gene expression data from Nanostring transcript analysis performed on WT SI, colon, and Paneth cell skewed organoids left unstimulated or stimulated with the indicated TLR ligands and cytokines for 4 hours. Each condition includes three separate experimental replicates.
Highlights.
Reporter mice reveal distinct patterns of TLR expression in SI and colon IECs
TLR5 expression is restricted to Paneth cells in the SI epithelium
TLR signaling in IECs induces a specific program of host defense genes
IEC antimicrobial peptides are not induced by TLRs, but rather by immune signals
ACKNOWLEDGEMENTS:
We thank H. Nolla and A. Valeros (UC Berkeley Cancer Research Laboratory Flow Cytometry Facility) for assistance with cell sorting, J. Valencia and J. Xie for assistance cutting tissue sections, and E. Wu, K. Ching and B. Russell for technical assistance. We thank J. Price and members of the Barton and Vance labs for critical reading of the manuscript and helpful discussions and K. Pestal for help with the graphical abstract.
This work was supported by an Innovator Award from the Kenneth Rainin Foundation, NIH grants AI072429 and AI063302 to G.M.B., and a Burroughs Wellcome Fund Investigator in the Pathogenesis of Infectious Disease award to G.M.B. A.E.P was supported by an Irvington Postdoctoral Fellowship from the Cancer Research Institute. Microscopy was completed at the Biological Imaging Facility at UC Berkeley, supported in part by the NIH S10 program under award number 1S10RR026866–01. Sequencing was performed by the Vincent J. Coates Genomics Sequencing Laboratory at UC Berkeley, supported by NIH S10 OD018174 Instrumentation Grant.
Footnotes
DECLARATION OF INTERESTS:
The authors declare no competing interests.
Publisher's Disclaimer: This is a PDF file of an unedited manuscript that has been accepted for publication. As a service to our customers we are providing this early version of the manuscript. The manuscript will undergo copyediting, typesetting, and review of the resulting proof before it is published in its final citable form. Please note that during the production process errors may be discovered which could affect the content, and all legal disclaimers that apply to the journal pertain.
REFERENCES:
- Abreu MT (2010). Toll-like receptor signalling in the intestinal epithelium: how bacterial recognition shapes intestinal function. Nat. Rev. Immunol 10, 131–144. [DOI] [PubMed] [Google Scholar]
- Adolph TE, Tomczak MF, Niederreiter L, Ko H-J, Böck J, Martinez-Naves E, Glickman JN, Tschurtschenthaler M, Hartwig J, Hosomi S, et al. (2013). Paneth cells as a site of origin for intestinal inflammation. Nature 503, 272–276. [DOI] [PMC free article] [PubMed] [Google Scholar]
- Barker N, van Es JH, Kuipers J, Kujala P, van den Born M, Cozijnsen M, Haegebarth A, Korving J, Begthel H, Peters PJ, et al. (2007). Identification of stem cells in small intestine and colon by marker gene Lgr5. Nature 449, 1003–1007. [DOI] [PubMed] [Google Scholar]
- Chassaing B, and Darfeuille-Michaud A (2011). The commensal microbiota and enteropathogens in the pathogenesis of inflammatory bowel diseases. Gastroenterology 140, 1720–1728. [DOI] [PubMed] [Google Scholar]
- Chassaing B, Ley RE, and Gewirtz AT (2014). Intestinal epithelial cell toll-like receptor 5 regulates the intestinal microbiota to prevent low-grade inflammation and metabolic syndrome in mice. Gastroenterology 147, 1363–77.e17. [DOI] [PMC free article] [PubMed] [Google Scholar]
- Chassin C, Kocur M, Pott J, Duerr CU, Gütle D, Lotz M, and Hornef MW (2010). miR-146a Mediates Protective Innate Immune Tolerance in the Neonate Intestine. Cell Host Microbe 8, 358–368. [DOI] [PubMed] [Google Scholar]
- Choi YJ, Im E, Chung HK, Pothoulakis C, and Rhee SH (2010). TRIF Mediates Toll-like Receptor 5-induced Signaling in Intestinal Epithelial Cells. J. Biol. Chem 285, 37570–37578. [DOI] [PMC free article] [PubMed] [Google Scholar]
- Clevers HC, and Bevins CL (2013). Paneth cells: maestros of the small intestinal crypts. Annu. Rev. Physiol 75, 289–311. [DOI] [PubMed] [Google Scholar]
- Dheer R, Santaolalla R, Davies JM, Lang JK, Phillips MC, Pastorini C, Vazquez-Pertejo MT, and Abreu MT (2016). Intestinal Epithelial Toll-Like Receptor 4 Signaling Affects Epithelial Function and Colonic Microbiota and Promotes a Risk for Transmissible Colitis. Infect. Immun 84, 798–810. [DOI] [PMC free article] [PubMed] [Google Scholar]
- Donaldson GP, Lee SM, and Mazmanian SK (2016). Gut biogeography of the bacterial microbiota. Nat. Rev. Microbiol 14, 20–32. [DOI] [PMC free article] [PubMed] [Google Scholar]
- Farin HF, Karthaus WR, Kujala P, Rakhshandehroo M, Schwank G, Vries RGJ, Kalkhoven E, Nieuwenhuis EES, and Clevers H (2014). Paneth cell extrusion and release of antimicrobial products is directly controlled by immune cellderived IFN-γ. J. Exp. Med 211, 1393–1405. [DOI] [PMC free article] [PubMed] [Google Scholar]
- Farin HF, Jordens I, Mosa MH, Basak O, Korving J, Tauriello DVF, de Punder K, Angers S, Peters PJ, Maurice MM, et al. (2016). Visualization of a short-range Wnt gradient in the intestinal stem-cell niche. Nature. [DOI] [PubMed] [Google Scholar]
- Franchimont D, Vermeire S, El Housni H, Pierik M, Van Steen K, Gustot T, Quertinmont E, Abramowicz M, Van Gossum A, Devière J, et al. (2004). Deficient host-bacteria interactions in inflammatory bowel disease? The toll-like receptor (TLR)-4 Asp299gly polymorphism is associated with Crohn’s disease and ulcerative colitis. Gut 53, 987–992. [DOI] [PMC free article] [PubMed] [Google Scholar]
- Frisch SM, and Screaton RA (2001). Anoikis mechanisms. Curr. Opin. Cell Biol 13, 555–562. [DOI] [PubMed] [Google Scholar]
- Fukata M, Shang L, Santaolalla R, Sotolongo J, Pastorini C, España C, Ungaro R, Harpaz N, Cooper HS, Elson G, et al. (2011). Constitutive activation of epithelial TLR4 augments inflammatory responses to mucosal injury and drives colitis-associated tumorigenesis. Inflamm. Bowel Dis 17, 1464–1473. [DOI] [PMC free article] [PubMed] [Google Scholar]
- Gewirtz AT, Navas TA, Lyons S, Godowski PJ, and Madara JL (2001). Cutting edge: bacterial flagellin activates basolaterally expressed TLR5 to induce epithelial proinflammatory gene expression. J. Immunol 167, 1882–1885. [DOI] [PubMed] [Google Scholar]
- Gewirtz AT, Vijay-Kumar M, Brant SR, Duerr RH, Nicolae DL, and Cho JH (2006). Dominant-negative TLR5 polymorphism reduces adaptive immune response to flagellin and negatively associates with Crohn’s disease. Am. J. Physiol. Gastrointest. Liver Physiol 290, G1157–G1163. [DOI] [PubMed] [Google Scholar]
- Ha E-M, Oh C-T, Bae YS, and Lee W-J (2005). A direct role for dual oxidase in Drosophila gut immunity. Science 310, 847–850. [DOI] [PubMed] [Google Scholar]
- Hornef MW, Frisan T, Vandewalle A, Normark S, and Richter-Dahlfors A (2002). Toll-like receptor 4 resides in the Golgi apparatus and colocalizes with internalized lipopolysaccharide in intestinal epithelial cells. J. Exp. Med 195, 559–570. [DOI] [PMC free article] [PubMed] [Google Scholar]
- Kinnebrew MA, Buffie CG, Diehl GE, Zenewicz LA, Leiner I, Hohl TM, Flavell RA, Littman DR, and Pamer EG (2012). Interleukin 23 production by intestinal CD103(+)CD11b(+) dendritic cells in response to bacterial flagellin enhances mucosal innate immune defense. Immunity 36, 276–287. [DOI] [PMC free article] [PubMed] [Google Scholar]
- Lodes MJ, Cong Y, Elson CO, Mohamath R, Landers CJ, Targan SR, Fort M, and Hershberg RM (2004). Bacterial flagellin is a dominant antigen in Crohn disease. J. Clin. Invest 113, 1296–1306. [DOI] [PMC free article] [PubMed] [Google Scholar]
- Ogier-Denis E, Mkaddem S Ben, and Vandewalle A (2008). NOX enzymes and Tolllike receptor signaling. Semin. Immunopathol 30, 291–300. [DOI] [PubMed] [Google Scholar]
- Peterson LW, and Artis D (2014). Intestinal epithelial cells: regulators of barrier function and immune homeostasis. Nat. Rev. Immunol 14, 141–153. [DOI] [PubMed] [Google Scholar]
- Pierik M, Joossens S, Van Steen K, Van Schuerbeek N, Vlietinck R, Rutgeerts P, and Vermeire S (2006). Toll-like receptor-1, −2, and −6 polymorphisms influence disease extension in inflammatory bowel diseases. Inflamm. Bowel Dis 12, 1–8. [DOI] [PubMed] [Google Scholar]
- Pott J, Stockinger S, Torow N, Smoczek A, Lindner C, McInerney G, Bäckhed F, Baumann U, Pabst O, Bleich A, et al. (2012). Age-dependent TLR3 expression of the intestinal epithelium contributes to rotavirus susceptibility. PLoS Pathog. 8, e1002670. [DOI] [PMC free article] [PubMed] [Google Scholar]
- Raetz M, Hwang S-H, Wilhelm CL, Kirkland D, Benson A, Sturge CR, Mirpuri J, Vaishnava S, Hou B, Defranco AL, et al. (2013). Parasite-induced TH1 cells and intestinal dysbiosis cooperate in IFN-γ-dependent elimination of Paneth cells. Nat. Immunol 14, 136–142. [DOI] [PMC free article] [PubMed] [Google Scholar]
- Rakoff-Nahoum S, Paglino J, Eslami-Varzaneh F, Edberg S, and Medzhitov R (2004). Recognition of commensal microflora by toll-like receptors is required for intestinal homeostasis. Cell 118, 229–241. [DOI] [PubMed] [Google Scholar]
- Rakoff-Nahoum S, Kong Y, Kleinstein SH, Subramanian S, Ahern PP, Gordon JI, and Medzhitov R (2015). Analysis of gene-environment interactions in postnatal development of the mammalian intestine. Proc. Natl. Acad. Sci. U. S. A 112, 1929–1936. [DOI] [PMC free article] [PubMed] [Google Scholar]
- Rauch I, Deets KA, Ji DX, von Moltke J, Tenthorey JL, Lee AY, Philip NH, Ayres JS, Brodsky IE, Gronert K, et al. (2017). NAIP-NLRC4 Inflammasomes Coordinate Intestinal Epithelial Cell Expulsion with Eicosanoid and IL-18 Release via Activation of Caspase-1 and −8. Immunity 46, 649–659. [DOI] [PMC free article] [PubMed] [Google Scholar]
- Rhee SH, Im E, Riegler M, Kokkotou E, O’brien M, and Pothoulakis C (2005). Pathophysiological role of Toll-like receptor 5 engagement by bacterial flagellin in colonic inflammation. Proc. Natl. Acad. Sci. U. S. A 102, 13610–13615. [DOI] [PMC free article] [PubMed] [Google Scholar]
- Roberts AW, Lee BL, Deguine J, John S, Shlomchik MJ, and Barton GM (2017). Tissue-Resident Macrophages Are Locally Programmed for Silent Clearance of Apoptotic Cells. Immunity 47, 913–927.e6. [DOI] [PMC free article] [PubMed] [Google Scholar]
- Rose WA, Sakamoto K, and Leifer CA (2012). TLR9 is important for protection against intestinal damage and for intestinal repair. Sci. Rep 2, 574. [DOI] [PMC free article] [PubMed] [Google Scholar]
- Sato T, and Clevers H (2013a). Primary mouse small intestinal epithelial cell cultures. Methods Mol. Biol 945, 319–328. [DOI] [PubMed] [Google Scholar]
- Sato T, and Clevers H (2013b). Growing self-organizing mini-guts from a single intestinal stem cell: mechanism and applications. Science 340, 1190–1194. [DOI] [PubMed] [Google Scholar]
- Sato T, van Es JH, Snippert HJ, Stange DE, Vries RG, van den Born M, Barker N, Shroyer NF, van de Wetering M, and Clevers H (2011). Paneth cells constitute the niche for Lgr5 stem cells in intestinal crypts. Nature 469, 415–418. [DOI] [PMC free article] [PubMed] [Google Scholar]
- Sivick KE, Arpaia N, Reiner GL, Lee BL, Russell BR, and Barton GM (2014). Toll-like Receptor-Deficient Mice Reveal How Innate Immune Signaling Influences Salmonella Virulence Strategies. Cell Host Microbe 15, 203–213. [DOI] [PMC free article] [PubMed] [Google Scholar]
- Stadnyk AW (2002). Intestinal epithelial cells as a source of inflammatory cytokines and chemokines. Can. J. Gastroenterol 16, 241–246. [DOI] [PubMed] [Google Scholar]
- Tjalsma H, Boleij A, Marchesi JR, and Dutilh BE (2012). A bacterial driverpassenger model for colorectal cancer: beyond the usual suspects. Nat. Rev. Microbiol 10, 575–582. [DOI] [PubMed] [Google Scholar]
- Török HP, Glas J, Endres I, Tonenchi L, Teshome MY, Wetzke M, Klein W, Lohse P, Ochsenkühn T, Folwaczny M, et al. (2009). Epistasis Between Toll-Like Receptor-9 Polymorphisms and Variants in NOD2 and IL23R Modulates Susceptibility to Crohn’s Disease. Am. J. Gastroenterol 104, 1723–1733. [DOI] [PubMed] [Google Scholar]
- Vaishnava S, Behrendt CL, Ismail AS, Eckmann L, and Hooper LV (2008). Paneth cells directly sense gut commensals and maintain homeostasis at the intestinal host-microbial interface. Proc. Natl. Acad. Sci. U. S. A 105. [DOI] [PMC free article] [PubMed] [Google Scholar]
- Vereecke L, Sze M, Mc Guire C, Rogiers B, Chu Y, Schmidt-Supprian M, Pasparakis M, Beyaert R, and van Loo G (2010). Enterocyte-specific A20 deficiency sensitizes to tumor necrosis factor-induced toxicity and experimental colitis. J. Exp. Med 207, 1513–1523. [DOI] [PMC free article] [PubMed] [Google Scholar]
- Yang D, Chen Q, Hoover DM, Staley P, Tucker KD, Lubkowski J, and Oppenheim JJ (2003). Many chemokines including CCL20/MIP-3alpha display antimicrobial activity. J. Leukoc. Biol 74, 448–455. [DOI] [PubMed] [Google Scholar]
- Yin X, Farin HF, van Es JH, Clevers H, Langer R, and Karp JM (2014). Nicheindependent high-purity cultures of Lgr5+ intestinal stem cells and their progeny. Nat. Methods 11, 106–112. [DOI] [PMC free article] [PubMed] [Google Scholar]
- Yu S, and Gao N (2015). Compartmentalizing intestinal epithelial cell toll-like receptors for immune surveillance. Cell. Mol. Life Sci 72, 3343–3353. [DOI] [PMC free article] [PubMed] [Google Scholar]
- Zheng Y, Valdez PA, Danilenko DM, Hu Y, Sa SM, Gong Q, Abbas AR, Modrusan Z, Ghilardi N, de Sauvage FJ, et al. (2008). Interleukin-22 mediates early host defense against attaching and effacing bacterial pathogens. Nat. Med 14, 282–289. [DOI] [PubMed] [Google Scholar]
Associated Data
This section collects any data citations, data availability statements, or supplementary materials included in this article.
Supplementary Materials
Table S4: RNA-sequencing of primary IECs from WT mice, (related to Figure 1, STAR Methods). Gene expression data from RNA-sequencing performed on primary IECs isolated from SI and colons of WT mice. Values are transcripts per million. Further experimental details are provided in STAR methods.
Table S5: RNA-sequencing of flagellin-stimulated intestinal organoids, (related to Figure 5, STAR methods). Gene expression data from RNA-sequencing performed on WT SI, colon, and Paneth cell skewed organoids left unstimulated or stimulated with the indicated TLR ligands and cytokines for 4 hours. Values are transcripts per million. Further experimental details are provided in STAR methods.
Table S6: Nanostring transcript analysis of stimulated organoids, (related to Figure 6, STAR methods). Gene expression data from Nanostring transcript analysis performed on WT SI, colon, and Paneth cell skewed organoids left unstimulated or stimulated with the indicated TLR ligands and cytokines for 4 hours. Each condition includes three separate experimental replicates.