

Abstract
Background
Among community-dwelling older adults, frailty is associated with heightened markers of inflammation and subsequent mortality. Although frailty is common among ESRD patients, the role of frailty and markers of inflammation in this population remains unclear. We quantified these associations in patients on the kidney transplant (KT) waitlist and tested whether frailty and/or markers of inflammation improve waitlist mortality risk prediction.
Methods
We studied 1,975 ESRD patients on the KT waitlist (11/1/09–2/28/17) in a multi-center cohort study of frailty. Serum inflammatory markers (interleukin-6 [IL-6], soluble tumor necrosis factor-α receptor-1 [sTNFR1], and C-reactive protein [CRP]) were analyzed in 605 of these participants; we calculated the inflammatory index score using IL-6 and sTNFR1. We compared the C-statistic of an established registry-based prediction model for waitlist mortality adding frailty and/or inflammatory markers (1SD change in log IL-6, sTNFR1, CRP, or inflammatory index).
Results
The registry-based model had moderate predictive ability (c-statistic=0.655). Frailty was associated with increased mortality (2.19, 95%CI:1.26–3.79) but did not improve risk prediction (c-statistic=0.646; P=0.65). Like frailty, IL-6 (2.13, 95%CI:1.41–3.22), sTNFR1 (1.70, 95%CI:1.12–2.59), CRP (1.68, 95%CI:1.06–2.67), and the inflammatory index (2.09, 95%CI:1.38–3.16) were associated with increased mortality risk; unlike frailty, adding IL-6 (c-statistic=0.777; P=0.02), CRP (c-statistic=0.728; P=0.02), or inflammatory index (c-statistic=0.777; P=0.02) substantially improved mortality risk prediction.
Conclusion
Frailty and markers of inflammation were associated with increased waitlist mortality risk, but only markers of inflammation significantly improved ESRD risk prediction. These findings help clarify the accelerated aging physiology of ESRD and highlight easy to measure markers of increased waitlist mortality risk.
INTRODUCTION
Frailty is a syndrome of decreased physiologic reserve, characterized by multisystem dysregulation with a deep biological basis that becomes more evident during periods of stress (1). While initially characterized in older adults, frailty is now known to be highly prevalent in patients of all ages with end-stage renal disease (ESRD). Among patients undergoing hemodialysis, frailty is associated with falls (2), hospitalizations (3–5), poor cognitive function (6), decreased health-related quality of life (7), and mortality (3, 5). Additionally, among kidney transplant (KT) recipients, frailty is associated with delayed graft function (8), length of stay (9), early hospital readmission (10), immunosuppression intolerance (11), decreased health-related quality of life (12), impaired functioning (13), and mortality (14).
One of the hallmarks of frailty is thought to be chronic inflammation (15, 16). In community-dwelling older adults, frailty is associated with elevated markers of systemic inflammation, particularly interleukin-6 (IL-6), soluble tumor necrosis factor-α receptor-1 (sTNFR1), and C-reactive protein (CRP) (17–23). In a multi-center study of 762 hemodialysis patients, increased IL-6 levels were associated with an increase in the Fried frailty phenotype score (4). However, it is unclear whether frailty is associated with other elevated markers of systemic inflammatory markers across the spectrum of renal replacement therapies, including those who are on the KT waitlist.
Furthermore, elevated markers of inflammation in community-dwelling older adults is a strong predictor of mortality (24–26). It is unclear whether frailty and/or inflammatory markers are associated with mortality in a broader group of patients with ESRD on the KT waitlist and whether they improve waitlist mortality risk prediction in this population.
To better understand frailty and markers of inflammation in ESRD patients on the KT waitlist, we conducted a prospective study of patients on the KT waitlist. The goals of this study were to: 1) characterize the prevalence of frailty and levels of inflammation 2) test whether frailty is characterized by heightened inflammatory markers, 3) quantify the association between frailty, markers of inflammation, and waitlist mortality, and 4) estimate the improvement in mortality risk prediction associated with frailty and markers of inflammation.
MATERIALS AND METHODS
Study Design
This was a prospective, longitudinal cohort study that consecutively enrolled 1,975 ESRD who were being evaluated for KT at the Johns Hopkins Hospital, Baltimore, Maryland, from November 2009 to March 2016 (N=1,875) and the University of Michigan, Ann Arbor, Michigan, from January 2015 to May 2016 (N=100). Participants were English-speaking patients and aged 18 years or older who were evaluated for kidney transplantation at Johns Hopkins or University of Michigan. In this study, we measured frailty and obtained blood samples at the time of transplant evaluation, as described below. Additional participant characteristics that are consistent with data collected in the national registry of transplant recipients (Scientific Registry of Transplant Recipients [SRTR]) were also assessed at this time or abstracted from the transplant evaluation medical record (age, sex, race, ethnicity, cause of ESRD, blood type, BMI, time on dialysis, type of dialysis, education, smoking status, and previous transplant). The Johns Hopkins Institutional Review Board and the University of Michigan Institutional Review Board approved the study, and all participants provided written informed consent. This research is in adherence with the Declaration of Helsinki and the Declaration of Istanbul.
Frailty
We studied the physical frailty phenotype as defined (27) and validated by Fried in older adults (10, 18, 21, 23, 27–35) and by our group in ESRD and KT populations (2, 3, 6–11, 14, 36, 37). This phenotype is based on 5 components: shrinking (self-report of unintentional weight loss of more than 10 lbs in the past year based on dry weight); weakness (grip-strength below an established cutoff based on gender and BMI); exhaustion (self-report); low activity (Kcals/week below an established cutoff); and slowed walking speed (walking time of 15 feet below an established cutoff by gender and height) (27). Each of the 5 components was scored as 0 or 1, representing the absence or presence of that component, respectively. The aggregate frailty score was calculated as the sum of the component scores (range 0–5); nonfrail was defined as an aggregate score of 0, intermediate frailty was defined as a score of 1 or 2, and frailty was defined as a score of ≥3. The cut-points for nonfrail and intermediately frail differed from the standard calculation of the Fried physical frailty phenotype, because there were too few adults with ESRD who had none of the frailty components.
Markers of Inflammation
Serum samples were collected on a nondialysis day at the transplant evaluation (at the same visit that frailty was measured), then stored at −80°C. The serum inflammatory markers measured in these samples included interleukin-6 (IL-6), soluble tumor necrosis factor-α receptor-1 (sTNFR1), and C-reactive protein (CRP). Testing was performed using commercially available enzyme-linked immunosorbent assay kits (R&D Systems, Minneapolis, MN). IL-6 was measured using a High-Sensitivity Quantikine ELISA kit with a sensitivity of 0.11 pg/mL, and assay range of 0.2–10 pg/mL. sTNFR1 was measured using a Quantikine ELISA kit with a sensitivity of 1.2 pg/mL and assay range of 7.8–500 pg/mL. CRP was measured using a HSCRP ELISA kit with a sensitivity of 0.124 ng/mL and assay range of 1.9–150 ng/mL. All measurements were performed in duplicate and were repeated if the measures differed by more than 15% or were outside the measurable range. We log-transformed the average of the 2 measures to account for the nonnormal distribution of the individual inflammatory markers, as has been previously reported (20, 38). We calculated the inflammatory index score using IL-6 and sTNFR1, as has been previously published: [1/3 x log(IL-6)] + [2/3 x log(sTNFR1)] (20). To preserve stored samples, we only analyzed the most recent serum samples (from 4/2014); 80.6% of our full study population consented for blood draw.
Waitlist Mortality
All participants were evaluated for KT and on the KT waitlist at Johns Hopkins University or the University of Michigan. As such, mortality was recorded for all participants, even if they were removed from the waitlist (4%). We only considered deaths prior to transplantation as our outcome of interest.
Frailty and Markers of Inflammation
We used multinomial logistic regression to evaluate the cross-sectional association between each of the 3 individual inflammatory makers and the composite inflammatory index score with the frailty phenotype, treating this phenotype as a 3-level categorical outcome (nonfrail, intermediately frail, and frail), as has been previously published (37, 38). This model allowed us to compare frail to nonfrail and intermediately frail to nonfrail in the same model and to estimate associations between each measure of inflammation and each level of frailty status. Therefore, the associations were not constrained to be the same between each level of the outcome of frailty, as they would otherwise be in ordinal logistic regression. Models were adjusted for the factors that were included in an established, published registry-based prediction model (age, race, sex, blood type, and cause of ESRD) (39). Only participants with measured markers of inflammatory markers were included in this analysis (n=605). All analyses of the inflammatory markers evaluated the association between a 1 SD increase in the log transformed values of these continuous measures and frailty, as has previously been published (20, 38).
Frailty, Markers of Inflammation, and Waitlist Mortality
We then quantified the risk of waitlist mortality associated with frailty and the markers of inflammation (1 SD increase in the log values, as described above) using Cox proportional hazards models; hazard ratios (HR) measured the strength of the association between frailty (or the inflammatory markers) and waitlist mortality. For all models, we adjusted for factors included in the registry-based model (age, race, sex, blood type, and cause of ESRD). The mortality risks associated with frailty (n=1,975) and each marker of inflammation (n=605) were estimated separately. Participants were censored at the time of transplantation or administrative censoring (3/1/2017), as is standard with the registry-based model. Proportional hazards were confirmed visually by graphing the log-log plot of survival and statistically using Schoenfeld residuals. As sensitivity analyses, we quantified the association between frailty, markers of inflammation, and waitlist mortality after additionally adjusting for other mortality risk factors (smoking status and comorbidity) and using a competing risks survival regression (treating KT as a competing risk) based on Fine and Gray’s proportional subhazards model (40).
Waitlist Mortality Prediction by Frailty and Markers of Inflammation
We then calculated the model discrimination of the registry-based waitlist mortality model using Harrell’s C-statistic, a measure of concordance indicating the model’s ability to distinguish (discriminate) between recipients with different times until death. The C-statistic ranges from 0.5 (no discrimination) to 1.0 (perfect discrimination) and higher values indicate that the model more accurately predicts which patients will have longer survival. To this registry-based model we added frailty (n=1,975) and the markers of inflammation separately (n=605) and tested whether the C-statistic improved with the addition of these new risk factors; p-values for the difference in C-statistics were estimated using the z-statistic.
Statistical Analysis
For all analyses, a p-value <0.05 was considered significant. All analyses were performed using Stata 14.0 (College Station, Texas).
RESULTS
Study Population
Among 1,975 participants on the KT waitlist, the mean age was 53.7 (SD=13.5; range 18.3–85.7), 40.5% were female, 44.5% were African American, 6.4% were current smokers, and 67.7% were undergoing hemodialysis. The median number of comorbidities from the Charlson Comorbidity Index was 1 (IQR: 0–3; Range 0–28). There were 207 deaths over a mean follow-up of 1.6 years (SD=1.3 years). Additionally, 44% of the study population received KT during follow-up and 4% were removed from the waitlist (although they were still followed for mortality).
Among the 605 participants with measured inflammatory markers, the median IL-6 level was 4.1 pg/mL (IQR: 2.6–14.74), the median sTNFR1 level was 10.2 ng/mL (IQR: 6.1–17.8), the median CRP level was 4.4 μg/mL (IQR: 1.8–9.9), and the median inflammatory index score was 6.7 (IQR: 6.2–7.1). There were 27 deaths among those with inflammatory markers over a mean follow-up of 1.1 years (SD=0.7 years). Participants with measured inflammatory markers did not differ from those without measured inflammatory markers based on sex (P=0.12), age (P=0.73), race (P=0.80), diabetes status (P=0.61), or center (P=0.58); however, those with measured inflammatory markers were more likely to be smokers (42.2% vs. 18.4%; P<0.001).
Frailty Among Patients with ESRD on the KT Waitlist
Of the participants, 62.7% were intermediately frail, and 18.4% were frail (Table 1). Those who were frail were more likely to be aged 65 and older (frail=26.7%, intermediately frail=24.1%, and nonfrail=18.0%; P=0.001), African American (frail=53.7%, intermediately frail=44.1%, and nonfrail=38.9%; P<0.001), have a high school education or less (frail=37.7%, intermediately frail=31.3%, and nonfrail=22.3%; P<0.001), and have spent less time on dialysis (frail= 1.2 years, intermediately frail=2.2 years, and nonfrail=2.1 years; P<0.001). Additionally, those who were frail had different causes of ESRD (P<0.001); for example, diabetes (frail=32.2%, intermediately frail=22.0%, and nonfrail=11.0%; P<0.001) was the most common cause of ESRD among those who were frail.
Table 1.
Adults of All Ages with End-stage Renal Disease on the Kidney Transplant Waitlist, Stratified By Frailty Status (n=1,975).
| Nonfrail (n=373) | Intermediately frail (n=1,239) | Frail (n=363) | P-value | |
|---|---|---|---|---|
|
| ||||
| Age (years) | 0.001 | |||
| 18–34 | 10.7 | 12.0 | 7.7 | |
| 35–49 | 32.4 | 23.2 | 23.1 | |
| 50–64 | 38.9 | 40.7 | 42.4 | |
| ≥65 | 18.0 | 24.1 | 26.7 | |
| African American race | 38.9 | 44.0 | 53.7 | <0.001 |
| Hispanic ethnicity | 2.4 | 2.4 | 1.4 | 0.48 |
| Female sex | 39.4 | 41.4 | 38.6 | 0.56 |
| Cause of ESRD | <0.001 | |||
| Glomerular disease | 25.7 | 19.9 | 16.8 | |
| Diabetes | 11.0 | 22.0 | 32.2 | |
| Hypertension | 29.8 | 30.9 | 31.4 | |
| Polycystic disease | 11.0 | 6.9 | 5.5 | |
| Other | 22.5 | 20.3 | 14.1 | |
| Blood type | 0.26 | |||
| A | 29.2 | 31.9 | 35.5 | |
| AB | 3.5 | 4.5 | 3.3 | |
| B | 15.0 | 17.1 | 14.9 | |
| O | 51.3 | 46.4 | 46.0 | |
| Body mass index (kg/m2) | 29.0 [6.0] | 29.1 [5.9] | 29.5 [5.9] | 0.44 |
| Diabetes | 22.5 | 38.2 | 52.6 | <0.001 |
| Time on dialysis (years) | 2.1 [0.7–4.6] | 2.2 [0.8–5.4] | 1.2 [0.5–3.6] | <0.001 |
| Type of dialysis | 0.49 | |||
| Hemodialysis | 63.5 | 68.3 | 68.9 | |
| Peritoneal dialysis | 17.5 | 14.1 | 12.7 | |
| None (Pre-emptive transplant) | 19.1 | 17.6 | 18.4 | |
| High school education or less | 22.3 | 31.3 | 37.7 | <0.001 |
| Current smoker | 4.6 | 6.8 | 7.6 | 0.34 |
| Previous kidney transplant | 17.4 | 19.9 | 18.7 | 0.56 |
| Charlson comorbidities | 0 (0–2) | 1 (0–3) | 2 (0–3) | <0.001 |
| Myocardial infarction | 5.9 | 7.9 | 8.0 | 0.41 |
| Peripheral vascular disease | 3.5 | 6.2 | 7.4 | 0.06 |
| Cerebral vascular disease | 2.7 | 2.9 | 5.3 | 0.07 |
| Dementia | 0 | 0.2 | 1.1 | 0.02 |
| Chronic lung disease | 4.6 | 6.5 | 9.6 | 0.02 |
| Rheumatologic disease | 4.1 | 7.6 | 7.8 | 0.05 |
| Peptic ulcer disease | 1.9 | 4.1 | 5.0 | 0.07 |
| Diabetes | 26.0 | 41.9 | 52.5 | <0.001 |
| Diabetes with complications | 13.5 | 25.7 | 37.7 | <0.001 |
| Moderate/severe liver disease | 1.3 | 2.7 | 3.3 | 0.21 |
| Metastatic cancer | 1.3 | 0.5 | 0.6 | 0.19 |
| Leukemia | 0.5 | 0.2 | 0.3 | 0.45 |
| Lymphoma | 2.2 | 0.7 | 1.4 | 0.04 |
| HIV | 2.7 | 2.6 | 2.2 | 0.90 |
| Congestive heart failure | 5.3 | 11.6 | 11.5 | 0.07 |
|
| ||||
| Nonfrail (n=150) | Intermediately frail (n=364) | Frail (n=91) | P-value | |
|
| ||||
| IL-6 (pg/mL) | 3.4 [2.4–5.4] | 4.2 [2.6–7.4] | 5.6 [3.0–11.5] | <0.001 |
| sTNFR1 (ng/mL) | 8.4 [5.3–16.9] | 10.0 [6.1–17.8] | 12.5 [8.0–19.0] | 0.02 |
| CRP (μg/mL) | 3.6 [1.8–9.2] | 4.1 [1.7–9.9] | 6.7 [2.6–12.2] | 0.01 |
| Inflammatory index | 6.5 [6.0–7.0] | 6.7 [6.3–7.0] | 6.9 [6.5–7.2] | <0.001 |
Nonfrail was defined as a score of 0, intermediately frail was defined as a score of 1 or 2, and frail was defined as a score of 3 or higher. The mean [SD] are presented for body mass index. The median and IQR are presented for time on dialysis, IL-6, sTNFR1, CRP and inflammatory index. The aggregate inflammatory index consists of IL-6 and sTNFR1. All other measures are percentages. Interleukin-6=IL-6, soluble tumor necrosis factor-α receptor-1= sTNFR1, and C-reactive protein=CRP.
Frailty and Markers of Inflammation
Frail participants had a higher median serum IL-6 (frail=5.6 pg/mL, intermediately frail=4.2 pg/mL, and nonfrail=3.4 pg/mL; P<0.001), sTNFR1 (frail=12.5 ng/mL, intermediately frail=10.0 ng/mL, and nonfrail=8.4 ng/mL; P=0.02), CRP (frail=6.7 μg/mL, intermediately frail=4.1 μg/mL, and nonfrail=3.6 μg/mL; P=0.01), and inflammatory index (frail=6.9%, intermediately frail=6.7%, and nonfrail=6.5; P<0.001). In the adjusted models, a 1 SD change in the log IL-6 level was associated with a 1.23-fold (95% CI: 1.00–1.51) increased odds of intermediate frailty and a 1.91-fold (95% CI: 1.43–2.57) increased odds of frailty (Table 2) after accounting for age, race, sex, blood type, and cause of ESRD. A 1 SD change in sTNFR1 (OR=1.41, 95% CI: 1.05–1.89) and in CRP (OR=1.33, 95% CI: 1.00–1.77) were both associated with an increased odds of frailty. A 1 SD change in the inflammatory index score was associated with a 1.24-fold (95% CI: 1.01–1.51) increased odds of intermediate frailty and a 1.76-fold (95% CI: 1.30–2.37) increased odds of frailty.
Table 2.
Odds of Frailty and Intermediate Frailty by Inflammatory Markers.
| Intermediately frail | P-Value | Frail | P-Value | |
|---|---|---|---|---|
|
| ||||
| IL-6, Log(pg/mL) | 1.23 (1.00, 1.51) | 0.05 | 1.91 (1.43, 2.57) | <0.001 |
| sTNFR1, Log(pg/mL) | 1.18 (0.96, 1.45) | 0.12 | 1.41 (1.05, 1.89) | 0.02 |
| CRP, Log(μg/mL) | 1.08 (0.89, 1.31) | 0.45 | 1.33 (1.00, 1.77) | 0.05 |
| Inflammatory index | 1.24 (1.01, 1.51) | 0.04 | 1.76 (1.30, 2.37) | <0.001 |
Nonfrail was defined as a score of 0, intermediately frail was defined as a score of 1 or 2, and frail was defined as a score of 3 or higher. The odds of being intermediately frail and frail were estimated for a 1 standard deviation (SD) change in the log of IL-6, sTNFR1, CRP, and an aggregate inflammatory index of IL-6 and sTNFR1. Interleukin-6=IL-6, soluble tumor necrosis factor-α receptor-1= sTNFR1, and C-reactive protein=CRP.
Frailty, Markers of Inflammation, and Waitlist Mortality
The risk of waitlist mortality was greater among the frail participants (Figure 1; log-rank P=0.005). Frailty was associated with increased mortality risk (intermediately frail HR=1.73, 95%CI: 1.04–2.89; frail HR=2.19, 95%CI: 1.26–3.79) after adjustment for age, race, sex, blood type, and cause of ESRD (Table 3). A 1 SD change in the log IL-6 (HR=2.13, 95%CI: 1.41–3.22), sTNFR1 (HR=1.70, 95%CI: 1.12–2.59), CRP (HR=1.68, 95%CI: 1.06–2.67), and a 1 SD change in inflammatory index (HR=2.09, 95%CI: 1.38–3.16) were all associated with increased mortality risk after adjustment for age, race, sex, blood type, and cause of ESRD. The association between frailty (P for interaction=0.07), IL-6 (P for interaction=0.67), sTNFR1 (P for interaction=0.60), CRP (P for interaction=0.16), inflammatory index (P for interaction=0.58), and waitlist mortality did not differ by age. Similarly, there were no differences in these associations by sex or race except for one. CRP was a risk factor for waitlist mortality among white candidates (HR=2.76, 95% CI: 1.32–6.79) but not African American candidates (HR=1.08, 95% CI: 0.62–1.86) (P for interaction=0.04).
Figure 1.
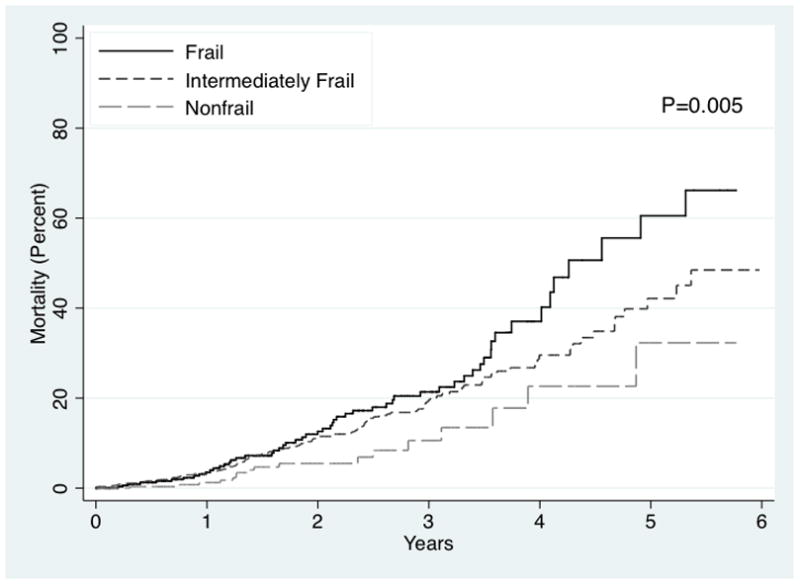
Risk of Waitlist Mortality by Frailty Among ESRD Patients.
The risk of waitlist mortality by frailty status was estimated using a Kaplan-Meier approach among 1,975 ESRD patients. Frailty was associated with an increased mortality risk (P=0.005) among ESRD patients.
Table 3.
Risk of Waitlist Mortality, by Frailty, Inflammatory Markers, and Inflammatory Index Among ESRD Patients on the Kidney Transplant Waitlist
| Sample Size | HR (95% CI) | P-value | C-statistic (P-value) | |
|---|---|---|---|---|
|
| ||||
| Registry-based Model | 605 | 0.655 | ||
|
| ||||
| Frailty | 1,975 | 0.646 (0.65) | ||
| Nonfrail | Reference | |||
| Intermediately frail | 1.73 (1.04–2.89) | 0.04 | ||
| Frail | 2.19 (1.26–3.79) | 0.01 | ||
| IL-6, Log(pg/mL) | 605 | 2.13 (1.41–3.22) | <0.001 | 0.777 (0.02) |
| sTNFR1, Log(pg/mL) | 605 | 1.70 (1.12–2.59) | 0.01 | 0.726 (0.10) |
| CRP, Log(μg/mL) | 605 | 1.68 (1.06–2.67) | 0.03 | 0.728 (0.02) |
| Inflammatory Index | 605 | 2.09 (1.38–3.16) | <0.001 | 0.777 (0.02) |
Nonfrail was defined as a score of 0, intermediately frail was defined as a score of 1 or 2, and frail was defined as a score of 3 or higher. The hazard ratios of mortality were estimated for a 1 standard deviation (SD) change in the log of IL-6, sTNFR1, CRP, and an aggregate inflammatory index of IL-6 and sTNFR1. The registry-based models (SRTR waitlist mortality model) include age, race, sex, blood type, and cause of ESRD. When the registry-based model was run on the full sample of 1,975, the C-statistic was 0.642 and this C-statistic is the reference for the p-value reported for the addition of frailty. However, when the sample was limited to the 605 participants who also had the inflammatory markers measured, the C-statistic for frailty was 0.655. Interleukin-6=IL-6, soluble tumor necrosis factor-α receptor-1= sTNFR1, and C-reactive protein=CRP.
In sensitivity analyses, additionally adjusting for current smoking did not change the inferences; in the additionally adjusted analyses: intermediately frail (HR=1.72, 95%CI: 1.03–2.88), frail (HR=2.18, 95%CI: 1.25–3.78), IL-6 (HR=2.08 95%CI: 1.38–3.14 P=0.001), sTNFR1 (HR=1.72 95%CI: 1.13–2.63 P=0.01), CRP (HR=1.72 95%CI: 1.07–2.77 P=0.03), and the inflammatory index (HR=2.07 95%CI: 1.37–3.12 P=0.001) remained associated with waitlist mortality. Furthermore, the results were robust to additionally adjusting for history of smoking, previous transplant, the Charlson comorbidity index, or vascular comorbidities and when using the competing risks model to account for the competing risk of transplantation.
Mortality Prediction by Frailty and Markers of Inflammation
When the registry-based model was run on the full sample of 1,975, the C-statistic was 0.642 and when run on the sample of 605 participants, the C-statistic was 0.655 (Table 3); as a sensitivity analyses, when frailty was treated as a score (0–5) the C-statistic was 0.647. Adding frailty to the registry-based model did not improve mortality risk prediction (C-statistic=0.646; P=0.65) (Table 3). However, adding IL-6 (C-statistic=0.777), CRP (C-statistic=0.728), or the inflammatory index (C-statistic=0.777) improved mortality risk prediction well beyond the registry-based model (P=0.02, P=0.02, and P=0.02, respectively).
DISCUSSION
In this multicenter prospective cohort study, we found that frailty is associated with heightened markers of inflammation among ESRD patients on the KT waitlist. While frailty and markers of inflammatory markers were associated with waitlist mortality, only IL-6, CRP, and the inflammatory index improved mortality prediction. In fact, a 1 SD change in the log of IL-6 and CRP as well as the inflammatory index were associated with an increased risk of waitlist mortality and improved the C-statistic; including IL-6 or the inflammatory index increased the C-statistic from 0.655 to 0.777. These findings represent statistically and clinically meaningful improvements in our ability to predict risk in ESRD patients on the KT waitlist.
Our findings of a strong association between frailty and markers of inflammation are consistent with studies of other populations. In community-dwelling older women, those with IL-6 in the top tertile had 3.98-fold increased odds of frailty (23). In patients with HIV (a condition associated with accelerated aging), the adjusted odds of frailty was 1.33-fold higher per every 1 SD change in the log between IL-6 (38). Additionally, in hemodialysis patients, a 1 pg/mL change in IL-6 was associated with a 0.3 point increase in frailty score (0–5). This suggests that there is a similar biological process that leads to frailty in older adults and patients of all ages with conditions associated with accelerated aging. ESRD is likely a state of accelerated aging (41) and manifests as elevated markers of inflammation and frailty even in a younger, healthier population.
Our findings on the robust, independent association between frailty and waitlist mortality are consistent with previous reports in ESRD patients (3, 5, 14, 37), including a 2.60-fold increased mortality risk in hemodialysis patients (3) and a 2.17-fold increased mortality risk among KT recipients (14). Additionally, we extended the previous findings on the risk of mortality associated with IL-6 and CRP among incident hemodialysis patients (42) to a broader, healthier population of ESRD on the KT waitlist. Our research builds on these previous findings of an association between frailty, markers of inflammation, and mortality and shows that incorporating markers of inflammation, particularly IL-6, improves mortality risk prediction among ESRD patients on the KT waitlist. However, only IL-6, CRP, and the inflammatory index improved waitlist mortality risk prediction. The predictive ability of frailty may be diminished because physicians are likely more able to identify frail patients (but don’t routinely screen for inflammation) resulting in fewer frail ESRD patients on the transplant waitlist.
This study has several important strengths, including a large sample size from 2 different hospitals, a prospective study design, the measurement of the novel gerontology factor of frailty (rather than the use of proxies), and the analysis of 3 inflammatory markers collected at the time of frailty assessment. The main limitation of this study was the limited number of centers, so inferences must be interpreted in the context of the study population. Additionally, to preserve stored samples, we only analyzed the most recent serum samples (from 4/2014); those with and without analyzed blood samples only differed on smoking status. We only obtained a single blood draw and thus, are unable to assess day to day variability in these inflammatory markers which may arise from hemodialysis, infections, or other acute conditions. Furthermore, we are unable to capture cause of death or medication/supplement use.
In conclusion, we have shown that frailty is a phenotype of increased inflammation among ESRD patients on the KT waitlist. There was substantial overlap in the inflammatory markers and frailty such that patients who were frail were much more likely to have elevated inflammatory markers. While both frailty and inflammatory markers were independently associated with waitlist mortality, only IL-6, CRP, and the inflammatory index improved risk prediction in this population; the improvement in risk prediction was substantial and clinically important. Furthermore, our findings provide early epidemiological evidence that the inflammatory pathway may be a novel and important target for reducing mortality among frail patients on the KT waitlist and suggest that a better understanding of this pathway may help clarify the accelerated aging process associated with ESRD. These findings highlight easy to measure markers of increased mortality risk and suggest that inflammatory markers should be measured along with frailty status during the evaluation process; knowing whether or not a patient is frail and whether or not they have elevated inflammatory markers may provide a more complete picture of their risk of mortality while awaiting KT.
Acknowledgments
Funding
This study was supported by NIH grant R01AG042504 (PI: Dorry Segev), R01AG055781 (PI: McAdams-DeMarco) and K24DK101828 (PI: Dorry Segev). Mara McAdams-DeMarco was also supported by the Johns Hopkins University Claude D. Pepper Older Americans Independence Center (P30AG021334), National Institute on Aging (K01AG043501). Christine Haugen was supported by the National Institute on Aging (F32AG053025). Ashton Shaffer was supported by the National Institute of Diabetes and Digestive and Kidney Diseases (F30DK116658).
We would like to thank the study participants for their contributions to this study.
ABBREVIATIONS
- ESRD
end-stage renal disease
- KT
kidney transplant(ation)
- IL-6
interleukin-6
- sTNFR1
soluble tumor necrosis factor-α receptor-1
- CRP
C-reactive protein [CRP])
Footnotes
Authorship
Mara A. McAdams-DeMarco: Research design, data analysis, writing of the paper and review of the paper
Hao Ying: Performance of the research, data analysis, writing of the paper and review of the paper
Alvin Thomas: Writing of the paper and review of the paper
Fatima Warsame: Performance of the research, writing of the paper and review of the paper
Ashton A. Shaffer: Writing of the paper and review of the paper
Christine E. Haugen: Performance of the research, writing of the paper and review of the paper
Jacqueline M. Garonzik-Wang: Performance of the research, writing of the paper and review of the paper
Niraj M. Desai: Performance of the research, writing of the paper and review of the paper
Ravi Varadhan: Performance of the research, writing of the paper and review of the paper
Jeremy D. Walston: Writing of the paper and review of the paper
Silas P. Norman: Performance of the research, writing of the paper and review of the paper
Dorry L. Segev: Research design, writing of the paper and review of the paper
Disclosure
The authors declare no conflicts of interest.
References
- 1.Fried LP, Xue QL, Cappola AR, et al. Nonlinear multisystem physiological dysregulation associated with frailty in older women: implications for etiology and treatment. J Gerontol A Biol Sci Med Sci. 2009;64(10):1049. doi: 10.1093/gerona/glp076. [DOI] [PMC free article] [PubMed] [Google Scholar]
- 2.McAdams-Demarco MA, Suresh S, Law A, et al. Frailty and falls among adult patients undergoing chronic hemodialysis: a prospective cohort study. BMC Nephrol. 2013;14(1):224. doi: 10.1186/1471-2369-14-224. [DOI] [PMC free article] [PubMed] [Google Scholar]
- 3.McAdams-DeMarco MA, Law A, Salter ML, et al. Frailty as a novel predictor of mortality and hospitalization in individuals of all ages undergoing hemodialysis. J Am Geriatr Soc. 2013;61(6):896. doi: 10.1111/jgs.12266. [DOI] [PMC free article] [PubMed] [Google Scholar]
- 4.Johansen KL, Dalrymple LS, Delgado C, et al. Factors Associated with Frailty and Its Trajectory among Patients on Hemodialysis. Clin J Am Soc Nephrol. 2017;12(7):1100–1108. doi: 10.2215/CJN.12131116. [DOI] [PMC free article] [PubMed] [Google Scholar]
- 5.Bao Y, Dalrymple L, Chertow GM, Kaysen GA, Johansen KL. Frailty, dialysis initiation, and mortality in end-stage renal disease. Arch Intern Med. 2012;172(14):1071. doi: 10.1001/archinternmed.2012.3020. [DOI] [PMC free article] [PubMed] [Google Scholar]
- 6.McAdams-DeMarco MA, Tan J, Salter ML, et al. Frailty and Cognitive Function in Incident Hemodialysis Patients. Clin J Am Soc Nephrol. 2015;10(12):2181. doi: 10.2215/CJN.01960215. [DOI] [PMC free article] [PubMed] [Google Scholar]
- 7.McAdams-DeMarco MA, Ying H, Olorundare I, et al. Frailty and Health-Related Quality of Life in End Stage Renal Disease Patients of All Ages. J Frailty Aging. 2016;5(3):174. [PMC free article] [PubMed] [Google Scholar]
- 8.Garonzik-Wang JM, Govindan P, Grinnan JW, et al. Frailty and delayed graft function in kidney transplant recipients. Arch Surg. 2012;147(2):190. doi: 10.1001/archsurg.2011.1229. [DOI] [PubMed] [Google Scholar]
- 9.McAdams-DeMarco MA, King EA, Luo X, et al. Frailty, Length of Stay, and Mortality in Kidney Transplant Recipients: A National Registry and Prospective Cohort Study. Ann Surg. 2016;266(6):1084–1090. doi: 10.1097/SLA.0000000000002025. [DOI] [PMC free article] [PubMed] [Google Scholar]
- 10.McAdams-DeMarco MA, Law A, Salter ML, et al. Frailty and early hospital readmission after kidney transplantation. Am J Transplant. 2013;13(8):2091. doi: 10.1111/ajt.12300. [DOI] [PMC free article] [PubMed] [Google Scholar]
- 11.McAdams-DeMarco MA, Law A, Tan J, et al. Frailty, mycophenolate reduction, and graft loss in kidney transplant recipients. Transplantation. 2015;99(4):805. doi: 10.1097/TP.0000000000000444. [DOI] [PMC free article] [PubMed] [Google Scholar]
- 12.McAdams-DeMarco MA, Olorundare IO, Ying H, et al. Frailty and Postkidney Transplant Health-Related Quality of Life. Transplantation. 2018;102(2):291–299. doi: 10.1097/TP.0000000000001943. [DOI] [PMC free article] [PubMed] [Google Scholar]
- 13.Nastasi AJ, McAdams-DeMarco MA, Schrack J, et al. Pre-Kidney Transplant Lower Extremity Impairment and Post-Kidney Transplant Mortality. Am J Transplant. 2018;18(1):189–196. doi: 10.1111/ajt.14430. [DOI] [PMC free article] [PubMed] [Google Scholar]
- 14.McAdams-DeMarco MA, Law A, King E, et al. Frailty and mortality in kidney transplant recipients. Am J Transplant. 2015;15(1):149. doi: 10.1111/ajt.12992. [DOI] [PMC free article] [PubMed] [Google Scholar]
- 15.Walston JD. Connecting Age-Related Biological Decline to Frailty and Late-Life Vulnerability. Nestle Nutr Inst Workshop Ser. 2015;83:1. doi: 10.1159/000382052. [DOI] [PMC free article] [PubMed] [Google Scholar]
- 16.Yao X, Li H, Leng SX. Inflammation and immune system alterations in frailty. Clin Geriatr Med. 2011;27(1):79. doi: 10.1016/j.cger.2010.08.002. [DOI] [PMC free article] [PubMed] [Google Scholar]
- 17.Collerton J, Martin-Ruiz C, Davies K, et al. Frailty and the role of inflammation, immunosenescence and cellular ageing in the very old: cross-sectional findings from the Newcastle 85+ Study. Mech Ageing Dev. 2012;133(6):456. doi: 10.1016/j.mad.2012.05.005. [DOI] [PubMed] [Google Scholar]
- 18.Barzilay JI, Blaum C, Moore T, et al. Insulin resistance and inflammation as precursors of frailty: the Cardiovascular Health Study. Arch Intern Med. 2007;167(7):635. doi: 10.1001/archinte.167.7.635. [DOI] [PubMed] [Google Scholar]
- 19.Leng S, Chaves P, Koenig K, Walston J. Serum interleukin-6 and hemoglobin as physiological correlates in the geriatric syndrome of frailty: a pilot study. J Am Geriatr Soc. 2002;50(7):1268. doi: 10.1046/j.1532-5415.2002.50315.x. [DOI] [PubMed] [Google Scholar]
- 20.Varadhan R, Yao W, Matteini A, et al. Simple biologically informed inflammatory index of two serum cytokines predicts 10 year all-cause mortality in older adults. J Gerontol A Biol Sci Med Sci. 2014;69(2):165. doi: 10.1093/gerona/glt023. [DOI] [PMC free article] [PubMed] [Google Scholar]
- 21.Chang SS, Weiss CO, Xue QL, Fried LP. Patterns of comorbid inflammatory diseases in frail older women: the Women’s Health and Aging Studies I and II. J Gerontol A Biol Sci Med Sci. 2010;65(4):407. doi: 10.1093/gerona/glp181. [DOI] [PMC free article] [PubMed] [Google Scholar]
- 22.Leng SX, Tian X, Matteini A, et al. IL-6-independent association of elevated serum neopterin levels with prevalent frailty in community-dwelling older adults. Age Ageing. 2011;40(4):475. doi: 10.1093/ageing/afr047. [DOI] [PMC free article] [PubMed] [Google Scholar]
- 23.Leng SX, Xue QL, Tian J, Walston JD, Fried LP. Inflammation and frailty in older women. J Am Geriatr Soc. 2007;55(6):864. doi: 10.1111/j.1532-5415.2007.01186.x. [DOI] [PubMed] [Google Scholar]
- 24.Singh T, Newman AB. Inflammatory markers in population studies of aging. Ageing Res Rev. 2011;10(3):319. doi: 10.1016/j.arr.2010.11.002. [DOI] [PMC free article] [PubMed] [Google Scholar]
- 25.Newman AB, Sachs MC, Arnold AM, et al. Total and cause-specific mortality in the cardiovascular health study. J Gerontol A Biol Sci Med Sci. 2009;64(12):1251. doi: 10.1093/gerona/glp127. [DOI] [PMC free article] [PubMed] [Google Scholar]
- 26.Roubenoff R, Parise H, Payette HA, et al. Cytokines, insulin-like growth factor 1, sarcopenia, and mortality in very old community-dwelling men and women: the Framingham Heart Study. Am J Med. 2003;115(6):429. doi: 10.1016/j.amjmed.2003.05.001. [DOI] [PubMed] [Google Scholar]
- 27.Fried LP, Tangen CM, Walston J, et al. Frailty in older adults: evidence for a phenotype. J Gerontol A Biol Sci Med Sci. 2001;56(3):M146. doi: 10.1093/gerona/56.3.m146. [DOI] [PubMed] [Google Scholar]
- 28.Bandeen-Roche K, Xue QL, Ferrucci L, et al. Phenotype of frailty: characterization in the women’s health and aging studies. J Gerontol A Biol Sci Med Sci. 2006;61(3):262. doi: 10.1093/gerona/61.3.262. [DOI] [PubMed] [Google Scholar]
- 29.Cappola AR, Xue QL, Fried LP. Multiple hormonal deficiencies in anabolic hormones are found in frail older women: the Women’s Health and Aging studies. J Gerontol A Biol Sci Med Sci. 2009;64(2):243. doi: 10.1093/gerona/gln026. [DOI] [PMC free article] [PubMed] [Google Scholar]
- 30.Leng SX, Hung W, Cappola AR, Yu Q, Xue QL, Fried LP. White blood cell counts, insulin-like growth factor-1 levels, and frailty in community-dwelling older women. J Gerontol A Biol Sci Med Sci. 2009;64(4):499. doi: 10.1093/gerona/gln047. [DOI] [PMC free article] [PubMed] [Google Scholar]
- 31.Newman AB, Gottdiener JS, McBurnie MA, et al. Associations of subclinical cardiovascular disease with frailty. J Gerontol A Biol Sci Med Sci. 2001;56(3):M158. doi: 10.1093/gerona/56.3.m158. [DOI] [PubMed] [Google Scholar]
- 32.Walston J, McBurnie MA, Newman A, et al. Frailty and activation of the inflammation and coagulation systems with and without clinical comorbidities: results from the Cardiovascular Health Study. Arch Intern Med. 2002;162(20):2333. doi: 10.1001/archinte.162.20.2333. [DOI] [PubMed] [Google Scholar]
- 33.Xue QL, Bandeen-Roche K, Varadhan R, Zhou J, Fried LP. Initial manifestations of frailty criteria and the development of frailty phenotype in the Women’s Health and Aging Study II. J Gerontol A Biol Sci Med Sci. 2008;63(9):984. doi: 10.1093/gerona/63.9.984. [DOI] [PubMed] [Google Scholar]
- 34.Chang SS, Weiss CO, Xue QL, Fried LP. Association between inflammatory-related disease burden and frailty: results from the Women’s Health and Aging Studies (WHAS) I and II. Arch Gerontol Geriatr. 2012;54(1):9. doi: 10.1016/j.archger.2011.05.020. [DOI] [PMC free article] [PubMed] [Google Scholar]
- 35.Bandeen-Roche K, Seplaki CL, Huang J, et al. Frailty in Older Adults: A Nationally Representative Profile in the United States. J Gerontol A Biol Sci Med Sci. 2015;70(11):1427. doi: 10.1093/gerona/glv133. [DOI] [PMC free article] [PubMed] [Google Scholar]
- 36.McAdams-DeMarco MA, Isaacs K, Darko L, et al. Changes in Frailty After Kidney Transplantation. J Am Geriatr Soc. 2015;63(10):2152. doi: 10.1111/jgs.13657. [DOI] [PMC free article] [PubMed] [Google Scholar]
- 37.McAdams-DeMarco MA, Ying H, Olorundare I, et al. Individual Frailty Components and Mortality In Kidney Transplant Recipients. Transplantation. 2017;101(9):2126–2132. doi: 10.1097/TP.0000000000001546. [DOI] [PMC free article] [PubMed] [Google Scholar]
- 38.Piggott DA, Varadhan R, Mehta SH, et al. Frailty, Inflammation, and Mortality Among Persons Aging With HIV Infection and Injection Drug Use. J Gerontol A Biol Sci Med Sci. 2015;70(12):1542. doi: 10.1093/gerona/glv107. [DOI] [PMC free article] [PubMed] [Google Scholar]
- 39.Risk Model Documentation: Kidney Waitlist Mortality Rates., vol 2017: Scientific Registry of Transplant Recipients, 2016.
- 40.Fine JP, Gray RJ. A proportional hazards model for the subdistribution of a competing risk. J Am Stat Assoc. 1999;94(446):496. [Google Scholar]
- 41.Kooman JP, Broers NJ, Usvyat L, et al. Out of control: accelerated aging in uremia. Nephrol Dial Transplant. 2013;28(1):48. doi: 10.1093/ndt/gfs451. [DOI] [PubMed] [Google Scholar]
- 42.Banerjee T, Kim SJ, Astor B, Shafi T, Coresh J, Powe NR. Vascular access type, inflammatory markers, and mortality in incident hemodialysis patients: the Choices for Healthy Outcomes in Caring for End-Stage Renal Disease (CHOICE) Study. Am J Kidney Dis. 2014;64(6):954. doi: 10.1053/j.ajkd.2014.07.010. [DOI] [PMC free article] [PubMed] [Google Scholar]