Abstract
Aims
To investigate trajectories of daily insulin dose requirements and glycaemic control in children, adolescents and young adults with Type 1 diabetes and to identify factors associated with changing insulin needs and deterioration in HbA1c.
Methods
The sample was a dynamic cohort of 635 children, adolescents and young adults with Type 1 diabetes from one centre. Data from clinic visits occurring over 20 years (1993–2013) were extracted from medical records. From age 7–24 years, we evaluated HbA1c and insulin dose according to sex, insulin regimen and weight status.
Results
Participants provided a mean ± SD of 10.7±4.3 years of insulin dose data and 12.0±4.6 years of HbA1c data. At first observation, the mean ± SD age was 10.0±2.6 years, diabetes duration was 2.8±2.1 years, insulin dose was 0.8±0.2 units/kg and HbA1c was 74±18 mmol/mol (8.9±1.6%). Insulin dose was higher in girls at ages 8–13 years (P<0.0001 to P<0.01), but higher in boys/young men at ages 16–21 years (P<0.0001 to P=0.04). HbA1c was higher in girls/young women at ages 16–24 years (P<0.0001 to P=0.01). Compared with injection therapy, pump therapy was associated with lower insulin dose at ages 8–24 years (P<0.0001 to P=0.03) and lower HbA1c at ages 8–22 years (P<0.0001 to P=0.005). HbA1c did not differ between overweight/obese and normal weight individuals, but overweight/obese individuals had higher insulin dose at ages 8–13 years (P<0.0001 to P=0.03).
Conclusions
This longitudinal assessment identifies clinically meaningful modifiable (e.g. insulin regimen) and non-modifiable (e.g. sex) factors predictive of insulin requirements and HbA1c levels in young people with Type 1 diabetes; anticipatory insulin adjustments may improve glycaemic control.
Introduction
Childhood, adolescence and young adulthood are developmental stages that affect insulin requirements and glycaemic control in people with Type 1 diabetes [1]. Optimizing glycaemic control substantially reduces the risk of microvascular and macrovascular complications [2,3]; however, achieving the recommended American Diabetes Association target levels of HbA1c <58 mmol/mol (<7.5%) for individuals aged <18 years and <53 mmol/mol (<7%) for young adults remains a challenge [4,5]. In studies involving children and adolescents with Type 1 diabetes, poor glycaemic control has been associated with older age, black race and longer diabetes duration [6,7]; however, many studies analysing predictors of deterioration in glycaemic control during childhood and adolescence have been limited by short duration of follow-up [8,9], small sample size [10,11] and limited numbers of factors evaluated [10,12].
Although previous studies have described the impact of puberty on insulin resistance and insulin sensitivity in children and adolescents with Type 1 diabetes [13,14], the natural course of insulin requirements during childhood, adolescence and young adulthood, as well as factors associated with insulin dose requirements, is not entirely understood. It is recognized that obesity impairs insulin action [15]. Other reports have shown that girls have higher insulin requirements than boys during adolescence as a result of lower insulin sensitivity in girls, which is probably related to increasing adiposity and decreasing physical activity during puberty [16]. Additionally, insulin pump therapy has been associated with lower insulin requirements [16–18]; however, the impact of weight, sex and regimen on insulin requirements, as well as trajectories of insulin dose and HbA1c according to age requires further study.
In an effort to identify factors associated with insulin dose requirements and deterioration of glycaemic control commonly observed during childhood, adolescence and young adulthood [4], we sought to investigate trajectories of daily insulin dose and glycaemic control in young people with Type 1 diabetes according to age. We also sought to identify the demographic and clinical characteristics associated with trajectories of insulin dose and glycaemic control. Understanding the impact of these characteristics on insulin requirements and HbA1c levels may inform approaches to improving glycaemic control during childhood, adolescence and young adulthood.
Participants and methods
Participants
We compiled a dynamic cohort of children, adolescents and young adults with Type 1 diabetes identified by their enrolment in five short-term non-drug studies at a single paediatric diabetes centre [19–22]. These investigations provided an opportunity for rigorous data collection and careful ascertainment of clinical/demographic characteristics. Participants included in this analysis met the following inclusion criteria: diabetes duration ≥1 year and daily insulin dose ≥0.5 units/kg at first included observation; follow-up for ≥1 year; and ≥2 observations with insulin dose and HbA1c data. The institutional review board approved retrospective and prospective data collection for the present study. All the young people/their parents signed informed assent/consent, respectively, at the time of the short-term investigations.
Data collection and measures
Trained research staff reviewed paper and electronic medical records and extracted demographic/clinical data from participants’ clinic visits that occurred during a 20-year period (January 1993 to December 2013). Glycaemic control was assessed by HbA1c, which was performed in a clinical laboratory using an assay standardized to the Diabetes Control and Complications Trial (DCCT; reference range 4.0–6.0%). Insulin regimen was classified as use of multiple daily injections or insulin pump. Daily insulin dose was captured by clinician report for those using injection therapy and, for pump users, by pump downloads when available or clinician report when pump downloads were not available. After data extraction, we converted total daily insulin dose values to units/kg/day.
For individuals aged <20 years, we calculated age- and sex-adjusted BMI percentiles using normative data from the US Centers for Disease Control and Prevention [23]. For individuals aged ≥20 years, we calculated BMI (kg/m2). Categories of weight status were defined as: underweight (age <20 years: BMI <5th percentile; age ≥20 years: BMI <18.5 kg/m2); normal weight (age <20 years: BMI 5th to <85th percentile; age ≥20 years: BMI 18.5 to <25 kg/m2); overweight (age <20: BMI 85th to <95th percentile; age ≥20 years: BMI 25 to <30 kg/m2); and obese (age <20 years: BMI ≥95th percentile; age ≥20 years: BMI ≥30 kg/m2). Because only 1% of individuals were underweight at first observation, we included underweight individuals in the normal weight category for the analyses. To account for differences in developmental stages, we assessed participants in three age categories: 7–13 years (representing pre-puberty to early puberty); 14–18 years (representing mid puberty to late puberty); and 19–24 years (representing post-puberty) [24]. The number of participants in each age group provided sufficient data for analyses.
Data analysis
Analyses were performed using SAS (version 9.4, SAS Institute, Inc., Cary, NC, USA). Descriptive data are presented as means ± SD for continuous variables and percentages for categorical variables. Statistical analyses included unpaired t-tests for continuous variables and chi-squared tests for categorical variables. Because of the sparse availability of data for participants aged <7 years and >24 years, we only included participant data for those aged 7–24 years in the analyses. For each age between 7 and 24 years, we calculated annualized daily insulin dose (units/kg) and HbA1c values by averaging all insulin dose and HbA1c values within ±6 months of the participant’s birthday. For annualized insulin regimen and weight status values, we used the insulin regimen and weight status closest to the participant’s birthday for each age between 7 and 24 years.
Bivariate analyses included the impact of sex, insulin regimen and weight status (normal weight vs overweight/obese) on annual mean daily insulin dose and HbA1c according to age. Because we aimed to investigate age trajectories of insulin dose and HbA1c, we have only described in the results significant differences in which there was also a significant difference at 1 year younger or 1 year older; however, we included data for all comparisons in the figures. In addition, we evaluated annual mean insulin dose and HbA1c as dependent variables in multivariable analyses. Longitudinal mixed modelling assessed the impact of different predictors of insulin dose and HbA1c according to age, using unstructured covariance matrices for repeated measure variables. In each of the models predicting insulin dose and HbA1c over time according to age, covariates included sex, age at diabetes diagnosis, insulin regimen, weight status and calendar year. The variable of calendar year was included to control for historical changes in diabetes treatment and glycaemic control, given the changing availability of insulin analogues and technologies over time. In the model predicting insulin dose, we stratified HbA1c into two groups [<75 mmol/mol (<9%) and ≥75 mmol/mol (≥9%)] according to the overall mean HbA1c per person. In the model predicting HbA1c, we stratified daily insulin dose into two groups (<1 units/kg and ≥1 units/kg) based on the overall mean insulin dose per person. An α level of <0.05 was used to determine statistical significance.
Results
Cohort characteristics
The study sample was a dynamic cohort of 635 children, adolescents and young adults with Type 1 diabetes identified at a single diabetes centre and followed over time. Table 1 shows participant characteristics for initial and final insulin dose and/or HbA1c observation. At first observation, the mean age was 10.0±2.6 years and mean duration of Type 1 diabetes was 2.8±2.1 years. All were diagnosed in childhood at a mean age of 7.2±3.5 years. Approximately half of the cohort (54%) was female and the majority of participants (91%) were white. Insulin pump use increased from 4% at first observation to 36% at last observation.
Table 1.
Demographic and clinical characteristics of study participants
| First observation (N=635) | Last observation (N=635) | |
|---|---|---|
|
| ||
| Age, years | 10.0±2.6 (6.5–19.1) | 20.8±3.2 (8.7–24.5) |
|
| ||
| Sex, % female | 54 | - |
|
| ||
| Race/ethnicity, % white | 91 | - |
|
| ||
| Age at Type 1 diagnosis, years | 7.2±3.5 | - |
|
| ||
| Diabetes duration, years | 2.8±2.1 (1.0–12.6) | 13.6±4.3 (2.2–22.9) |
|
| ||
| HbA1c, mmol/mol | 74±18 (37–201) | 75±19 (40–149) |
|
| ||
| HbA1c, % | 8.9±1.6 (5.5–20.6) | 9.0±1.7 (5.8–15.8) |
|
| ||
| Daily insulin dose, units/kg | 0.8±0.2 (0.5–1.7) | 0.9±0.3 (0.4–2.0) |
|
| ||
| Regimen, % pump use | 4 | 36 |
|
| ||
| Weight status, % | ||
| Normal weight* | 69 | 51 |
| Overweight | 22 | 34 |
| Obese | 9 | 15 |
|
| ||
| Calendar year, years range | 1993–2008 | 1997–2013 |
Data are mean ± SD (range), unless otherwise indicated.
The mean (median; interquartile range) time from first to last insulin dose observation was 10.7±4.3 (10.6; 7.5–13.7) years, with a mean of 4.4±3.7 months between observations. The mean number of insulin dose observations per person was 30.0±13.7 and the mean number of annualized insulin dose observations per person was 11.2±4.1. At first observation, the mean daily insulin dose was 0.8±0.2 units/kg. At last observation, the mean daily insulin dose was 0.9±0.3 units/kg.
The mean (median; interquartile range) time from first to last HbA1c observation was 12.0±4.6 (12.1; 8.3–15.4) years, with a mean of 4.2±4.5 months between observations. The mean number of HbA1c observations per person was 34.9±15.4 and the mean number of annualized HbA1c observations per person was 12.2±4.5. At first observation, the mean HbA1c was 74±18 mmol/mol (8.9±1.6%). At last observation, the mean HbA1c was 75±19 mmol/mol (9.0±1.7%).
Insulin dose trajectories
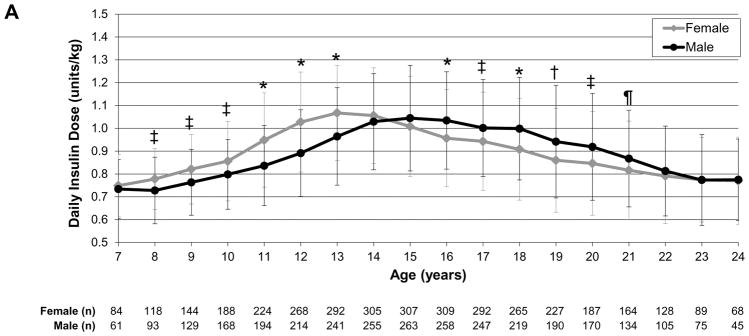
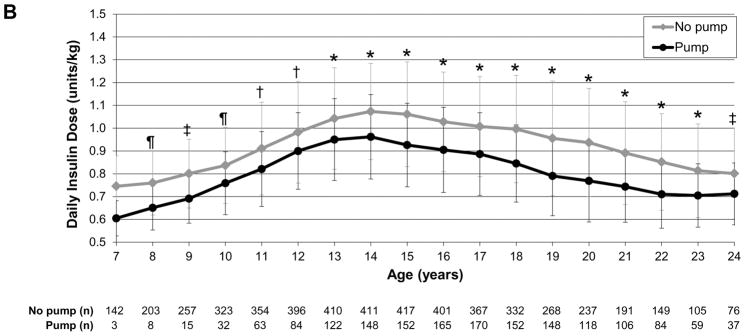
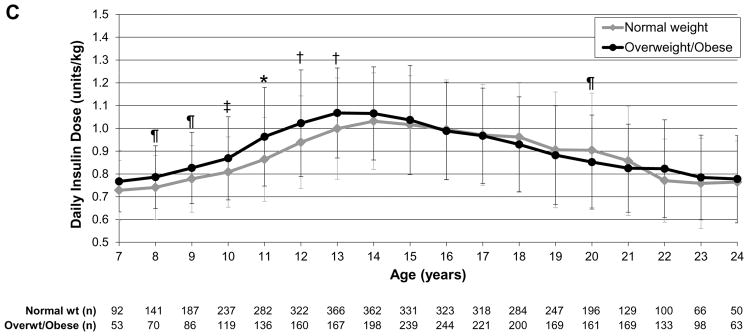
To evaluate insulin dose trajectories over time as participants aged, we assessed daily insulin dose as units/kg by sex (female vs male), insulin regimen (pump vs injection therapy), and weight status (normal weight vs overweight/obese). In the analysis by sex, girls had significantly higher insulin dose than boys at ages 8–13 years (P<0.0001 to P<0.01) whereas boys/young men had significantly higher insulin dose than girls/young women at ages 16–21 years (P<0.0001 to P=0.04; Fig.1a). In the analysis by regimen, those receiving pump therapy had a significantly lower insulin dose than those receiving multiple daily injection therapy throughout childhood, adolescence and young adulthood (P<0.0001 to P=0.03), except at age 7 years (Fig. 1b). In the analysis by weight status, overweight/obese individuals had significantly higher insulin dose than normal weight individuals at ages 8–13 years (P<0.0001 to P=0.03; Fig. 1c).
FIGURE 1.
Daily insulin dose trajectories by (a) sex, (b) regimen and (c) weight status. *P<0.0001, †P<0.001, ‡P<0.01, ¶P<0.05. Error bars represent standard deviation. (a) Girls had significantly higher insulin dose than boys during ages 8–13 years (P<0.0001 to P<0.01); boys/young men had significantly higher insulin dose than girls/young women during ages 16–21 years (P<0.0001 to P=0.04). (b) Those receiving insulin pump therapy had significantly lower insulin dose than those receiving multiple daily injection therapy during ages 8–24 years (P<0.0001 to P=0.03). (c) Overweight/obese individuals had significantly higher insulin dose than normal weight individuals during ages 8–13 years (P<0.0001 to P=0.03).
Glycaemic control trajectories
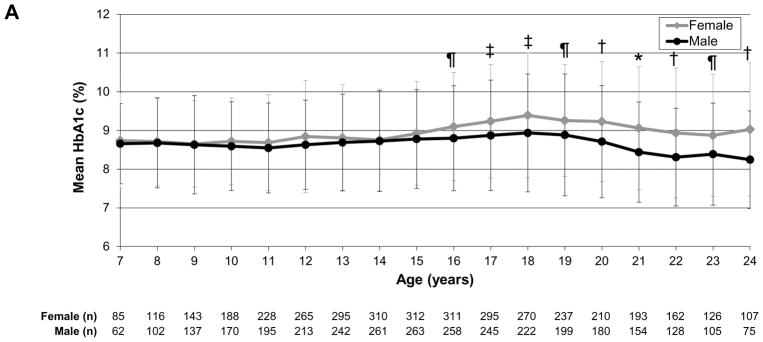
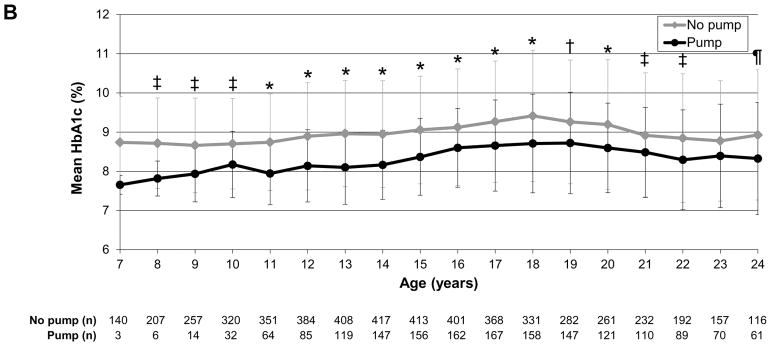
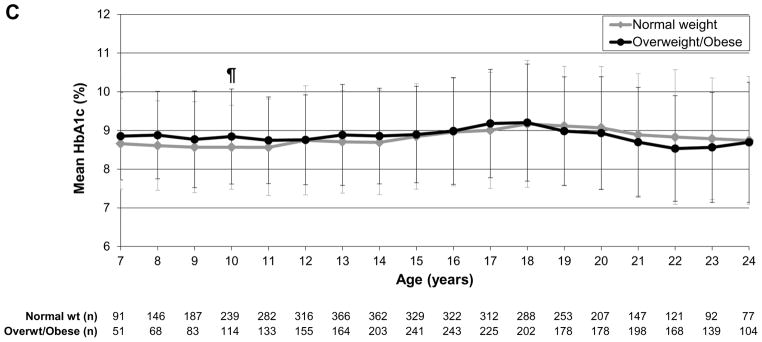
To evaluate glycaemic trajectories over time as individuals aged, we assessed HbA1c by sex, insulin regimen and weight status, as above. In the analysis by sex, girls/young women had significantly higher HbA1c levels than boys/young men at ages 16–24 years (P<0.0001 to P=0.01; Fig. 2a). In the analysis by regimen, those receiving pump therapy compared with multiple daily injections had significantly lower HbA1c values throughout most of childhood, adolescence and young adulthood [ages 8–22 years; P<0.0001 to P=0.005 (Fig. 2b)]. In the analysis by weight status, there were no significant differences between normal weight and overweight/obese individuals over time (Fig. 2c).
FIGURE 2.
HbA1c trajectories by (a) sex, (b) regimen and (c) weight status. *P<0.0001, †P<0.001, ‡P<0.01, ¶P<0.05. Error bars represent standard deviation. (a) Girls/young women had significantly higher HbA1c levels than boys/young men during ages 16–24 years (P<0.0001 to P=0.01). (b) Those receiving pump therapy had significantly lower HbA1c values than those receiving multiple daily injections during ages 8–22 years (P<0.0001 to P=0.005). (c) There were no differences in HbA1c over time by age between overweight/obese and normal weight individuals.
Multivariable analyses
Given that the shapes of the insulin dose trajectories were not linear in the bivariate analyses, with trajectories resembling quadratic-cubic patterns, we performed separate longitudinal multivariable analyses in three age groups: 7–13, 14–18 and 19–24 years (Table 2). Generalized mixed models predicting daily insulin dose confirmed differences in the impact of sex on insulin dose according to age, with girls having significantly higher insulin doses than boys at ages 7–13 years, while young men had higher insulin doses than young women at ages 19–24 years. Similar to the bivariate analyses for insulin regimen, pump therapy predicted lower insulin doses in the longitudinal models for all three age groups. Overweight/obesity was only predictive of higher insulin dose in those aged 7–13 years. Attained age, age at diabetes diagnosis, and calendar year (used as a marker for the change in diabetes treatment over the observation period) had variable effects on insulin dose across the three age groups. As age increased, insulin dose increased in participants aged 7–13 years and decreased in those aged 14–18 and 19–24 years. Older age at diagnosis was associated with lower insulin dose in the two younger age groups. Calendar year was predictive of insulin dose in the two older age groups, with later calendar year being associated with higher insulin dose. Finally, daily insulin dose was lower for individuals with HbA1c values <75 mmol/mol (<9%) in the two older age groups.
Table 2.
Longitudinal multivariable models predicting annual daily insulin dose and annual HbA1c*
| Annual daily insulin dose (units/kg): effect estimates stratified by age | Annual HbA1c (%): effect estimates stratified by age | |||||||||||
|---|---|---|---|---|---|---|---|---|---|---|---|---|
| 7–13 years | P | 14–18 years | P | 19–24 years | P | 7–13 years | P | 14–18 years | P | 19–24 years | P | |
| Age (per 1 year increase) | 0.061 | <0.0001 | −0.023 | <0.0001 | −0.029 | <0.0001 | 0.079 | <0.0001 | 0.144 | <0.0001 | −0.060 | 0.01 |
| Sex (female vs male) | 0.067 | <0.0001 | −0.027 | .06 | −0.054 | 0.003 | 0.127 | 0.15 | 0.196 | 0.04 | 0.521 | <0.0001 |
| Age at diagnosis (per 1 year increase) | −0.013 | <0.0001 | −0.006 | .008 | 0.001 | 0.79 | −0.052 | 0.0006 | −0.035 | 0.01 | −0.023 | 0.19 |
| HbA1c (<9% vs ≥9%) | −0.010 | 0.46 | −0.051 | .0005 | −0.103 | <0.0001 | – | – | – | – | – | – |
| Daily insulin dose (<1 units/kg vs ≥1 units/kg) | – | – | – | – | – | – | −0.527 | <0.0001 | −0.813 | <0.0001 | −0.639 | <0.0001 |
| Regimen (pump vs multiple daily injections) | −0.060 | <0.0001 | −0.123 | <0.0001 | −0.119 | <0.0001 | −0.280 | .0002 | −0.438 | <0.0001 | −0.385 | <0.0001 |
| Weight status (overweight/obese vs normal weight) | 0.027 | 0.0001 | 0.009 | .29 | 0.010 | 0.32 | −0.045 | 0.37 | −0.239 | <0.0001 | −0.140 | 0.03 |
| Calendar year (per year increase) | −0.000 | 0.90 | 0.005 | .006 | 0.005 | 0.03 | −0.089 | <0.0001 | −0.009 | 0.45 | 0.013 | 0.47 |
Values for annual change in HbA1c are presented in DCCT % units. To convert to mmol/mol, please refer to www.ngsp.org.
Given the variable HbA1c trajectories according to sex, insulin regimen and weight status across the age span of 7–24 years, we performed separate longitudinal multivariable analyses in the same three age groups as above (Table 2). Generalized linear mixed models indicated that female sex predicted significantly higher HbA1c in those aged 14–18 and 19–24 years. Pump therapy predicted significantly lower HbA1c in all three age groups. Surprisingly, overweight/obesity predicted lower HbA1c in those aged 14–18 and 19–24 years. Attained age predicted HbA1c in all age groups; older age was associated with higher HbA1c in the two younger age groups and lower HbA1c in the oldest age group. Older age at diagnosis was associated with lower HbA1c in the two younger age groups. Calendar year was predictive of HbA1c in the youngest age group, with later calendar year being associated with lower HbA1c. Notably, daily insulin dose <1 unit/kg was significantly predictive of lower HbA1c in all three age groups.
Discussion
Suboptimal glycaemic control is a common problem in young people with Type 1 diabetes [13]. In the present study we identified several factors associated with insulin requirements and deterioration in glycaemic control in children, adolescents and young adults with Type 1 diabetes. In this long-term dynamic cohort, age trajectories of insulin dose differed according to sex, insulin regimen and weight status, while age trajectories of HbA1c differed according to sex and insulin regimen. Insulin doses were higher during the pubertal years, as expected. HbA1c levels were higher in girls/young women in late adolescence and young adulthood and lower in insulin pump users over time, while overweight/obesity did not seem to negatively affect HbA1c levels across ages. As age at diagnosis increased during childhood and adolescence, insulin dose requirement decreased as might be expected, given more aggressive β-cell destruction at younger ages of onset [25]. Insulin pump users and individuals of normal weight also required lower doses of insulin.
Adolescence is a period of cognitive, psychosocial and physical maturation. With the onset of puberty, glycaemic control usually deteriorates despite concomitant increases in insulin doses [13,26]. Reaching adulthood is then associated with decreases in insulin requirement and, hopefully, improved glycaemic control, although recent data from the T1D Exchange Clinic Registry indicate that glycaemic control does not appear to improve until the latter half of the third decade of life [4]. Adolescents in the T1D Exchange Clinic Registry had a mean HbA1c of 9.0% compared with 9.5% in the same age group during the DCCT [2]. Similar to this finding, in the present study, calendar year did not have an impact on glycaemic control during adolescence, and suboptimal glycaemic control persisted over time, indicating that recent diabetes treatment advances have not been fully successful in overcoming the unique challenges of managing Type 1 diabetes during adolescence.
The rising insulin requirement during early adolescence corresponds to the physiological insulin resistance observed during puberty [13]. Considering that puberty happens earlier in girls than boys [24], it is reasonable to expect insulin requirements to increase in girls at a younger age [16]. Indeed, in the present study, girls had higher insulin doses than boys at ages 8–13 years. Notably, glycaemic control did not differ by sex in childhood but deteriorated in girls/young women in comparison to boys/young men in adolescence and young adulthood. The observation that glycaemic control deteriorates in the latter part of adolescence and during young adulthood suggests that puberty-associated insulin resistance is probably well managed with increased insulin dosing. Other factors, such as adherence and psychosocial issues, probably contribute to the deterioration in glycaemic control that follows the period of pubertal growth and development, when family involvement in diabetes management is waning [27]. Also, parental involvement is likely to decline as teens get older, at a time when teens may not be fully prepared for successful independent self-management as a result of many competing social, emotional and academic demands, coupled with ongoing maturation of their cognitive function [28].
Many studies assessing the impact of pump therapy on glycaemic control in children with Type 1 diabetes have reported some improvement in glycaemic control, especially in the period immediately after pump initiation [17,18]. Considering this potential benefit, pump therapy may be considered a modifiable factor that could positively impact glycaemic control, particularly during adolescence when insulin needs increase because of puberty-related insulin resistance [13]. In the present study, pump therapy was associated with better glycaemic control and lower insulin doses across all ages. Although pump use considerably increased from first to last observation, glycaemic control did not improve over time. Insulin pump therapy may have helped prevent the expected deterioration in glycaemic control among adolescents in this study; however, our findings may also represent better adherence associated with individuals selected for pump therapy. The lack of information regarding adherence, as well as demographics such as socio-economic status, limits interpretation of possible insulin pump benefit among adolescents. The differences in insulin dose between pump and injection therapy were maintained throughout childhood, adolescence and young adulthood. This might be explained by the observation that pump therapy may deliver fasting and prandial insulin doses in a more physiological manner than injection-based therapy [16]. Recent data indicate that about one-third of children and adolescents with Type 1 diabetes are overweight or obese, similar to the general paediatric population [29,30]. In the present study, from first to last observation, overweight/obesity increased from 31% to 49%. It is well known that obesity increases insulin resistance, and our findings highlight the observation that young people who are overweight or obese require higher insulin doses, especially during adolescence when insulin resistance is already present as a result of pubertal needs; however, the association of BMI, HbA1c, insulin dose and insulin resistance is complex and incompletely understood. In contrast to some literature, in which higher BMI has been associated with higher HbA1c levels [30], there was no clear difference in HbA1c between normal weight and overweight/obese individuals in the present study; however, the lack of information regarding demographics, physical activity, adherence and psychosocial issues limits the interpretation of this result.
It is important that we do not overstate our findings. First, this study was based on longitudinal follow-up data, mainly collected retrospectively, from a single centre, with many measurements obtained as part of routine clinical care rather than as part of a research study. Lack of information regarding demographics, adherence and clinical characteristics limits the interpretation of HbA1c trajectories over time according to modifiable factors such as weight and insulin pump, especially when considering pump therapy to have a positive impact on glycaemic control. Also, insulin dose was captured mostly electronically for pump users and by clinician report for individuals using injection therapy. In individuals using injection therapy, insulin dose adjustments are based on reported insulin doses, which may differ from actual administered insulin doses [16]. Finally, interpretation of weight status was limited by the lack of information regarding diet and exercise.
Glycaemic outcomes in young people with Type 1 diabetes are suboptimal, with fewer than one in five children and adolescents achieving target HbA1c levels [4]. This report identifies clinically meaningful and actionable factors for which to adjust insulin doses in an anticipatory manner to improve glycaemic control in young people with Type 1 diabetes. To our knowledge, this is one of the largest cohort studies of young people with Type 1 diabetes providing extensive longitudinal data regarding trajectories of insulin dosing and glycaemic control across childhood, adolescence and young adulthood. Female sex, late adolescence and young adulthood, and injection therapy seemed to have a negative impact on glycaemic control. Further studies are needed to confirm these findings and investigate the impact of demographic and clinical characteristics, such as adherence, on insulin dose requirements and glycaemic control in children, adolescents and young adults with Type 1 diabetes.
What’s new?
In a 20-year observational study (N=635), we assessed the impact of sex, insulin regimen and weight status on insulin requirements and HbA1c levels in people with Type 1 diabetes from childhood to young adulthood.
Age trajectories of insulin dose differed by sex, insulin regimen and weight status. Age trajectories of HbA1c differed by sex and insulin regimen.
Fewer than one in five children and adolescents with Type 1 diabetes achieve target HbA1c levels. This report identifies clinically meaningful and actionable factors upon which to adjust insulin doses in an anticipatory manner to improve glycaemic control in young people with Type 1 diabetes.
Acknowledgments
Funding sources
This research was supported by grants from the National Institutes of Health under award numbers R01DK046887, K23HL125976, P30DK036836, K12DK094721, and T32DK007260, CAPES/CNPq funding (0596-13-2), the Charles H. Hood Foundation, the Katherine Adler Astrove Youth Education Fund, the Maria Griffin Drury Pediatric Fund, and the Eleanor Chesterman Beatson Fund. The content is solely the responsibility of the authors and does not necessarily represent the official views of these organizations. None of these organizations had any role in the design and conduct of the study; collection, management, analysis, or interpretation of the data; preparation, review, or approval of the manuscript; or decision to submit the manuscript for publication.
Footnotes
Competing interests
None declared.
Previous Publication
Portions of this manuscript were presented at the 74th Scientific Sessions of the American Diabetes Association (2014) and the Endocrine Society’s 96th Annual Meeting and Expo (2014).
References
- 1.Petitti DB, Klingensmith GJ, Bell RA, Andrews JS, Dabelea D, Imperatore G, et al. Glycemic control in youth with diabetes: the SEARCH for Diabetes in Youth Study. J Pediatr. 2009;155:668–672. doi: 10.1016/j.jpeds.2009.05.025. [DOI] [PMC free article] [PubMed] [Google Scholar]
- 2.DCCT Research Group. The effect of intensive treatment of diabetes on the development and progression of long-term complications in insulin-dependent diabetes mellitus. N Engl J Med. 1993;329:977–986. doi: 10.1056/NEJM199309303291401. [DOI] [PubMed] [Google Scholar]
- 3.Nathan DM, Cleary PA, Backlund JY, Genuth SM, Lachin JM, Orchard TJ, et al. Intensive diabetes treatment and cardiovascular disease in patients with type 1 diabetes. N Engl J Med. 2005;353:2643–2653. doi: 10.1056/NEJMoa052187. [DOI] [PMC free article] [PubMed] [Google Scholar]
- 4.Miller KM, Foster NC, Beck RW, Bergenstal RM, Dubose SN, DiMeglio LA, et al. Current state of type 1 diabetes treatment in the U.S: updated data from the T1D Exchange clinic registry. Diabetes Care. 2015;38:971–978. doi: 10.2337/dc15-0078. [DOI] [PubMed] [Google Scholar]
- 5.American Diabetes Association. Standards of medical care in diabetes–2018. Diabetes Care. 2018;41:S7–S153. doi: 10.2337/dc18-S001. [DOI] [PubMed] [Google Scholar]
- 6.Hanberger L, Samuelsson U, Lindblad B, Ludvigsson J Swedish Childhood Diabetes Registry SWEDIABKIDS. A1C in children and adolescents with diabetes in relation to certain clinical parameters: the Swedish Childhood Diabetes Registry SWEDIABKIDS. Diabetes Care. 2008;31:927–929. doi: 10.2337/dc07-1863. [DOI] [PubMed] [Google Scholar]
- 7.Willi SM, Miller KM, DiMeglio LA, Klingensmith GJ, Simmons JH, Tamborlane WV, et al. Racial-ethnic disparities in management and outcomes among children with type 1 diabetes. Pediatrics. 2015;135:424–434. doi: 10.1542/peds.2014-1774. [DOI] [PMC free article] [PubMed] [Google Scholar]
- 8.Rohan JM, Rausch JR, Pendley JS, Delamater AM, Dolan L, Reeves G, et al. Identification and prediction of group-based glycemic control trajectories during the transition to adolescence. Health Psychol. 2014;33:1143–1152. doi: 10.1037/hea0000025. [DOI] [PMC free article] [PubMed] [Google Scholar]
- 9.King PS, Berg CA, Butner J, Butler JM, Wiebe DJ. Longitudinal trajectories of parental involvement in Type 1 diabetes and adolescents’ adherence. Health Psychol. 2014;33:424–432. doi: 10.1037/a0032804. [DOI] [PMC free article] [PubMed] [Google Scholar]
- 10.Luyckx K, Seiffge-Krenke I. Continuity and change in glycemic control trajectories from adolescence to emerging adulthood: relationships with family climate and self-concept in type 1 diabetes. Diabetes Care. 2009;32:797–801. doi: 10.2337/dc08-1990. [DOI] [PMC free article] [PubMed] [Google Scholar]
- 11.Lawes T, Franklin V, Farmer G. HbA1c tracking and bio-psychosocial determinants of glycaemic control in children and adolescents with type 1 diabetes: retrospective cohort study and multilevel analysis. Pediatr Diabetes. 2014;15:372–383. doi: 10.1111/pedi.12100. [DOI] [PubMed] [Google Scholar]
- 12.Helgeson VS, Snyder PR, Seltman H, Escobar O, Becker D, Siminerio L. Brief report: trajectories of glycemic control over early to middle adolescence. J Pediatr Psychol. 2010;35:1161–1167. doi: 10.1093/jpepsy/jsq011. [DOI] [PMC free article] [PubMed] [Google Scholar]
- 13.Amiel SA, Sherwin RS, Simonson DC, Lauritano AA, Tamborlane WV. Impaired insulin action in puberty. A contributing factor to poor glycemic control in adolescents with diabetes. N Engl J Med. 1986;315:215–219. doi: 10.1056/NEJM198607243150402. [DOI] [PubMed] [Google Scholar]
- 14.Acerini CL, Cheetham TD, Edge JA, Dunger DB. Both insulin sensitivity and insulin clearance in children and young adults with type I (insulin-dependent) diabetes vary with growth hormone concentrations and with age. Diabetologia. 2000;43:61–68. doi: 10.1007/s001250050008. [DOI] [PubMed] [Google Scholar]
- 15.Kolterman OG, Insel J, Saekow M, Olefsky JM. Mechanisms of insulin resistance in human obesity: evidence for receptor and postreceptor defects. J Clin Invest. 1980;65:1272–1284. doi: 10.1172/JCI109790. [DOI] [PMC free article] [PubMed] [Google Scholar]
- 16.Wiegand S, Raile K, Reinehr T, Hofer S, Nake A, Rabl W, et al. Daily insulin requirement of children and adolescents with type 1 diabetes: effect of age, gender, body mass index and mode of therapy. Eur J Endocrinol. 2008;158:543–549. doi: 10.1530/EJE-07-0904. [DOI] [PubMed] [Google Scholar]
- 17.Karges B, Schwandt A, Heidtmann B, Kordonouri O, Binder E, Schierloh U, et al. Association of Insulin Pump Therapy vs Insulin Injection Therapy With Severe Hypoglycemia, Ketoacidosis, and Glycemic Control Among Children, Adolescents, and Young Adults With Type 1 Diabetes. JAMA. 2017;318:1358–1366. doi: 10.1001/jama.2017.13994. [DOI] [PMC free article] [PubMed] [Google Scholar]
- 18.Shashaj B, Sulli N. Difference in insulin usage patterns with pubertal development in children with type 1 diabetes during transition from multiple daily injections to continuous subcutaneous insulin infusion (CSII) and through the CSII treatment. Diabetes Technol Ther. 2009;11:767–774. doi: 10.1089/dia.2009.0049. [DOI] [PubMed] [Google Scholar]
- 19.Katz ML, Volkening LK, Butler DA, Anderson BJ, Laffel LM. Family-based psychoeducation and Care Ambassador intervention to improve glycemic control in youth with type 1 diabetes: a randomized trial. Pediatr Diabetes. 2014;15:142–150. doi: 10.1111/pedi.12065. [DOI] [PMC free article] [PubMed] [Google Scholar]
- 20.Laffel LM, Vangsness L, Connell A, Goebel-Fabbri A, Butler D, Anderson BJ. Impact of ambulatory, family-focused teamwork intervention on glycemic control in youth with type 1 diabetes. J Pediatr. 2003;142:409–416. doi: 10.1067/mpd.2003.138. [DOI] [PubMed] [Google Scholar]
- 21.Svoren BM, Butler D, Levine BS, Anderson BJ, Laffel LMB. Reducing acute adverse outcomes in youths with type 1 diabetes: a randomized, controlled trial. Pediatrics. 2003;112:914–922. doi: 10.1542/peds.112.4.914. [DOI] [PubMed] [Google Scholar]
- 22.Katz ML, Volkening LK, Anderson BJ, Laffel LM. Contemporary rates of severe hypoglycaemia in youth with type 1 diabetes: variability by insulin regimen. Diabet Med. 2012;29:926–932. doi: 10.1111/j.1464-5491.2012.03646.x. [DOI] [PMC free article] [PubMed] [Google Scholar]
- 23.Kuczmarski RJ, Ogden CL, Guo SS, Grummer-Strawn LM, Flegal KM, Mei Z, et al. 2000 CDC Growth Charts for the United States: methods and development. Vital Health Stat. 2002;11:1–190. [PubMed] [Google Scholar]
- 24.Kelly A, Winer KK, Kalkwarf H, Oberfield SE, Lappe J, Gilsanz V, et al. Age-based reference ranges for annual height velocity in US children. J Clin Endocrinol Metab. 2014;99:2104–2112. doi: 10.1210/jc.2013-4455. [DOI] [PMC free article] [PubMed] [Google Scholar]
- 25.Mortensen HB, Swift PG, Holl RW, Hougaard P, Hansen L, Bjoerndalen H, et al. Multinational study in children and adolescents with newly diagnosed type 1 diabetes: association of age, ketoacidosis, HLA status, and autoantibodies on residual beta-cell function and glycemic control 12 months after diagnosis. Pediatr Diabetes. 2010;11:218–226. doi: 10.1111/j.1399-5448.2009.00566.x. [DOI] [PubMed] [Google Scholar]
- 26.Swan KL, Weinzimer SA, Dziura JD, Steil GM, Voskanyan GR, Steffen AT, et al. Effect of puberty on the pharmacodynamic and pharmacokinetic properties of insulin pump therapy in youth with type 1 diabetes. Diabetes Care. 2008;31:44–46. doi: 10.2337/dc07-0737. [DOI] [PubMed] [Google Scholar]
- 27.Wiebe DJ, Chow CM, Palmer DL, Butner J, Butler JM, Osborn P, et al. Developmental processes associated with longitudinal declines in parental responsibility and adherence to type 1 diabetes management across adolescence. J Pediatr Psychol. 2014;39:532–541. doi: 10.1093/jpepsy/jsu006. [DOI] [PMC free article] [PubMed] [Google Scholar]
- 28.Chiang JL, Kirkman MS, Laffel LM, Peters AL. Type 1 diabetes through the life span: a position statement of the American Diabetes Association. Diabetes Care. 2014;37:2034–2054. doi: 10.2337/dc14-1140. [DOI] [PMC free article] [PubMed] [Google Scholar]
- 29.Ogden CL, Carroll MD, Kit BK, Flegal KM. Prevalence of childhood and adult obesity in the United States, 2011–2012. JAMA. 2014;311:806–814. doi: 10.1001/jama.2014.732. [DOI] [PMC free article] [PubMed] [Google Scholar]
- 30.DuBose SN, Hermann JM, Tamborlane WV, Beck RW, Dost A, DiMeglio LA, et al. Obesity in youth with type 1 diabetes in Germany, Austria, and the United States. J Pediatr. 2015;167:627–632. e621–624. doi: 10.1016/j.jpeds.2015.05.046. [DOI] [PubMed] [Google Scholar]


