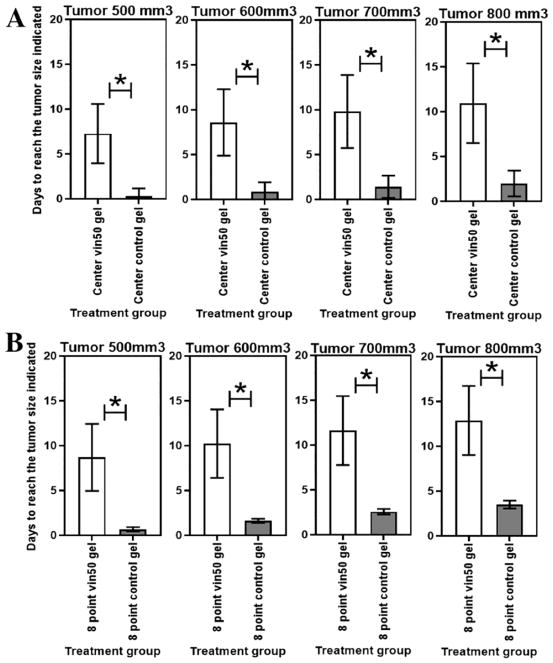
Figure 3.
Control gel vs vincristine-loaded gel. Time for tumor to reach 500mm3, 600 mm3, 700 mm3, or 800 mm3 comparing (A) central injection with vincristine 50 μg vs control; (B) eight-point injection of vincristine 50 μg vs control. Error bars represent one standard deviation; astrisk (*) indicates p <0.05.

