

Abstract
Objective
To assess whether the level of health information exchange (HIE) in U.S. hospitals is related to technology capabilities, incentives to exchange, or both.
Study Setting
A total of 1,812 hospitals attesting to stage 2 of Medicare's Meaningful Use Incentive Program through April 2016.
Study Design
Hospital‐level, multivariate OLS regression with state fixed effects was used to analyze the relationship between technology capability and incentives measures, and percent of care transitions with summary of care records (SCRs) sent electronically to subsequent providers.
Principal Findings
Stage 2 hospitals reported sending SCRs electronically for an average of 41 percent (median = 33 percent) of transitions. HIE level is related to four capability measures, one incentive measure, and one measure that is related to both capability and incentive. Percent of transitions with SCRs sent electronically was 3 percentage points higher (95 percent CI: 0.1–5.1) for hospitals with a third‐party HIE vendor, 3 percentage points higher (95 percent CI: 0.5–5.4) for hospitals with an EHR vendor as their HIE vendor, and 3 percentage points higher (95 percent CI: 0.4–5.4) for hospitals that automatically alert primary care providers. The direction and statistical significance of the relationships between specific EHR vendor and electronic SCR transmission level varied by vendor. Nonprofits and government hospitals performed 5 percentage points higher (95 percent CI: 1.5–9.1) and 8 percentage points higher (95 percent CI: 3.4–12.3) than for‐profits. Hospitals in systems performed 3 percentage points higher (95 percent CI: 0.8–6.1).
Conclusion
The overall level of HIE is low, with hospitals sending an SCR electronically for less than half of patient transitions. Specific hospital characteristics related to both technology capabilities and incentives were associated with higher levels of HIE.
Keywords: Technology adoption/diffusion/use, hospitals, information technology in health
Effective care coordination requires information flow between health care providers who care for the same patient (Vest and Gamm 2010). In our fragmented health care system, providers often lack access to critical health information generated in other settings where their patients receive care, creating patient safety risks and resulting in duplicative utilization (Leape et al. 1995; Walker et al. 2005). To address this problem, the 2009 HITECH Act incentivized providers to adopt electronic health records (EHRs) and to use them to share information to improve care coordination. Specifically, the HITECH Act's Meaningful Use criteria require that providers electronically generate and send a summary of care record (SCR) during care transitions. (An SCR includes 16 key types of information, such as problems, medications, and medication allergies.) Although the clinical utility of SCRs has not yet been established, they nonetheless remain an important policy goal whose routine transmission is a significant component of health information exchange (HIE) (Williams et al. 2012). To meet stage 2 Meaningful Use criteria, which began in 2014, hospitals need to send an SCR to the subsequent provider for a minimum of 50 percent of care transitions (i.e., discharges or referrals) and send an SCR electronically for a minimum of 10 percent of care transitions.
The threshold for sending an SCR electronically was set low because of the unique challenges to electronic connectivity between health care organizations. As opposed to sending an SCR via mail or fax, sending an SCR electronically requires a hospital to have HIE capabilities in place with the providers to whom they transition patients. While sending an SCR nonelectronically requires knowing a receiving provider’s address or fax number, sending an SCR electronically is substantially more complex; it requires that the sending and receiving providers have EHR systems that can communicate either directly (as in EHR‐to‐EHR transmissions) or indirectly (through a third party, such as a community health information organization [HIO]) as well as governance structures to ensure that data sharing is safe, secure, and legal.
Even if a hospital had the capabilities to electronically send an SCR, it is not clear that they would use these capabilities to the greatest extent possible and send SCRs electronically beyond the required threshold. Hospitals may perceive a competitive disadvantage from engaging in high levels of electronic health information sharing (Grossman, Kushner, and November 2008; Vest and Kash 2016), and there have been recent concerns that hospitals engage in business practices that interfere with HIE (“information blocking”) (Office of the National Coordinator for Health IT 2015). EHR vendors have also been criticized for engaging in information blocking practices that make it difficult to engage in cross‐vendor HIE, which could limit hospitals’ ability to routinely electronically send SCRs (Office of the National Coordinator for Health IT 2015). We have little insight into these issues because prior research has only examined factors associated with whether or not hospitals engage in HIE (Adler‐Milstein, DesRoches, and Jha 2011b; Adler‐Milstein and Jha 2014), not the factors associated with the level of exchange among all those engaging. To drive toward routine HIE, it is critical to assess the extent to which hospitals are electronically sending SCRs beyond the required threshold, and whether the level of SCRs sent electronically is associated with factors related to hospital capability to engage in HIE, their incentive to engage in HIE, or both.
In this study, we used the most recent national data on the level of SCRs sent by U.S. hospitals that attested to stage 2 Meaningful Use. In our primary analysis, we examined whether hospital capabilities to engage in HIE, as well as their incentives to do so, were associated with a higher percent of care transitions where an SCR was sent electronically. To disentangle factors that are specific to the challenges associated with HIE from factors that impact any attempt to share patient information across provider organizations, we further examined the relationship between the same capability and incentive factors and the percent of transitions where an SCR was sent in any form (i.e., electronic and nonelectronic) and the percent of all SCRs that were sent electronically. The former should be more sensitive to challenges of sending information in general, while the latter should be more sensitive to HIE‐specific factors. Using the first national data on the level of hospital HIE, we generate new insights into how to achieve the important policy goal of routine electronic health information exchange.
Methods
Data Sources
We created a hospital‐level analytic dataset by combining attestation data from the Centers for Medicare and Medicaid Services with hospital and market characteristics from the American Hospital Association (AHA) and the Dartmouth Atlas. For our primary analysis, we used data from a hospital's most recent attestation to stage 2 of the Medicare Meaningful Use (MU) program from the period of September 2014 through April 2016. These data include the percent of care transitions for which an SCR was sent electronically during the hospital's attestation period. For our secondary analyses, which involved measuring the percent of care transitions for which an SCR was sent in any mode and the percent of SCRs that were sent electronically, we again used data from a hospital's most recent attestation to stage 2 of the Medicare MU program. This data came from September 2014 through April 2015 because reporting on secondary measures was no longer required after April 2015 (Appendix SA3).
We matched MU data with 2014 AHA Annual Survey data to capture hospital characteristics and the 2014 AHA IT Supplement to capture hospital adoption of health information technology (HIT) and participation in health information organizations. Missing hospital characteristics were filled in using data from the most recent available year of the AHA Annual Survey from 2008 to 2013. Because HIT variables are likely to change from year to year, we did not fill in missing HIT variables using prior years of IT Supplement data. Finally, we added county‐level data from the 2012 Dartmouth Atlas to capture market characteristics that may be associated with the level of HIE.
Measures
The primary dependent variable measured the percent of all patient transitions for which an SCR was sent electronically during the attestation period (Table 1). The secondary analyses used two alternate dependent variables available only for hospitals attesting through April 2015: (1) the percent of all transitions where any SCR was sent electronically or nonelectronically during the attestation period, and (2) the percent of all sent SCRs that were transmitted electronically during the attestation period (Table 1). We dropped 41 observations with observed errors in the attestation data (e.g., number of SCRs sent electronically was greater than the number of SCRs sent in any mode and number of SCRs sent nonelectronically was negative).
Table 1.
Descriptive Statistics
| Variables | All Hospitals with Complete Data (Used in Heckman Model) (N = 2,475) | Hospitals with Complete Data That Attested to Stage 2 MU (Used in Primary Model) (N = 1,812) | Hospitals with Missing Data (Largely Due to AHA IT Supplement Nonresponse) (N = 446–3,892)* | |||
|---|---|---|---|---|---|---|
| Mean | SDa | Mean | SDa | Mean | SDa | |
| Dependent variables: level of HIE | ||||||
| Percent of transitions with an SCR sent electronically | 41% | 24 | 39% | 24 | ||
| Percent of transitions with an SCR sent paper or electronic | 78% | 15 | 78% | 15 | ||
| Percent of SCRs sent electronically | 46% | 26 | 45% | 26 | ||
| Independent variables | ||||||
| Technology capability | ||||||
| Third‐party HIE vendor | 50% | 58% | Missing | |||
| EHR vendor is HIE vendor | 46% | 50% | Missing | |||
| Automatic PCP alerts | 54% | 62% | Missing | |||
| Active HIO participation | 60% | 68% | Missing | |||
| EHR capability | ||||||
| Less than basic EHR | 29% | 20% | Missing | |||
| Basic EHR | 37% | 41% | Missing | |||
| Comprehensive EHR | 34% | 39% | Missing | |||
| Availability of potential exchange partners | 62% | 21 | 64% | 21 | 60% | 22 |
| Incentive | ||||||
| Market competition (HHI) | 0.18 | 0.12 | 0.18 | 0.12 | 0.17 | 0.11 |
| Market share | 6.08 | 9.12 | 6.92% | 9.82 | 3.56 | 5.96 |
| Ownership | ||||||
| Government | 23% | 21% | 19% | |||
| Non profit | 62% | 68% | 41% | |||
| For profit | 15% | 11% | 39% | |||
| % Revenue capitated | 0.64% | 4.39 | 0.64% | 4.54 | 0.83% | 6.48 |
| % Revenue shared risk | 1.05% | 5.95 | 1.20% | 6.58 | 0.85% | 5.41 |
| System membership | 66% | 65% | 64% | |||
| Network membership | 41% | 45% | 24% | |||
| Control | ||||||
| Size | ||||||
| Small | 57% | 40% | 65% | |||
| Medium | 35% | 45% | 31% | |||
| Large | 8% | 15% | 4% | |||
| Teaching status | ||||||
| Nonteaching | 67% | 64% | 82% | |||
| Minor teaching | 26% | 28% | 16% | |||
| Major teaching | 7% | 8% | 2% | |||
| % Inpatient days medicaid | 20% | 16 | 20% | 15 | 16% | 15 |
| % Inpatient days medicare | 50% | 24 | 51% | 22 | 51% | 24 |
| Geographic setting | ||||||
| Metro | 65% | 64% | 69% | |||
| Micro | 15% | 16% | 13% | |||
| Rural | 21% | 20% | 18% | |||
| Hospital beds in market per 1,000 residents | 2.45 | 1.26 | 2.42 | 1.16 | 2.48 | 1.26 |
| Population in market (in 1,000s) | 360 | 650 | 315 | 553 | 395 | 661 |
| Hospital‐ambulatory integration | 6.42 | 1.93 | 6.42 | 1.87 | 6.29 | 2.00 |
*Sample size varies due to missing data.
For continuous variables only.
EHR, electronic health record; HHI, Herfindahl‐Hirschman Index; HIO, health information organization; PCP, primary care provider; SCR, summary care record.
We selected independent variables based on our conceptual framework grounded in work by Vest (2010) that identified critical factors involved in health information exchange engagement using the technological, organizational, and environmental (TOE) framework developed by Tornatzky, Fleischer, and Chakrabarti (1990). While we used these categories to identify specific measures to include, we found that many measures spanned multiple categories—for example, participation in an HIO is a technological capability but one that is also determined by environmental factors (i.e., whether the market supports an HIO). We therefore decided to create the more flexible buckets of capability and incentive factors, as well as a third grouping for factors that fall into both.
Based on Vest (2010) and other literature on characteristics associated with hospital engagement in HIE, we selected fourteen hospitals and market characteristics and then categorized six as technology capability measures, five as incentive measures, and two as both (Appendix SA2). Hospital technology capability measures included whether the hospital used a third‐party HIE vendor (defined as whether the hospital used at least one of the HIE vendors listed in the AHA IT Survey), whether the hospital used their EHR vendor as their HIE vendor, whether the hospital engaged in automated primary care provider (PCP) alerts (whether the hospital automatically send notifications to PCPs if their patients visit the emergency department), whether the hospital actively participates in an HIO, the hospital's EHR capability (whether the hospital had a comprehensive, basic, or less than basic EHR [Charles et al. 2015]), primary inpatient EHR vendor (dichotomous measures of whether or not the hospital had each of the five largest vendors and a sixth measure for “any other vendor”), and the availability of potential exchange partners in the hospital's market (the percent of hospitals in the hospital referral region that report exchanging data electronically with hospitals outside their system) (Appendix SA2). This measure of hospitals with receiving capabilities captures the impact of whether other hospitals in the market have chosen to engage in HIE. We hypothesized that all would be associated with a higher percent of SCRs sent electronically.
The five incentive‐related measures that we hypothesized would influence the level of SCRs a hospital would send electronically included market competition, hospital market share, hospital ownership, and percent of revenue from risk‐based payments (measured separately for capitated payment and shared‐risk payment) (Appendix SA2). We measured market competition using the Herfindahl‐Hirschman index (HHI) based on the number of beds in hospitals or hospital systems in an HRR. In markets with low HHI (i.e., those that are more competitive), competitive pressures may discourage hospitals from engaging in higher levels of HIE to maintain market share. We measured hospital market share using the percent of the market beds owned by the hospital or multihospital system. Hospitals with larger market share may be less worried about competition from other hospitals and therefore more willing to send SCRs electronically. For‐profit hospitals may send fewer SCRs electronically than not‐for‐profit and government‐owned hospitals to maintain market share and profit margins. Hospitals with a higher proportion of revenue from capitated and shared‐risk plans have a stronger incentive to send more SCRs electronically to better manage patient care and reduce the possibility of rehospitalizations.
Finally, the two measures related to both capability and incentives include system membership and network membership (Appendix SA2). Hospitals in multihospital systems may have access to more technological resources, increasing their capability to send more SCRs electronically, and have an additional incentive to send SCRs to other hospitals within the system to promote in‐system patient retention. Although to a lesser extent than systems, hospitals that join networks may have greater access to pooled technological resources that enable more SCR exchange and an additional incentive to send more SCRs electronically to strengthen established relationships with other facilities in the network.
As controls, we captured hospital characteristics that may influence the relationship between our capability and incentive measures and percent of SCRs sent electronically but that may not, themselves, represent capabilities or incentives (Appendix SA2). These variables included hospital size (Small: <100 beds, Medium: 100–399 beds, Large: 400 + beds), teaching status (Major, Minor, Nonteaching), percent of inpatient days paid for by Medicare and Medicaid, and geographic setting as defined by the Core Based Statistical Area (Metro, Micro, Rural). We also created variables to control for market characteristics that might confound our focal relationships: the total number of hospital beds in the county per 1,000 residents and the level of hospital‐ambulatory integration (as measured by the logged number of physicians in management service organizations, integrated salary models, or foundations in the health referral region). Finally, we included state fixed effects because of state‐specific HIE infrastructure and policies (e.g., as a result of the State HIE Cooperative Agreement Program).
Statistical Analysis
Sample
We began with the 3,294 of 6,791 hospitals in the AHA database that responded to the 2014 AHA IT Survey. Out of those, 3,146 were eligible to participate in Medicare Meaningful Use, and 2,475 had complete data for all measures. Of those, 1,812 hospitals attested to stage 2 Meaningful Use as of April 2016 (Appendix SA3).
Descriptive Statistics
We first compared descriptive statistics of hospitals in our sample to the population of all hospitals in the AHA database that are eligible to participate in Medicare Meaningful Use. We then examined the distribution of our primary dependent variable (the percent of transitions where an SCR was sent electronically) and the relationship to the percent of transitions where an SCR was sent in any mode.
Primary Analyses
We used cross‐sectional, multivariate ordinary least squares regression models with state fixed effects to analyze the relationship between hospital characteristics and our dependent variables. Our primary model predicted the percent of transitions where an SCR was sent electronically. The sample for this analysis was 1,812 hospitals that attested to stage 2 Meaningful Use as of April 2016. To identify whether any characteristics differentiated hospitals that far exceeded the 10 percent threshold, we used a logistic regression model with state fixed effects to compare high‐SCR hospitals (hospitals that performed between 80 and 100 percent) with all other hospitals in our sample.
As a robustness test to address concerns about selection bias, we ran a Heckman sample selection model using all 2,475 hospitals that had complete data for all measures (i.e., both those that did and did not attest to stage 2 of Meaningful Use as of April 2016). As our dependent variable was only available for hospitals that attested to stage 2 Meaningful Use and hospitals that attested to stage 2 Meaningful Use are not randomly selected from the broader population, coefficient estimates from the OLS regression results based on this sample may be biased and inconsistent (Winship and Mare 1992; Dow and Norton 2003). The Heckman sample selection model adjusts OLS coefficients for biases that may be present as a result of sample selection. In addition to the main covariates, controls, and state effects, the selection part of the Heckman model included a categorical variable that indicated whether the hospital attested to stage 1 and, if so, the year of the hospital's latest stage 1 attestation, as an identification variable that is associated with stage 2 attestation but not the specific threshold of achievement on the HIE criterion. The year of a hospital's latest stage 1 attestation is an important predictor of stage 2 attestation, as hospitals that most recently attested to MU stage 1 were more likely to attest to stage 2, up until a point at which hospitals that attested to stage 1 too recently were not prepared to attest to stage 2 by 2016.
Secondary Analyses
In secondary analysis, we examined the two alternate dependent variables: (1) the percent of care transitions where an SCR was sent in any mode, electronic or paper, and (2) the percent of all sent SCRs that were transmitted electronically. These variables parse the primary dependent variable—the percent of care transitions with an SCR sent electronically—into two components: (1) ability to generate and send an SCR, and (2) the ability to send an SCR electronically. To perform well on the first component, hospitals must establish processes for routinely generating an SCR, knowing who the receiving provider is, and determining how to contact them. To perform well on the latter component, a hospital may know how to contact only a small proportion of their partners but must develop successful processes to routinely send SCRs electronically. To illustrate, a hospital could send an SCR electronically for 10 percent of patient transitions in one of two ways: by sending an SCR for 100 percent of patient transitions in any mode but only 10 percent of SCRs electronically or sending an SCR for only 10 percent of transitions but have all those SCRs sent electronically. In the former example, the hospital excels at the processes involved in generating and sending an SCR, but it may struggle with the technical capability to send an SCR electronically or may intentionally limit the number of SCRs sent electronically. In the latter example, the hospital may struggle with processes involved in routinely generating and sending an SCR, but when it does succeed in doing so, technical or incentive factors do not impact whether the SCR is transmitted electronically. Therefore, we expect that factors which are related to the first component, the ability to generate and send an SCR, will have a statistically significant relationship with our primary dependent variable as well as our first alternative dependent variable, the percent of patient transitions with an SCR sent in any mode. Factors that are related to the second component, the ability or incentive to send an SCR electronically, will have a relationship with our primary dependent variable as well as our second alternative dependent variable, the percent of transmitted SCRs where the SCR was sent electronically.
Our alternate dependent variables were only available in stage 2 attestation data through April 2015. After dropping observations with missing or erroneous data, of the 1,812 hospitals that had successfully attested to stage 2 Meaningful Use as of this date, 1,047 had complete data to run the first model, and 1,044 had complete data to run the second model. We first repeated our primary OLS analysis on this smaller sample to ensure results were consistent with those observed in the larger sample of 1,812. We then substituted in each of the alternate dependent variables and reran the OLS model.
Results
The majority of hospitals that successfully attested to stage 2 Meaningful Use as of April 2016 performed at relatively low levels of electronic SCR transmission. The mean percent of patient transitions with an SCR sent electronically was 41 percent, with a median of 33 percent (and 75th percentile of 56 percent) (Figure 1). This is substantially lower than achievement levels for most other stage 2 MU criteria (Winship and Mare 1992).
Figure 1.
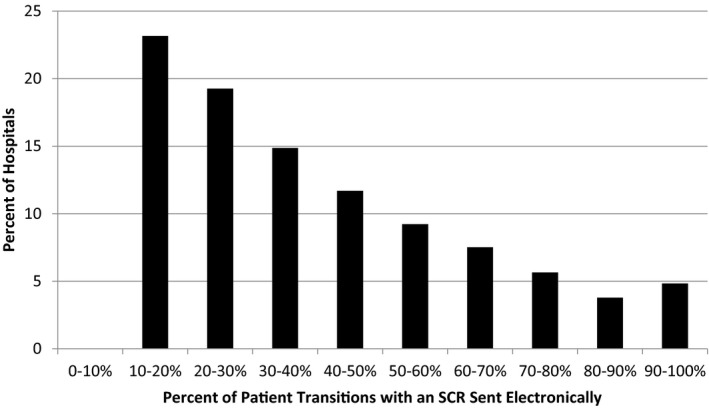
- Note. Through April 2016; n = 1,822.
When we examined the relationship between the percent of transitions where an SCR was sent electronically and the percent of transitions where an SCR was sent in any mode, we saw a wide distribution in performance across both measures and found a weak positive correlation (correlation coefficient = 0.285) (Figure 2). As compared to the median performance on electronic transmission of 33 percent (range of 10–100 percent), the median performance on any mode transmission was 79 percent (range of 50–100 percent).
Figure 2.
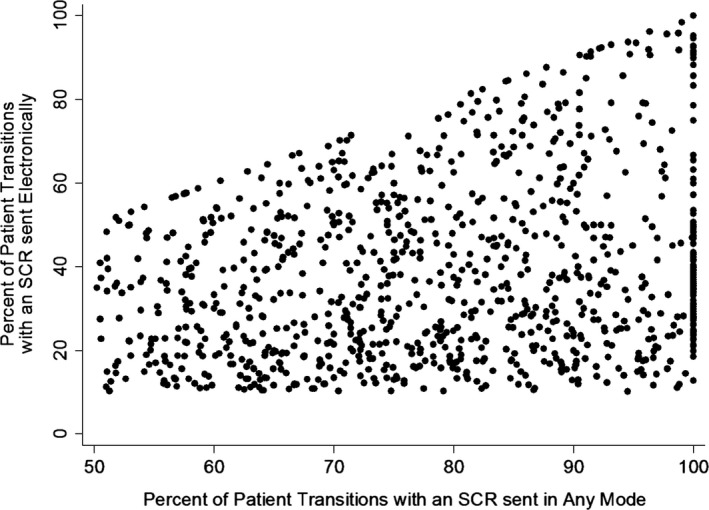
- Note. Through April 2015; n = 1,054. X‐axis truncated at 50 percent because the threshold for percent of patient transitions with an SCR sent in any mode was set at 50 percent, no hospitals in the dataset reported sending SCRs in any mode for less than 50 percent of patient transitions.
Primary Analysis
In the primary analysis, four of the seven hypothesized technology capability measures were associated with the percent of transitions with SCRs sent electronically. Hospitals that use a third‐party HIE vendor electronically transmitted SCRs for 3 percentage points more patient transitions (p = .040) than hospitals that do not use a third‐party HIE vendor, while hospitals that use their EHR vendor as their HIE vendor did so for 3 percentage points more patient transitions (p = .019) than hospitals that do not use their EHR vendor as their HIE vendor (Table 2). Hospitals that sent automated PCP alerts when patients visit the ED also had a higher percent of transitions with SCRs sent electronically (coefficient = 2.85, p = .025; Table 2). Hospitals with Epic as their primary inpatient EHR vendor sent SCRs electronically for 7 percentage points more patient transitions (p = .001), hospitals with Cerner sent SCRs electronically for 4 percentage points fewer patient transitions (p = .045), and hospitals with Siemens sent SCRs electronically for 7 percentage points more patient transitions (p = .013), Table 2), compared to hospitals with an “other” EHR vendor (i.e., not one of the top five). Active HIO participation, EHR capability, and the availability of potential exchange partners were not significantly related to the level of SCR transmission.
Table 2.
Relationship between Level of Electronic Health Information Exchange and Technology and Incentive Factors
| Primary Analysis | Logistic Analysis | |
|---|---|---|
| Percent of Patient Transitions with an SCR Sent Electronically | High‐Performing Hospitals (>80% Performance) versus All Other Hospitals (Odds Ratios) | |
| Constant | 24.78*** (5.25) | |
| Technology capability | ||
| Third‐party HIE vendor | 2.60* (1.26) | 1.20 (0.25) |
| EHR vendor as HIE vendor | 2.93* (1.24) | 1.23 (0.25) |
| Automatic PCP alerts | 2.85* (1.27) | 1.23 (0.27) |
| Active HIO participation | 1.29 (1.30) | 0.82 (0.17) |
| EHR capability (Ref: Less than basic) | ||
| Basic EHR | 1.00 (1.51) | 1.01 (0.25) |
| Comprehensive EHR | 1.07 (1.70) | 0.84 (0.24) |
| Vendor (Ref: Other) | ||
| Epic | 6.93** (2.10) | 0.83 (0.27) |
| Meditech | −1.37 (1.80) | 0.75 (0.21) |
| Cerner | −4.03* (2.01) | 0.25*** (0.10) |
| McKesson | −1.27 (2.24) | 0.45* (0.18) |
| Siemens | 6.64* (2.68) | 0.50 (0.25) |
| Available exchange partners | 0.02 (0.03) | 1.00 (0.00) |
| Incentive | ||
| Market competition (HHI) | 0.09 (6.47) | 1.75 (1.64) |
| Market share | 0.07 (0.09) | 1.02 (0.01) |
| Ownership (Ref: For profit) | ||
| Government | 7.84*** (2.29) | 6.76** (4.32) |
| Non profit | 5.33** (1.97) | 6.08** (3.75) |
| % Revenue capitated | −0.14 (0.12) | 0.96 (0.04) |
| % Revenue shared risk | −0.09 (0.09) | 0.99 (0.02) |
| Both | ||
| System membership | 3.45* (1.35) | 1.13 (0.25) |
| Network membership | −1.08 (1.15) | 1.63* (0.31) |
| Control | ||
| Size/Teaching (Ref: Small nonteaching) | ||
| Small minor teaching | −1.02 (3.22) | 1.29 (0.63) |
| Medium nonteaching | −1.95 (1.75) | 0.66 (0.19) |
| Medium minor teaching | −3.97 (2.04) | 0.49* (0.17) |
| Medium major teaching | −1.07 (4.85) | 0.97 (0.71) |
| Large nonteaching | 7.84 (4.90) | 1.94 (1.24) |
| Large minor teaching | −5.83* (2.96) | 0.39 (0.21) |
| Large major teaching | −15.81 *** (3.04) | 0.13** (0.09) |
| % Inpatient days Medicaid | 0.00 (0.04) | 1.00 (0.01) |
| % Inpatient days Medicare | −0.01 (0.03) | 1.00 (0.01) |
| Geographic setting (Ref: Metro) | ||
| Micro | 0.13 (1.73) | 0.95 (0.26) |
| Rural | 4.65* (1.97) | 1.10 (0.32) |
| Hospital beds in market per 1,000 residents | 0.79 (0.55) | 1.08 (0.08) |
| Population in market (in 1,000s) | 0.00 (0.00) | 1.00 (0.00) |
| Hospital‐ambulatory integration | 0.00 (0.40) | 1.01 (0.06) |
| N | 1,812 | 1,812 |
| R 2 | 0.08 | |
Notes. Standard errors in parentheses, legend: *p < .05, **p < .01, ***p < .001; state fixed effects included; Data are from stage 2 Meaningful Use Data as of April 2016.
EHR, electronic health record; HHI, Herfindahl‐Hirschman Index; HIO, health information organization; PCP, primary care provider; SCR, summary care record.
We also found evidence supporting a relationship between one of the five incentive measures and percent of patient transitions with SCRs sent electronically. Hospitals with government or nonprofit ownership had higher levels than hospitals with for‐profit ownership (coefficient = 7.84, p = .001, for government hospitals compared with for‐profit hospitals, and coefficient = 5.33, p = .007, for nonprofit hospitals compared with for‐profit hospitals; Table 2). Market competition, market share, and percent of revenue from risk‐based payments were not significantly related.
For the two measures that are related to both capability and incentive, we found that system membership compared with no system membership had a strong positive association with SCR transmission (coefficient = 3.45, p = .010; Table 2), but network membership compared with no network membership did not (coefficient = −1.08, p = .348; Table 2).
Two control measures were related to the percent of transitions with an SCR sent electronically. Compared to small nonteaching hospitals, large minor teaching and large major teaching hospitals had lower levels of SCR transmission (coefficient = −5.83, p = .049, for large minor teaching compared with small nonteaching, and coefficient = −15.81, p < .001, for large major teaching compared with small nonteaching; Table 2); and rural hospitals had higher levels of SCR transmission than metro hospitals (coefficient = 4.65, p = .018; Table 2).
When we examined the characteristics that differentiated the 156 hospitals in our sample that performed between 80 percent and 100 percent compared with the 1,656 hospitals that performed below 80 percent, we found several factors that were significantly related. Hospitals with Cerner as the primary inpatient vendor had 75 percent lower odds of being in the high‐performance group (OR = 0.25, p < .001), and hospitals with McKesson had 55 percent lower odds of being in the high‐performance group (OR = 0.45, p = .049, Table 2) compared with hospitals with an “other” (not top 5) EHR vendor. Compared to for‐profit hospitals, government‐owned hospitals had seven times greater odds of being in the high‐performance group (OR = 6.76, p = .003) and nonprofit hospitals had six times greater odds of being in the high‐performance group (OR = 6.08, p = .003, Table 2). Compared to hospitals not in a network, hospitals in a network had 1.6 times greater odds of being in the high‐performance group (OR = 1.63, p = .011, Table 2). Finally, compared to small nonteaching hospitals, medium nonteaching hospitals had 51 percent lower odds of being in the high‐performance group (OR = 0.49, p = .046) while large major teaching hospitals had 87 percent lower odds of being in the high‐performance group (OR = 0.13, p = .003, Table 2).
When we performed the Heckman selection model as a robustness test, we found very weak evidence of sample selection bias (altrho = −0.103, p = .247). Sample bias was negative, which is consistent with our expectation that hospitals that did not attest to stage 2 had a lower predicted percent of transitions with an SCR sent electronically than those that did attest. Given this small degree of bias, model coefficients and level of statistical significance were almost identical in the Heckman and OLS models, bolstering confidence that our primary analysis results are not biased by including only hospitals that attested to stage 2 Meaningful Use. We therefore did not adjust our primary results for the Heckman model controls and instead report them in the appendix (Appendix SA4).
Secondary Analysis
When we replicated our primary model in the smaller sample for which our alternate dependent variables were available, among the variables that were positive and significant in our primary analysis, we found that four variables matched the patterns that would indicate particular relevance to the ability or incentive to send an SCR electronically: (1) using Epic as compared to using an “other” EHR vendor (coefficients = 5.60, −3.55, and 8.46, p = values .033, 0.031, and 0.007 for models 1, 2, and 3, respectively; Table 3), (2) government ownership (coefficients = 6.10, −9.00, and 10.98, p‐values .040, <.001, and .002 for models 1, 2, and 3, respectively; Table 3), and (3) nonprofit ownership (coefficients = 1.80, −8.77, and 6.85, p‐values .48, <.001, and .025 for models 1, 2, and 3, respectively; Table 3) as compared to for‐profit ownership, as well as (4) system membership (coefficients = 5.47, 0.19, and 5.63, p‐values .001, .862, and .006 for models 1, 2, and 3, respectively; Table 3).
Table 3.
Secondary Analyses: Comparing Factors Associated with Sending SCRs Electronically versus Any Mode
| Secondary Analyses | |||
|---|---|---|---|
| Dependent Variable 1: Percent Transitions with SCR Sent Electronically | Dependent Variable 2: Percent Transitions with SCR Sent in Any Mode | Dependent Variable 3: Percent of Transmitted SCRs Sent Electronically | |
| Constant | 22.02*** (6.41) | 92.33*** (4.02) | 16.90* (7.59) |
| Technology capability | |||
| Third‐party HIE vendor | 1.53 (1.60) | 0.94 (1.00) | 0.98 (1.90) |
| EHR vendor as HIE vendor | −0.61 (1.60) | −1.69 (1.01) | 0.3 (1.90) |
| Automatic PCP alerts | 1.99 (1.65) | 2.18* (1.04) | 1.88 (1.97) |
| Active HIO participation | 1.30 (1.65) | 1.55 (1.04) | 1.25 (1.96) |
| EHR capability (Ref: Less than Basic) | |||
| Basic EHR | −0.78 (2.04) | −0.55 (1.28) | 0.6 (2.43) |
| Comprehensive EHR | −0.21 (2.23) | −1.06 (1.40) | 1.7 (2.65) |
| Vendor (Ref: Other) | |||
| Epic | 5.60* (2.62) | −3.55* (1.64) | 8.46** (3.11) |
| Meditech | −2.83 (2.38) | 2.12 (1.49) | −3.63 (2.82) |
| Cerner | −2.88 (2.57) | −8.94*** (1.62) | 2.38 (3.06) |
| McKesson | −8.63** (2.94) | −10.81*** (1.84) | −3.05 (3.48) |
| Siemens | 4.20 (3.69) | −5.06* (2.32) | 13.26** (4.37) |
| Available exchange partners | −0.01 (0.04) | −0.03 (0.02) | 0.01 (0.04) |
| Incentive | |||
| Market competition (HHI) | −0.12 (7.56) | −0.70 (4.75) | 4.65 (8.96) |
| Market share | 0.01 (0.10) | 0.05 (0.06) | −0.04 (0.12) |
| Ownership (Ref: For profit) | |||
| Government | 6.10* (2.96) | −9.00*** (1.86) | 10.98** (3.51) |
| Non profit | 1.80 (2.57) | −8.76*** (1.62) | 6.85* (3.05) |
| % Revenue capitated | −0.20 (0.17) | −0.00 (0.11) | −0.28 (0.20) |
| % Revenue shared risk | −0.15 (0.10) | −0.10 (0.07) | −0.13 (0.12) |
| System membership | 5.47** (1.71) | 0.19 (1.07) | 5.63** (2.03) |
| Network membership | −1.25 (1.42) | −1.03 (0.89) | −0.58 (1.68) |
| Control | |||
| Size/Teaching (Ref: Small nonteaching) | |||
| Small minor teaching | −7.42* (3.66) | −5.84* (2.30) | −4.39 (4.34) |
| Medium nonteaching | −2.90 (2.21) | −5.02*** (1.39) | 0.72 (2.61) |
| Medium minor teaching | −4.16 (2.47) | −3.93* (1.55) | −1.61 (2.93) |
| Medium major teaching | −8.28 (6.81) | −2.51 (4.28) | −6.31 (8.07) |
| Large nonteaching | 2.66 (5.46) | 0.55 (3.43) | 4.02 (6.46) |
| Large minor teaching | −6.26 (3.50) | −6.87** (2.20) | −2.67 (4.15) |
| Large major teaching | −13.39*** (3.61) | −7.26** (2.27) | −11.52** (4.28) |
| % Inpatient days medicaid | 0.03 (0.05) | 0.01 (0.03) | 0.04 (0.06) |
| % Inpatient days medicare | 0.06 (0.03) | 0.00 (0.02) | 0.06 (0.04) |
| Geographic setting (Ref: Metro) | |||
| Micro | 0.47 (2.16) | −1.98 (1.36) | 2.74 (2.57) |
| Rural | 0.71 (2.46) | 2.05 (1.55) | 0.96 (2.93) |
| Hospital beds in market per 1,000 residents | 1.80**(0.58) | 0.63 (0.37) | 1.75* (0.69) |
| Population in market (in 1,000s) | 0.00 (0.00) | −0.00 (0.00) | 0.00 (0.00) |
| Hospital‐ambulatory integration | 0.33 (0.50) | −0.13 (0.32) | 0.58 (0.59) |
| N | 1,047 | 1,047 | 1,044 |
| R 2 | 0.13 | 0.22 | 0.12 |
Notes. Standard errors in parentheses, legend: *p < .05, **p < .01, ***p < .001; state fixed effects included; data are from stage 2 Meaningful Use Data as of April 2015.
EHR, electronic health record; HHI, Herfindahl‐Hirschman Index; HIO, health information organization; PCP, primary care provider; SCR, summary care record.
Discussion
Using national data on the level of health information exchange in U.S. hospitals, we found that most hospitals performed at low levels on the Meaningful Use criterion that requires electronic transmission of a summary of care records during patient care transitions. This is important because, while 85 percent of hospitals report the ability to send an SCR electronically (Interoperability among US Non‐federal Acute Care Hospitals in 2015,), the median hospital in our data reported only sending an SCR electronically for 33 percent of patient transitions. We found that four technology capability factors (using a third‐party HIE vendor, using EHR vendor as HIE vendor, sending automated alerts to primary care providers, and EHR vendor), one incentive factor (government and nonprofit ownership) and one factor related to both capability and incentive (system membership) predicted a higher percent of transitions with SCRs sent electronically. Our secondary analyses suggest that one capability factor (using an Epic EHR), one incentive factor (government and nonprofit ownership), and one factor related to both (system membership) are specifically related to the electronic transmission component as opposed to the ability to generate and send an SCR in any mode. These findings suggest that it is important to focus on incentive factors as well as technology factors and that a multipronged policy approach that promotes improved technical capabilities in parallel with strengthening incentives for hospitals to routinely engage in HIE is likely required.
Among the technology capability factors, we found that hospitals with a third‐party HIE vendor and those that use their EHR vendor as their HIE vendor both sent SCRs electronically for a higher percent of transitions. This is encouraging because it suggests that the varied HIE solutions provided both by traditional EHR vendors and third‐party HIE vendors are helping hospitals to achieve higher thresholds of HIE. Having choices of HIE solutions in the market may therefore allow hospitals to pick the one that best meets their needs and supports more routine engagement in HIE. This may be particularly useful because we found that not all vendors appeared to have equally strong ability to support hospitals in achieving a high level of electronic SCR transmission.
We were surprised to find that health information organization participation and the prevalence of other hospital exchange partners in the market did not have a statistically significant relationship with percent of transitions with SCRs sent electronically, although the direction of the effects is in the hypothesized direction. This may be explained by the fact that many health information organizations have focused on particular HIE use cases such as laboratory result exchange, instead of sending SCRs (Adler‐Milstein, Bates, and Jha 2011a). Health information organizations that do enable sending SCRs may not have gained a critical mass of provider participants to enable hospitals to achieve high exchange thresholds. Similarly, having more hospital exchange partners may not facilitate high exchange thresholds because ambulatory providers are the key recipients of SCRs from hospitals. For this reason, we suspect that the relationship we observed between automated alerts to primary care providers and a higher percent of transitions with SCRs sent electronically reflects hospital capabilities to coordinate with ambulatory providers. Because it was also related to SCRs sent in any mode, the specific mechanism is likely hospital investment in identifying and capturing the patient's primary care providers and associated contact information.
While we were not surprised to find that incentive‐related factors were also associated with higher levels of HIE, it is interesting that these were the factors that appeared particularly helpful with the electronic component of sending SCRs in our secondary analyses. This finding lends credence to the commonly held notion that the challenging components of HIE are largely nontechnical. Instead, they are related to trust, governance, workflow redesign, and others issues that require strong interorganizational relationships. Given this, it is not surprising that system membership was a significant predictor. Hospitals that are part of the same system are more likely to have the relationships and collaborative structures in place to address nontechnical barriers to HIE, which reflect their stronger incentives to pursue HIE (at least among system members) (Miller and Tucker 2014). This logic also likely holds for our results related to hospital ownership, with for‐profit hospitals least likely to want to pursue the strong interorganizational relationships that facilitate HIE. Specifically, the ability to electronically transmit SCRs can require significant investment in partner‐specific relationships to develop links through enterprise HIE or custom interfaces (Vest and Kash 2016) as well as joint decision‐making processes, and for‐profit hospitals may be disinclined to engage in these partnerships due to concerns about maintaining long‐term autonomy and competitive position (Henderson 1990; Horwitz 2005; Adler‐Milstein and Jha 2014).
Perhaps surprisingly, we failed to find relationships for many of the variables that have been associated with HIE engagement in prior work. Specifically, prior research finds that hospital market competition (HHI and percent of market beds) (Vest 2010; Adler‐Milstein, DesRoches, and Jha 2011b; Adler‐Milstein and Jha 2014), ownership, and EHR capability (Furukawa et al. 2013) are related to hospitals’ decision to engage in HIE. Given that we found that some of these relationships no longer held when examining the level of HIE among those that have already decided to engage in HIE, it suggests that different dynamics are at play. Specifically, we suspect that once hospitals invest in the capabilities to pursue HIE, market factors do not significantly impact the level of exchange. This is encouraging because it implies that once hospitals decide to engage in HIE, competitive dynamics attenuate.
Our study includes some limitations that should be taken into consideration. First, there are several potential sources of measurement error. Because these data are unique and no other national sources capture the level of hospital HIE, we were not able to validate the attestation data. While we were not able to verify the accuracy of the Meaningful Use attestation data, our confidence in the data is bolstered by the fact that the Meaningful Use program has highly specific requirements and performance reporting periods. It requires documentation and legal attestation that participants have met program requirements. In addition, all CMS programs audit a subset of participants and have penalties if the audit reveals inaccurate reporting. While these strategies are imperfect, they are robust for large, national programs. Most important, as Meaningful Use achievement is based on meeting a required threshold, there is no incentive for hospitals to over‐report their performance once that required threshold (of 10 percent) is achieved. In addition, our measure of potential exchange partners (percent of hospitals in the market that report exchanging with outside ambulatory providers or hospitals) excludes ambulatory care settings and is therefore incomplete. Second, our analysis focuses on the transmission of SCRs as an important signal of health information exchange. However, given that the clinical utility of SCRs has not yet been established, it may be that hospitals are engaging in low levels of SCR exchange due to the limited usefulness of SCRs and narrow use cases. Finally, all our results are associational and we are not able to assess whether the factors that we measure have a causal relationship with the percent of transitions with SCRs sent electronically. While we considered including other outcomes in our analysis, only one other MU criterion is tangentially related to health information exchange, electronic prescribing, but the majority of hospitals were not eligible to report it for stage 2 MU. Future studies should examine the impact of hospital characteristics on the level of engagement in other types of health information exchange as data become available.
Our findings have important policy implications. They reveal that U.S. hospitals are far from routinely sending health information electronically during care transitions, and this should be of substantial concern to policy makers. The low average percent of patient transitions with an SCR sent electronically stands in marked contrast to other Meaningful Use measures for which hospitals far exceeded required thresholds (Adler‐Milstein 2016). For example, in 2016, stage 2 attesting hospitals provided electronic access to health information to 88 percent of eligible patients on average (threshold was 50 percent) and provided patient‐specific education materials for 75 percent of admitted patients on average (threshold was 10 percent), but only sent an SCR electronically for 41 percent of eligible patient transitions (threshold was 10 percent). Given that HIE is one of three priorities specifically called out in the original HITECH legislation because it is essential to realizing the substantial potential value from EHRs (The American Recovery and Reinvestment Act of 2009, 2009), it is critical to continue to pursue policy efforts that move us toward routine HIE.
Our results suggest that current incentives to engage in HIE, which to‐date have primarily come in the form of Meaningful Use payments, have not driven hospitals to achieve high levels of HIE. Stronger incentives may therefore be necessary. With the shift from Meaningful Use payments to penalties, and the passage of the 21st Century Cures Act, the policy strategy is shifting from positive incentives for engaging in HIE to negative incentives for failing to do so or for otherwise impeding HIE. Specifically, starting in 2018, hospitals will be penalized under the Meaningful Use program if they fail to meet stage 3 requirements, including the HIE criterion that raises the threshold for electronic SCR transmission to 50 percent of care transitions (Centers for Medicare & Medicaid Services 2015). Under the 21st Century Cures Act, hospitals (as well as other providers and EHR vendors) that engage in information‐blocking behaviors will face penalties of up to $1 million (21st Century Cures Act 2016). These two direct incentives, which penalize hospitals for failing to engage in HIE, will be complemented by an additional provision of 21st Century Cures that uses a more indirect incentive to pressure EHR vendors to improve interoperability. Specifically, the TRUST provisions create a process for more transparent reporting of EHR vendor interoperability performance, which could compel vendors to improve interoperability to enhance market share and protect their reputations (21st Century Cures Act, 114th Congress 2016).
Whether this shift in approach to HIE incentives will spur hospitals to engage in high levels of HIE is an open question. However, our results, particularly those from our secondary analysis that find that nonprofit and government ownership and system membership are specifically related to transmitting more SCRs electronically, suggest that indirect positive incentives that reward hospitals for improving care coordination may also be important. Current policy efforts that reward hospitals for acting like a “system,” such as bundled payment and Accountable Care Organizations, help ensure that hospitals see benefits from HIE and could therefore drive higher levels of engagement. These policy efforts could be even more effective in increasing HIE if they included HIE‐sensitive measures in the assessment of value, including those recently recommended in a report to Congress (Office of the National Coordinator for Health IT 2015). Ultimately, our results suggest that both positive and negative incentives are likely necessary, and so it is encouraging that the current policy strategy includes both types.
Conclusion
In this study, we used national hospital data on the level of HIE to support care transitions and found low levels of HIE overall. However, there was heterogeneity across hospitals, and hospital characteristics associated with technology capabilities as well as incentives to engage in exchange were related to HIE level. Our findings suggest that a policy focus that simultaneously targets capabilities and incentives is needed to ensure that HIE routinely occurs during care transitions.
Supporting information
Appendix SA1: Author Matrix.
Appendix SA2: Measures and Data Sources.
Appendix SA3: Overview of Study Sample.
Appendix SA4: Heckman Sample Selection Model for Primary Analysis: Percent of Transitions with Electronic SCR Transmission, First and Second Part Results.
Acknowledgments
Joint Acknowledgment/Disclosure Statement: Core support for this research was provided by the Health IT Impact Lab at the University of Michigan, under the direction of Dr. Julia Adler‐Milstein. The Health IT Impact Lab is supported by the School of Information at the University of Michigan. Dr. Julia Adler‐Milstein is on the advisory board for QPID Health. The authors would like to thank Dr. Edward Norton for his feedback on the use of the Heckman Selection model.
Julia Adler‐Milstein was supported by the School of Information. Jordan Everson was supported by an AHRQ Dissertation Grant, and Sunny Lin was supported by the School of Public Health, at the University of Michigan.
However, the funds used to support this work were indeed internal to the University Michigan and was provided as seed money to Dr. Adler‐Milstein for the HIT Impact Lab.
Disclosures: None.
Disclaimer: None.
References
- Adler‐Milstein, J . 2016. “A Creative Plan That Could Help Providers Ineligible for Meaningful Use Not Get Left behind in the Paper World.” Health Affairs Blog. May 25. [Google Scholar]
- Adler‐Milstein, J. , Bates D. W., and Jha A. K.. 2011a. “A Survey of Health Information Exchange Organizations in the United States: Implications for Meaningful Use.” Annals of Internal Medicine 154 (10): 666–71. [DOI] [PubMed] [Google Scholar]
- Adler‐Milstein, J. , DesRoches C. M., and Jha A. K.. 2011b. “Health Information Exchange among US Hospitals.” American Journal of Managed Care 17 (11): 761–8. [PubMed] [Google Scholar]
- Adler‐Milstein, J. , and Jha A. K.. 2014. Health Information Exchange among U.S. Hospitals: Who's in, Who's out, and Why? Healthcare 2 (1): 26–32. [DOI] [PubMed] [Google Scholar]
- The American Recovery and Reinvestment Act of 2009 (ARRA) . 2009.
- Centers for Medicare & Medicaid Services (CMS), Health and Human Services . 2015. “Medicare and Medicaid Programs; Electronic Health Record Incentive Program‐Stage 3 and Modifications to Meaningful Use in 2015 through 2017.” Federal Register 80: 62761–955. [PubMed] [Google Scholar]
- 21st Century Cures Act, 114th Congress . 2016. Available at http://docs.house.gov/meetings/IF/IF00/20150519/103516/BILLS-1146ih.pdf
- Charles, D. , King J., Patel V., and Furukawa M. F.. 2015. “Adoption of Electronic Health Record Systems among US Non‐Federal Acute Care Hospitals: 2008–2014.” ONC Data Brief (23).
- Dow, W. H. , and Norton E. C.. 2003. “Choosing between and Interpreting the Heckit and Two‐Part Models for Corner Solutions.” Health Services and Outcomes Research Methodology 4 (1): 5–18. [Google Scholar]
- Furukawa, M. F. , Patel V., Charles D., Swain M., and Mostashari F.. 2013. “Hospital Electronic Health Information Exchange Grew Substantially in 2008–12.” Health Affairs 32 (8): 1346–54. [DOI] [PubMed] [Google Scholar]
- Grossman, J. M. , Kushner K. L., and November E. A.. 2008. “Creating Sustainable Local Health Information Exchanges: Can Barriers to Stakeholder Participation be Overcome?” Research Brief 2: 1–12. [PubMed] [Google Scholar]
- Henderson, J. C. 1990. “Plugging into Strategic Partnerships: The Critical IS Connection.” Sloan Management Review. 31 (3): 7–18. [Google Scholar]
- Horwitz, J. R. 2005. Does Corporate Ownership Matter? Service Provision in the Hospital Industry. Cambridge, MA: National Bureau of Economic Research Working Paper Series. [Google Scholar]
- Leape, L. L. , Bates D. W., Cullen D. J., Cooper J., Demonaco H. J., Gallivan T., Hallisey R., Ives J., Laird N., Laffel G., Nemeskal R., Petersen L. A., Porter K., Servi D., Shea B. F., Small S. D., Sweitzer B. J., Thompson B. T., Vander Vliet M., Bates D., Hojnowski‐Diaz P., Petrycki S., Cotugno M., Patterson H., Hickey M., Kleefield S., Kinneally E., Clapp M. D., J. R., Hackman , and Edmondson A.. 1995. “Systems Analysis of Adverse Drug Events.” Journal of the American Medical Association 274 (1): 35–43. [PubMed] [Google Scholar]
- Miller, A. R. , and Tucker C.. 2014. “Health Information Exchange, System Size and Information Silos.” Journal of Health Economics 33: 28–42. [DOI] [PubMed] [Google Scholar]
- Office of the National Coordinator for Health IT . 2015. Report to Congress: Challenges and Barriers to Interoperability. Department of Health and Human Services.
- Office of the National Coordinator for Health IT . 2015. Report to Congress: Report on Health Information Blocking. Department of Health and Human Services.
- Patel, V. , Henry J., Pylypchuk Y., and Searcy T.. 2016. “Interoperability among US Non‐federal Acute Care Hospitals in 2015.” ONC Data Brief (36). [Google Scholar]
- Tornatzky, L. G. , Fleischer M., and Chakrabarti A. K.. 1990. The Processes of Technological Innovation. Lexington, MA: Lexington Books, xviii, 298. [Google Scholar]
- Vest, J. R. 2010. “More Than Just a Question of Technology: Factors Related to Hospitals’ Adoption and Implementation of Health Information Exchange.” International Journal of Medical Informatics 79 (12): 797–806. [DOI] [PubMed] [Google Scholar]
- Vest, J. R. , and Gamm L. D.. 2010. “Health Information Exchange: Persistent Challenges and New Strategies.” Journal of the American Medical Informatics Association 17 (3): 288–94. [DOI] [PMC free article] [PubMed] [Google Scholar]
- Vest, J. R. , and Kash B. A.. 2016. “Differing Strategies to Meet Information‐Sharing Needs: Publicly Supported Community Health Information Exchanges versus Health Systems’ Enterprise Health Information Exchanges: Differing Strategies to Meet Information‐Sharing Needs.” The Milbank Quarterly 94 (1): 77–108. [DOI] [PMC free article] [PubMed] [Google Scholar]
- Walker, J. , Pan E., Johnston D., and Adler‐Milstein J.. 2005. “The Value of Health Care Information Exchange and Interoperability.” Health Affairs 24: W5. [DOI] [PubMed] [Google Scholar]
- Williams, C. , Mostashari F., Mertz K., Hogin E., and Atwal P.. 2012. “From the Office of the National Coordinator: The Strategy for advancing the Exchange of Health Information.” Health Affairs 31 (3): 527–36. [DOI] [PubMed] [Google Scholar]
- Winship, C. , and Mare R. D.. 1992. Models for Sample Selection Bias. Annual Review of Sociology 18: 327–50. [Google Scholar]
Associated Data
This section collects any data citations, data availability statements, or supplementary materials included in this article.
Supplementary Materials
Appendix SA1: Author Matrix.
Appendix SA2: Measures and Data Sources.
Appendix SA3: Overview of Study Sample.
Appendix SA4: Heckman Sample Selection Model for Primary Analysis: Percent of Transitions with Electronic SCR Transmission, First and Second Part Results.