Figure 3.
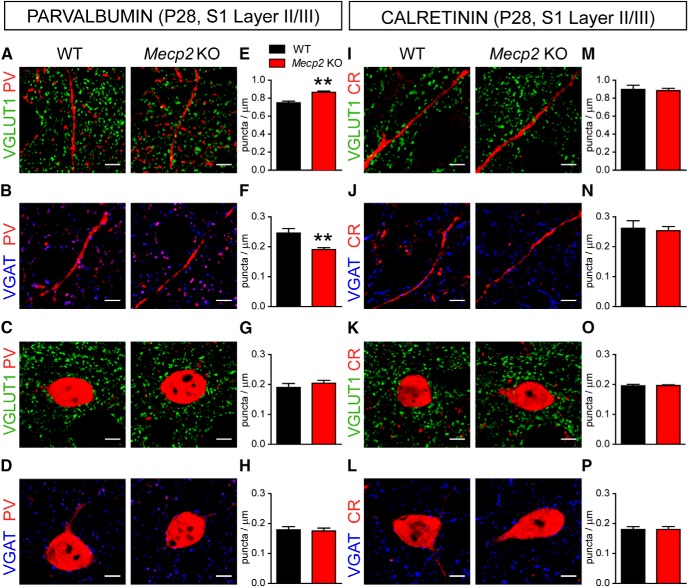
Distribution of excitatory and inhibitory presynaptic terminals onto PV+ INs in P28 Mecp2 KO mice. Representative confocal images of excitatory, VGLUT1+ (green: A, C) and inhibitory, VGAT+ (blue: B, D) synaptic terminals contacting PV+ (red) dendrites (top) and somata (bottom) in layer II/III of S1 cortex in P28 WT and Mecp2 KO mice. Histograms showing quantitative analysis in WT and Mecp2 KO mice of VGLUT1+ and VGAT+ puncta density contacting either dendrites (E, F) or somata (G, H), respectively, of PV+ INs. Representative confocal images of VGLUT1+ (green: I, K) and VGAT+ (blue: J, L) puncta contacting CR+ (red) dendrites (top) and somata (bottom) in layer II/III of S1 cortex in P28 Mecp2 KO mice and WT littermates. Histograms showing quantitative analysis in WT and Mecp2 KO mice of VGLUT1+ and VGAT+ puncta density contacting either dendrites (M, N) or somata (O, P), respectively, of CR+ INs. PV: GLUT1 dendrites n = 5 mice per genotype; GLUT1 soma n = 8 mice per genotype; VGAT n = 5 mice per genotype; CR: VGLUT1 and VGAT n = 5 mice per genotype. Student’s t test: **p < 0.01. Scale bars = 5 μm.

