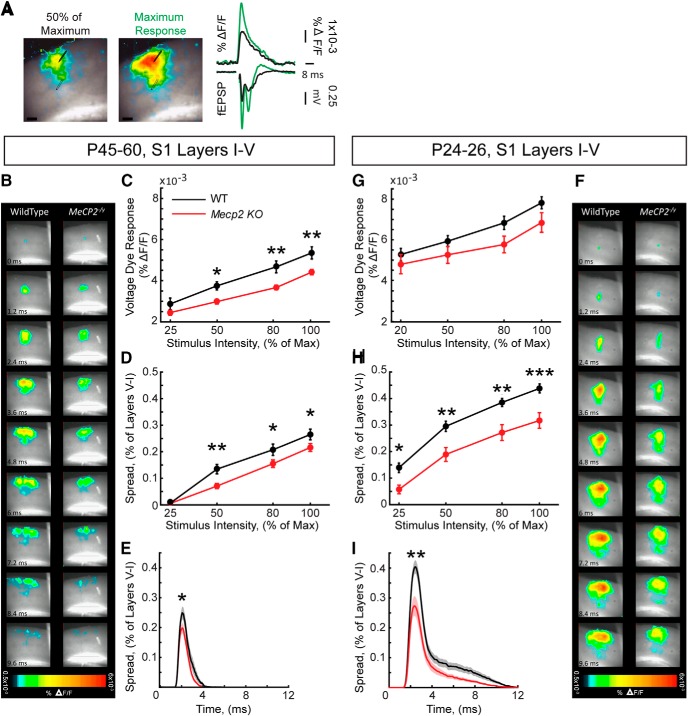
Figure 4.
Smaller amplitude and spatial spread of synaptically induced neuronal depolarizations in layer II/III of S1 cortex in presymptomatic and symptomatic Mecp2 KO mice. A, Representative example (left) of a VSD-stained S1 slice with superimposed evoked VSD signals expressed as ΔF/F, and displayed in a pseudo-color scale (warmer colors represent larger VSD amplitudes). Representative examples (right) of fEPSPs and VSD ΔF/F traces at lower (50% maximum response) and higher (maximum response) stimulation intensities. B, F, Frames of representative time-lapse movies of VSD-stained slices during a single fEPSP in symptomatic (B) and presymptomatic (F) mice. C, G, Input-output relationship between afferent stimulus intensity and the amplitude of VSD signals expressed as % ΔF/F in symptomatic (C) and presymptomatic (G) mice. D, H, Input-output relationship between afferent stimulus intensity and the spatial spread of signal through cortical layers I–V in symptomatic (D) and presymptomatic (H) mice. E, I, Spatio-temporal spread of VSD signals at maximum response stimulation in symptomatic (E) and presymptomatic (I) mice. Solid lines represent the mean; shaded areas represent the standard error of the mean. n = 12 slices from 4 WT mice; n = 24 slices from 6 Mecp2 KO mice at P45-P50; n = 17 slices from 3 WT and Mecp2 KO mice at P24–P26. Two-way ANOVA and Bonferroni posthoc tests for C, D, G, H and t test of area under the curve for E, I. *p < 0.05, **p < 0.01, ***p < 0.001. Scale bars = 100 µm.

