

Abstract
Background: There are substantial differences in long term health outcomes across countries, particularly in terms of both life expectancy at birth (LEAB) and healthy life expectancy (HALE). Socio-economic status, disease prevention approaches, life style and health financing systems all influence long-term health goals such as life expectancy. Within this context, universal health coverage (UHC) is expected to influence life expectancy as a comprehensive health policy. The aim of the study is to investigate this relationship between Universal Health Coverage (UHC) and life expectancy.
Method: A multi-country cross-sectional study was performed drawing on different sources of data (World Health Organization, UNDP-Education and World Bank) from 193 UN member countries, applying administrative record linkage theory. Descriptive statistics, t-tests, Pearson correlations, hierarchical linear regressions were utilized as appropriate.
Result: Global average healthy life years was shown to be 61.34 ± 8.40 and life expectancy at birth was 70.00 ± 9.3. Standardized coefficients from regression analysis found UHC (0.34), child vaccination (Diphtheria Pertussis Tetanus−3: 0.17) and sanitation coverage (0.31) were associated with significantly increased life expectancy at birth. In contrast, population growth was associated with a decrease (0.29). Likewise, unit increases in child vaccination (DPT 3), sanitation and UHC would increase healthy life expectancy considerably (0.18, 0.31, and 0.40 respectively), whereas the same for population growth reduces healthy life expectancy by 0.28.
Conclusion: Universal Health Coverage (UHC) is a comprehensive health system approach that facilitates a wide range of health services and significantly improves the life expectancy at birth and healthy life expectancy. This study suggests that specific programs to achieve UHC should be considered for countries that have not seen sufficient gains in life expectancy as part of the wider push to achieve the Sustainable Development Goal (SDG).
Keywords: universal health coverage, multi-country, life expectancy at birth, healthy life expectancy, record linkage
Introduction
There have been significant gains in life expectancy worldwide, with global life expectancy at birth (LEAB) increasing by 6 years (65–71) since 1990 (World Health Organization, 2014a). However, there is profound disparity in life expectancy between countries and regions (Moser et al., 2005; Vågerö, 2014). Life expectancy at birth for low-income countries is now 62 years, compared to 79 years in high-income countries, and there is a 34 year gap between the lowest country (Lesotho, 50 years) and the highest (Japan, 84 years) (World Health Organization, 2014a). The global variation in healthy life expectancy (HALE), which gauges the status of morbidity and mortality as part of population health (Guest et al., 2006), follows a similar pattern to LEAB.
Many explanatory factors such as per capita income, education, government and private health expenditure, access to safe water, physician ratio, nutritional outcomes, geographical status and urbanization have been found to significantly influence life expectancy (Jakovljevic et al., 2016a), especially in developing countries (Husain, 2002; Kabir, 2008). Higher mortality (infant, child and adult) directly reduces life expectancy. Socio-economic status, disease control approaches, life style and existing health care financing systems are also related to mortality and morbidity (Beltrán-Sánchez and Soneji, 2011; Dieleman et al., 2017; Ranabhat et al., 2017a). Among these factors, both LEAB and HALE are strongly influenced by health interventions and other aspects of social development (Chan and Kamala Devi, 2015). A major reason for the variation between countries is that life expectancy reflects the mortality pattern of a population as well as the overall impact of the health system (Jakovljevic et al., 2017a). An effective health system and policy are able to balance key predictors for both types of life expectancies, such as socio-economic factors and lifestyle patterns (Kabir, 2008; Lin et al., 2012). So, LEAB and HALE reflect the accessibility, quality and overall coverage of a comprehensive range of health care services (Olshansky et al., 2005).
As such, the role of Universal Health Coverage (UHC), which ensures broad population access to promotive, preventive, curative and rehabilitative health services1, is receiving growing attention. UHC is defined as a combination of a legal assurance of health insurance, >90% coverage of health insurance and skilled birth attendance (Stuckler et al., 2010). The first example of universal health coverage that delivered access to basic medical services even to the poorest citizens, was the Soviet Union's famous Semashko system that was established in the early 1930s (Semashko, 1934; McMichael, 1942). The World Health Organization (WHO) has called for all countries to adopt UHC (Carrin et al., 2005). Achieving universal health coverage has also been included as a target in the newly adopted Sustainable Development Goals (SDGs). However, to date, there has been inadequate investigation of its effect on long-term health outcomes (Rancic and Jakovljevic, 2016). There have been some country studies, such as Davis and Huang (2008), who found life expectancy and other health outcomes significantly increased in Taiwan after the adoption of UHC (Davis and Huang, 2008). However, the association between universal health coverage and life expectancy, and strength of the association has not been systematically tested comparatively.
We examine the influences of UHC, utilizing the largest feasible sample of countries. We also address important components such as socioeconomic status, disease prevention coverage, prevalence of youth tobacco use (Olshansky et al., 2005) and alcohol consumption (Ranabhat et al., 2018a) and health financing factors (Jakovljevic et al., 2017b). Moreover, the weight of UHC would be tested on other long-term health outcomes and its importance could be highlighted in order to reduce health inequality within the countries and across the countries. So, the aim of the study is to examine the relation between Universal Health Coverage (UHC) and life expectancy.
Materials and methods
This is a multi-country cross-sectional study of all UN member countries for the period 2010/12.
Research hypothesis model
Previous research explored different factors affecting health outcomes such as life expectancy. Mondal and Shitan (2012) observed the association between socio-economic and demographic factors and life expectancy (Mondal and Shitan, 2012). Likewise, Paasche-Orlow and Wolf (2007) examined the connection with health literacy, finding a positive effect on life expectancy via increased health coverage (Paasche-Orlow and Wolf, 2007). Studies by the WHO (World Health Organization, 2014a) and Moreno-Serra and Smith (2012) indicated that there is an association between universal health insurance and life expectancy (Moreno-Serra and Smith, 2012). Edwards (2011) further clarified that UHC is a comprehensive health policy and assures all types of health care service without financial deficiency (O'Connell et al., 2014). Socio-demographic, disease prevention indicators, life style and health financing components have been found to have some association with life expectancy in separate studies (Jakovljevic et al., 2016b). We updated these models and compiled the necessary components with life expectancies using multiple sources of data. The research hypothesis model based on these previous studies is shown in Figure 1.
Figure 1.

Conceptual model influencing life expectancy with different predictors.
Data base model
Data were compiled based on Record Linkage theory applied by (Dunn, 1946). This approach aims to create new statistics through combining verified data that may have been collected for different purposes. Jutte (2011) applied and refined administrative record linkage as a tool for public health research (Jutte et al., 2011). Our database is derived from combined health data from the World Bank2, youth smoking prevalence and alcohol consumption rates from the WHO (World Health Organization, 2010, 2014a), universal health care coverage from Stuckler et al. (2010), and education status from the UNDP3 Those data are publicly accessible from the respective organizations via their websites.
Data management
From these different sources, we created new data by country for all 193 UN members. Data and outliers were cross-checked and missing data from some countries were excluded from the analysis. After verification and re-verification, the data were exported for analysis with the Statistical Package for the Social Sciences (SPSS)-20 (SPSS I, 2011).
Data analysis model
First, global average results were presented in means and standard deviations. In the second phase, Pearson correlation coefficients were computed. In the third step, multivariate analysis was performed using a hierarchical linear regression model. The data was interpreted by standard beta coefficients and p-values at the significance level of < 0.05.
Selection of variables and description
The independent variables were selected according to the research model, country-wise data availability and policy implication.
The standard definitions of all dependent and independent variables are described below (Table 1).
Table 1.
Description of variables and data sources.
| Variables | Source |
|---|---|
| INDEPENDENT VARIABLES | |
| Combined gross enrollment (CGE) rate (both sexes) is the number of students enrolled in primary, secondary and tertiary levels of education, regardless of age, as a percentage of the population of theoretical school age for the three levels. It is a comprehensive indicator of education. | Human Development Report combined gross enrollment- 20123 |
| Population growth rate (PGR) is the increase in a country's population during a period of time, usually one year, expressed as a percentage of the population at the start of that period. It reflects the number of births and deaths during the period and the number of people migrating to and from a country. | World Bank data base on health 20122 |
| Economic growth rate (EGR) is the sum of average gross value added by all resident producers in the economy plus any product taxes and minus any subsidies not included in the value of the products from 2006 to 2010 in percentage terms. | World Bank database on health 20122 |
| Access to improved sanitation refers to the percentage of the population using improved sanitation facilities. Improved sanitation facilities are likely to ensure hygienic separation of human excreta from human contact. They include flush/pour flush (to piped sewer system, septic tank, and pit latrine), ventilated improved pit (VIP) latrine, pit latrine with slab, and composting toilet. | World Bank database on health 20122 |
| Child immunization measures the percentage of children ages 12–23 months who received vaccinations before 12 months or at any time before the survey. A child is considered adequately immunized against Diphtheria, Pertussis (whooping cough), and Tetanus (DPT) after receiving three doses of vaccine. | World Bank database on health 20122 |
| Youth tobacco prevalence is the mean percentage of boys and girls among that group who smoke any form of tobacco, including cigarettes, cigars, pipes or any other smoked tobacco products. Data includes daily and non-daily or occasional smoking. | WHO report on global tobacco epidemic–2013 (World Health Organization, 2014a) |
| Alcohol consumption ratio is the mean consumption of alcohol in liters by adult males and females within one year. | Global information system on alcohol and health 2010 (World Health Organization, 2010) |
| Out-of-pocket expenditure is any direct outlay by households, including gratuities and in-kind payments, to health practitioners and suppliers of pharmaceuticals, therapeutic appliances, and other goods and services whose primary intent is to contribute to the restoration or enhancement of the health status of individuals or population groups. It is a part of private health expenditure. | World Bank database on health 20122 |
| Total health expenditure is the sum of public and private health expenditure. It covers the provision of health services (preventive and curative), family planning activities, nutrition activities, and emergency aid designated for health but does not include provision of water and sanitation. | World Bank database on health 20122 |
| Public (Government) health expenditure consists of recurrent and capital spending from government (central and local) budgets, external borrowings and grants (including donations from international agencies and nongovernmental organizations), and social (or compulsory) health insurance funds. | World Bank database on health 20122 |
| Universal health care (coverage) means that all people can use the promotive, preventive, curative, rehabilitative and palliative health services they need, of sufficient quality to be effective, while also ensuring that the use of these services does not expose the user to financial hardship. More specifically, it is defined as legislation mandating Universal Health Care, along with >90% health insurance coverage and >90% skilled birth attendance. | Stuckler et al. (2010) |
| DEPENDENT VARIABLES | |
| Life expectancy at birth indicates the number of years a newborn infant would live if prevailing patterns of mortality at the time of its birth were to stay the same throughout its life. | World Bank data base on health 20132 |
| Healthy life expectancy measures the number of remaining years that a person of a certain age is expected to live without disability and it is actually a disability-free life expectancy. | Salomon et al. (2013) |
Structure of variables
All of the above variables are numerical except universal health coverage. Principally, UHC is a combination of 3 indicators: legal obligation of universal health insurance, skilled birth attendance rate and health insurance coverage. Following Stuckler et al. (2010) we applied UHC (yes) = 1 to countries that had achieved these three indicators and UHC (no) = 0 to countries that had not. After making consistent variables, we performed the linear regression models.
Validity and reliability
There are very few questions about the validity and reliability of Word Bank, WHO and UNDP data used in this study. After data entry, we performed more than two rounds of crosschecking to assure the quality. Likewise, the normality of the data was verified by the observation of histograms and consistency of data was checked by Cronbach's alpha in appropriate variables. As UHC is a composite definition, we checked for multicollinearity with other variables. Based on the coefficient output, collinearity statistics obtained a variance inflation factors (VIF) value between 1 and 10, indicating that multicollinearity was not an issue. The ethical approval is not applicable because this study based on secondary sources of data available for open access.
Method of observation
An association with outcome “Y (Y1, Y2) = β1x1 +β2x2 +β3x3 + β4x4 …….…. βnxn+ α
I.e., Outcomes (Y = Y1, Y2) i.e., healthy life expectancy (HALE) and life expectancy at birth (LEAB) = “β1 Socio-demographic variables + β2 disease prevention variables + β3 life style variables + β4 Health financing variables” + α.
Result
Table 2 shows the mean values for all dependent and independent variables. The results reveal that 57 countries out of 194 (29.38%) have already achieved universal health coverage (UHC), and the global average for healthy life expectancy is 61.34 ± 8.40 and life expectancy at birth is 70.00 ± 9.32 in years. There is a 31 year healthy life expectancy gap between the highest ranked country (Singapore, 75 years) which has achieved UHC and the lowest ranked country (Sierra Leone, 44 years) which has yet to achieve UHC. Similarly, there is 35-year gap in life expectancy at birth between the highest LEAB country with UHC (Japan 83 years), and the lowest that has yet to achieve UHC (also Sierra Leone 48 years). On average, life expectancy at birth and healthy life expectancy was significantly higher (p < 0.001) in countries that have achieved UHC (HALE 68.92 ± 4.04 and LEAB 78.07 ± 4.13) than in countries that are yet to achieve UHC (HALE 58.23 ± 7.66 and LEAB 66.77 ± 8.59).
Table 2.
Descriptive results.
| Variables (in years) | Number of countries | Mean ± Std. deviation |
|---|---|---|
| Combined gross enrollment of education (both sexes)–(2012) % | 180 | 95.80 ± 31.08 |
| GDP growth rate by country–(2008-2012) % | 185 | 3.16 ± 3.17 |
| Population growth rate by country–(2012) % | 192 | 1.41 ± 1.33 |
| Sanitation coverage by country in %–(2012) | 188 | 70.59 ± 23.79 |
| Child vaccine coverage (DPT 3) by country–(2012) % | 190 | 89.23 ± 13.05 |
| Adult alcohol consumption /year liter by country–(2010) in liter | 193 | 5.72 ± 4.30 |
| Prevalence of youth tobacco use by country–(2011) % | 132 | 22.07 ± 9.27 |
| Total health expenditure as percent of GDP–(2012) % | 183 | 6.80 ± 2.94 |
| Out of Pocket Payment (OPP) among total expenditure–(2012)% | 185 | 32.08 ± 18.97 |
| Government expenditure in Health in–(2012)% | 186 | 11.63 ± 4.90 |
| Life expectancy at birth by countries–(2012) years | 184 | 70.00 ± 9.32 |
| Healthy life years by country–(2012) years | 179 | 61.34 ± 8.40 |
Cronbach's alpha, 0.692.
A raw correlation matrix was observed among all variables. It shows that healthy life years and life expectancy at birth were positively associated (p < 0.05) with universal health care and child vaccination (DPT 3) coverage and negatively associated with population growth rate and adult alcohol consumption (Table 3).
Table 3.
Raw correlation matrix between all observations.
| S.N. Observations | 2 | 3 | 4 | 5 | 6 | 7 | 8 | 9 | 10 | 11 | 12 | 13 | ||
|---|---|---|---|---|---|---|---|---|---|---|---|---|---|---|
| 1 | CGE-EDU (012) | 1 | ||||||||||||
| 2 | EGR (06- 010) | −0.140 | 1 | |||||||||||
| 3 | PGR (012) | 0.109 | −0.494** | 1 | ||||||||||
| 4 | DPT3 (012) | 0.046 | 0.192* | −0.335** | 1 | |||||||||
| 5 | SAN COV (012) | −0.065 | 0.029 | −0.150* | 0.294** | 1 | ||||||||
| 6 | ALCOHOL CON | −0.213* | −0.282** | 0.349** | −0.146 | −0.021 | 1 | |||||||
| 7 | YOUTH_TOB_P | −0.307** | 0.006 | −0.176 | −0.119 | 0.018 | 0.327** | 1 | ||||||
| 8 | UHC | 0.003 | 0.337** | −0.272** | 0.292** | 0.147* | −0.241** | −0.003 | 1 | |||||
| 9 | OPP (012) | −0.074 | −0.381** | −0.158* | −0.214** | 0.053 | −0.204** | 0.157 | −0.202** | 1 | ||||
| 10 | THE (012) | 0.028 | 0.071 | −0.051 | 0.030 | 0.011 | −0.051 | −0.341** | −0.098 | 0.116 | 1 | |||
| 11 | GHE (012) | 0.003 | 0.245** | −0.273** | 0.205** | 0.101 | −0.128 | −0.190* | 0.240** | −0.598** | −0.101 | 1 | ||
| 12 | Healthy life years (012) | 0.006 | 0.301** | −0.487** | 0.564** | 0.364** | −0.300** | −0.086 | 0.583** | −0.177* | 0.071 | 0.286** | 1 | |
| 13 | Life expectancy (012) | 0.041 | 0.254** | −0.478** | 0.533** | 0.331** | −0.291** | 0.047 | 0.540** | −0.196** | −0.077 | 0.247** | 0.966** | 1 |
Correlation is significant at the 0.05 level (2-tailed).
Correlation is significant at the 0.01 level (2-tailed). CGE-EDU, Combine gross enrollment rate in education; EGR, Economic/GDP growth rate; PGR, Population growth rate; DPT, Diphtheria, Pertussis, Tetanus; SAN COV, Sanitation coverage; ALCOHOL CON, Alcohol consumption; YOUTH_TOB_P, Youth tobacco prevalence; THE, Total health expenditure; OPP, Out-of-pocket payment; GHE, Government health expenditure and UHC, Universal health coverage (yes/no).
The following box (Box 1) shows the multicollinearity status of independent variables with universal health coverage (UHC) because many independent variables would relate to it. As shown, the variance inflation factors (VIF) were less than 3 and well acceptable in terms of collinearity effect.
Box 1. Status of multicollinearity between independent variables with universal health coverage (UHC).
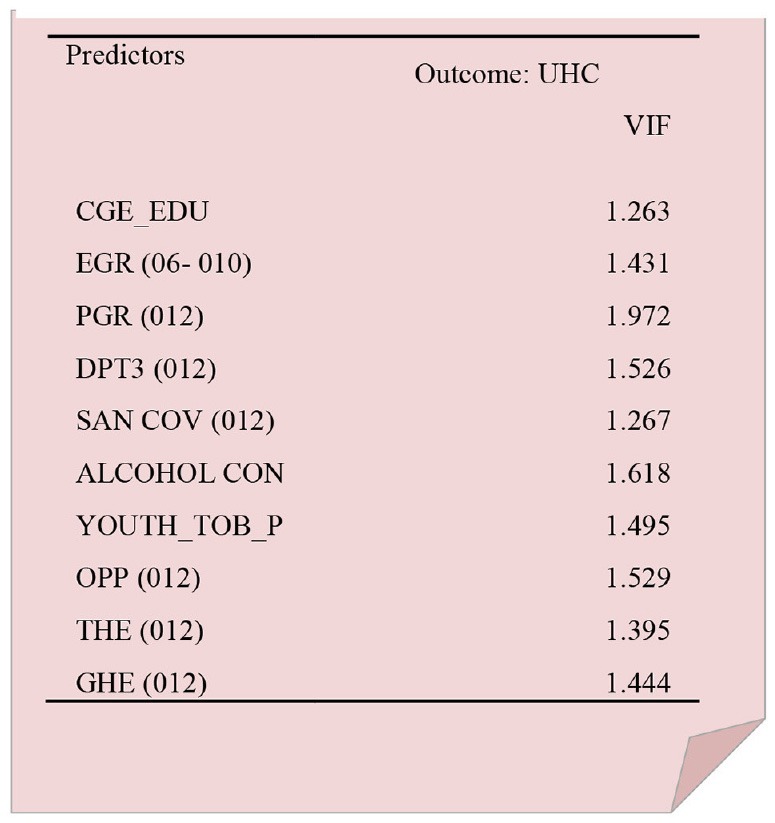
Table 4 shows the association of life expectancy at birth with predictors. The predictors related to social determinants, disease prevention, health behavior and health financing with UHC and life expectancy as outcome for the four models. According to our regression equation model, UHC, sanitation coverage and child vaccination (DPT 3) were associated with significantly increased life expectancy at birth by 0.34, 0.31, and 0.17 (p < 0.05). Likewise, population growth is associated with significantly reduce LEAB by 0.29 (p < 0.05). For each model, UHC had the highest beta coefficient value among the independent variables in the equation.
Table 4.
Regression analysis between predictors and life expectancy at birth.
| Independent variables | Dependent variable (life expectancy at birth) | |||||||
|---|---|---|---|---|---|---|---|---|
| Model 1 | Model 2 | Model 3 | Model 4 | |||||
| Std coff. | P-value | Std coff. | P-value | Std coff. | P-value | Std coff. | P-value | |
| (Constant) | 73.9 | <0.001 | 54.5 | <0.001 | 58.6 | <0.001 | 57.2 | <0.001 |
| SOCIAL DETERMINANTS OF HEALTH | ||||||||
| Combined gross enrollment of education in all age % | 0.110 | 0.107 | 0.028 | 0.198 | 0.038 | 0.697 | 0.04 | 0.571 |
| Economic growth rate % | 0.001 | 0.996 | −0.023 | 0.899 | 0.028 | 0.791 | 0.07 | 0.082 |
| Population growth rate % | −0.381 | <0.001 | −0.322 | 0.001 | −0.301 | 0.003 | −0.29 | 0.021 |
| ACHIEVED UNIVERSAL HEALTH COVERAGE (YES - REFERENCE) | 0.390 | <0.001 | 0.381 | <0.001 | 0.350 | <0.001 | 0.348 | <0.001 |
| DISEASE PREVENTION | ||||||||
| Sanitation coverage in % | 0.330 | <0.001 | 0.227 | 0.004 | 0.311 | 0.002 | ||
| DPT-3 vaccine coverage in % | 0.176 | 0.037 | 0.164 | 0.114 | 0.171 | 0.049 | ||
| HEALTH BEHAVIOR | ||||||||
| Adult alcohol consumption per year per liter | −0.088 | 0.423 | −0.11 | 0.465 | ||||
| Prevalence of youth smoking in % | −0.046 | 0.611 | −0.01 | 0.554 | ||||
| HEALTH FINANCING POLICY | ||||||||
| Percent of OPP on health among total expenditure | −0.10 | 0.071 | ||||||
| Total health expenditure as percent of GDP | 0.02 | 0.711 | ||||||
| Government expenditure in health % | 0.07 | 0.692 | ||||||
| R2 | 0.28 | 0.53 | 0.57 | 0.66 | ||||
| Adjusted R2 | 0.27 | 0.52 | 0.54 | 0.62 | ||||
| p-value | <0.001 | <0.001 | <0.001 | <0.001 | ||||
Discussion
Life expectancy is the average period that an individual may expect to live and healthy life expectancy is the expected years of healthy life within this life expectancy. All age specific deaths—such as neonatal, infant, child, adult mortality and maternal mortality—ultimately reduces life expectancy (Abajobir et al., 2017; Barber et al., 2017). And reducing infant and children mortality is particularly important in raising life expectancy. Life expectancy is influenced by many factors; however, it is not an immediate health outcome. Global average healthy life expectancy and life expectancy at birth were 61 and 70 years respectively, which is the cumulative achievement of health systems and policies after many years. Global LEAB in 1970, 2000, and 2012 were 59, 67, and 70 years (Edwards, 2011). A recent study shows that from 1990 to 2013, LEAB rose by 6.2 (65.3–71.5) years, healthy life years rose by 5.4 (56.9–62.3) (Murray et al., 2015). The application of different data continued to show similar trends. The countries which have achieved UHC have about a 20-year gap, but there is a 34-year gap in average HALE and LEAB for those yet to achieve UHC. This is a huge disparity in life expectancy among those countries (Ranabhat et al., 2017a)4 Life expectancy has been increasing in high income countries that achieved universal health care and reduced risk factors through effective health policy (Nolte and McKee, 2004; Di Cesare et al., 2013; Ogura and Jakovljevic, 2014; Mathers et al., 2015). In our findings, UHC has the greatest influence in LEAB and HALE among other predictors. For example, as shown in the standardized coefficient values in Table 5, a one unit increase in UHC results in a 0.40 rise in HALE. The values for sanitation coverage and child vaccine coverage are somewhat lower (0.31 and 0.18, respectively). On the other hand, one unit of population growth reduces HALE by 0.28 in the full model. The other models show a similar pattern.
Table 5.
Regression analysis between predictors and healthy life expectancy.
| Independent variables | Dependent variable (Healthy life expectancy) | |||||||
|---|---|---|---|---|---|---|---|---|
| Model 1 | Model 2 | Model 3 | Model 4 | |||||
| Std coff. | P-value | Std coff. | P-value | Std coff. | P-value | Std coff. | P-value | |
| (Constant) | 64.2 | <0.001 | 36.5 | <0.001 | 36.0 | <0.001 | 45.4 | <0.001 |
| SOCIAL DETERMINANTS OF HEALTH | ||||||||
| Combined gross enrollment of education in all age % | 0.206 | 0.005 | 0.183 | 0.003 | 0.171 | .019 | 0.04 | 0.562 |
| Economic growth rate % | 0.197 | 0.003 | 0.135 | 0.015 | 0.103 | .100 | 0.01 | 0.601 |
| Population growth rate % | −0.331 | 0.001 | −0.255 | 0.016 | −0.161 | .058 | −0.28 | 0.002 |
| ACHIEVED UNIVERSAL HEALTH COVERAGE (YES - REFERENCE) | 0.430 | <0.001 | 0.420 | <0.001 | 0.418 | <0.001 | 0.407 | <0.001 |
| DISEASE PREVENTION | ||||||||
| Sanitation coverage in % | 0.334 | <0.001 | 0.324 | <0.001 | 0.311 | 0.001 | ||
| DPT-3 vaccine coverage in % | 0.220 | 0.006 | 0.230 | .000 | 0.182 | 0.041 | ||
| HEALTH BEHAVIOR | ||||||||
| Adult alcohol consumption per year per liter | 0.090 | 0.225 | −0.10 | 0.420 | ||||
| Prevalence of youth smoking in % | 0.021 | 0.785 | −0.02 | 0.574 | ||||
| HEALTH FINANCING POLICY | ||||||||
| Percent of OPP on health among total expenditure | −0.18 | 0.045 | ||||||
| Total health expenditure as percent of GDP | 0.01 | .617 | ||||||
| Government expenditure in health % | 0.14 | .081 | ||||||
| R2 | 0.32 | 0.54 | 0.58 | 0.68 | ||||
| Adjusted R2 | 0.28 | 0.51 | 0.56 | 0.64 | ||||
| p-value | <0.001 | <0.001 | <0.001 | <0.001 | ||||
Behind UHC, population growth, sanitation coverage, vaccination coverage, and out-of-pocket expenditure all influenced LEAB and HALE (Ranabhat et al., 2018b). Bloom summarized that vaccination and sanitation coverage decreases morbidity and mortality and increases economic growth (Bloom, 2011). Examples include the human papillomavirus virus vaccine for adolescents in Peru (Goldie et al., 2012) and rotavirus vaccine in India that have reduced mortality and increased life expectancy (Esposito et al., 2011). This is similar to our study, but we failed to find a direct impact for DPT-3 on life expectancy. Out-of-pocket payments deepen the poverty headcount (Tomini et al., 2013) and reduce healthy life years and life expectancy, consistent with our results (Jakovljevic and Getzen, 2016). Among all risk factors, unimproved water and sanitation accounted for 6.8% of disability-adjusted life years (DALYs) in 1990, 3.7% in 2000 and 0.9% in 2010 (Lim et al., 2013). This indicates that public health programs like sanitation and vaccination also affect life expectancy. Generally, a positive economic growth rate should increase health status. However, after UHC achievement, economic growth tended to be faster than usual. For example, after the achievement of UHC in South Korea, the economic growth rate almost doubled (Kwon, 2009). This suggests that economic growth may be a proxy advantage of UHC (Bloom et al., 2004).
Perhaps more useful than a global view is the observation of life expectancy in countries that have and have not yet achieved UHC that are otherwise similar. Salomon compared life expectancy and healthy life expectancy between 1990 and 2010 (Salomon et al., 2013). He found life expectancy and healthy life expectancy trends increased faster for countries with UHC. For example, for the United States, which does not have UHC, life expectancy and healthy life expectancy in 1990 was 72 and 63 years, respectively. After 20 years (2010), it reached 76 and 66 years. This was an increase of only about 3 years. But in the UK, which achieved UHC in the 1950s, the increase was 5 years (LE 73-79 and HALE 63-67). Likewise, two countries yet to achieve UHC, Brazil and China, increased LE and HALE by about 4.5 years. In contrast, South Korea and Ireland (with UHC) (Jakovljevic et al., 2017c), increased their values by more than 6 years in the same time frame. We can also see life expectancy trends in countries before and after achieving UHC5. For example, Finland declared UHC in 1972. In the 10 years prior to UHC, LEAB increased by 3 years (from 68 to 70), but 10 years later it had increased by 5 years (from 70 to 74). Similar trends were observed in Slovenia (Jakovljevic and Laaser, 2015), South Korea, Iceland, Switzerland, Israel and elsewhere. In Thailand, LEAB had increased by 4 years (71–74) after it achieved UHC in 2002, compared to only 2 years (70–71) in the prior decade. China, Brazil, and the US all achieved strong economic growth, but life expectancy did not keep pace with those countries that achieved UHC. UHC can increase life expectancy in two ways. Firstly, disease mortality is reduced by minimizing risk factors through effective public health programs (Dye et al., 2013; World Health Organization, 2014b) and secondly, poverty is not a barrier to treatment if people get sick (Lagomarsino et al., 2012; Savedoff et al., 2012).
Life expectancy and mortality
Life expectancy and all kinds of mortality are outcome indicators; however, they are inversely related to each other. If there is a high mortality among younger age groups, life expectancy will be shorter. Results from a demographic health survey in Bangladesh showed that high infant and child mortality rates result in lower values of life expectancy at birth than at older ages (Rabbi, 2013). Likewise, similar predictors affect life expectancy, infant, child and adult mortality. A study in Nigeria showed that education, household sanitation status and childhood care are associated with child mortality (Ezeh et al., 2015), and a study by Rutstein concluded that fertility, child care situation, socioeconomic status and access to health services were associated with infant and child mortality in developing countries (Rutstein, 2000). Put simply, higher child mortality obliviously reduced life expectancy.
Universal health coverage is not the same across countries with respect to levels of coverage, quality, and access to care; it is a single indicator with 3 components (see above). Nevertheless, as it is defined in this study, UHC has a strong influence on LEAB and HALE (World Health Organization, 1994). Our study highlighted that UHC has greater predictive power for long-term health outcomes than other components like education and economic growth rate (Ranabhat et al., 2017b). However, this study has some limitations, and generalization should be done with caution. Moreover, our data are drawn from different organizations, and the validity and reliability of the data remains a minor concern. Also, the sample size is not ideal from a statistical perspective even though we have used a large volume of data from all available countries. This study represents the first of its kind in terms of this type of analysis. It may not be sufficient to establish a fixed relationship between UHC and life expectancy without additional follow-up investigations. Further study, such as a longitudinal analysis, is recommended.
Conclusion
There are different predictors for life expectancy. Child vaccination, sanitation and UHC all influence HALE and LEAB, with UHC having the greatest influence. Moreover, UHC reduced inequalities in HALE and LEAB. As such, the further adoption of UHC could play a key role in achieving improved global health outcomes. It is able to do this because it is a comprehensive health system approach that enables the provision of various effective health services that improve life expectancy at birth and healthy life expectancy. The current round of the global development agenda, the Sustainable Development Goal (SDGs), provides an excellent opportunity to design and implement specific programs to expand the ranks of countries that have achieved UHC.
Availability of data and materials
The data are readily accessible and freely available from the websites of the respective organizations as described in Table 1.
Author contributions
CR was chiefly responsible for the overall study, from formulating the research concept through to submission of the manuscript. C-BK made contributions to the research model and article composition. JA contributed to the overall article composition. M-BP and MJ reviewed the article and made further improvements.
Conflict of interest statement
The authors declare that the research was conducted in the absence of any commercial or financial relationships that could be construed as a potential conflict of interest.
Glossary
Abbreviations
- LEAB
Life expectancy at birth
- HALE
Healthy life expectancy
- UHC
Universal health coverage
- DPT
Diphtheria pertussis tetanus.
1What is universal health coverage? [http://www.who.int/features/qa/universal_health_coverage/en/].
3Human Development Reports: Combined gross enrollment in education (both sex) % [http://hdr.undp.org/en/content/combined-gross-enrolment-education-both-sexes].
4Rising inequality between countries in adult length of life [http://voxeu.org/article/life-expectancy-around-world?quicktabs_tabbed_recent_articles block=0].
5Data: Life expectancy at birth, total (years) [http://data.worldbank.org/indicator/SP.DYN.LE00.IN].
Funding. This research is supported by Korean Medical Association (RIHP-2015-02) and National Research Foundation of Korea (NRF-2016S1A5B892520).
References
- Abajobir A. A., Abate K. H., Abbafati C., Abbas K. M., Abd-Allah F., Abera S. F., et al. (2017). Global, regional, and national under-5 mortality, adult mortality, age-specific mortality, and life expectancy, 1970–2016: a systematic analysis for the Global Burden of Disease Study 2016. Lancet 390, 1084–1150. 10.1016/S0140-6736(17)31833-0 [DOI] [PMC free article] [PubMed] [Google Scholar]
- Barber R. M., Fullman N., Sorensen R. J., Bollyky T., McKee M., Nolte E., et al. (2017). Healthcare Access and Quality Index based on mortality from causes amenable to personal health care in 195 countries and territories, 1990–2015: a novel analysis from the Global Burden of Disease Study 2015. Lancet 390, 231–266. 10.1016/S0140-6736(17)30818-8 [DOI] [PMC free article] [PubMed] [Google Scholar]
- Beltrán-Sánchez H., Soneji S. (2011). A unifying framework for assessing changes in life expectancy associated with changes in mortality: the case of violent deaths. Theor. Popul. Biol. 80, 38–48. 10.1016/j.tpb.2011.05.002 [DOI] [PMC free article] [PubMed] [Google Scholar]
- Bloom D. E. (2011). The value of vaccination, in Hot Topics in Infection and Immunity in Children VII. Advances in Experimental Medicine and Biology, (Vol. 697, eds Curtis N., Finn A., Pollard A. (New York, NY: Springer; ). [Google Scholar]
- Bloom D. E., Canning D., Sevilla J. (2004). The effect of health on economic growth: a production function approach. World Dev. 32, 1–13. 10.1016/j.worlddev.2003.07.002 [DOI] [Google Scholar]
- Carrin G., James C., Evans D. (2005). Achieving universal health coverage: developing the health financing system. Geneva: World Health Organization. [Google Scholar]
- Chan M. F., Kamala Devi M. (2015). Factors affecting life expectancy: evidence from 1980-2009 data in Singapore, Malaysia, and Thailand. Asia Pacific J. Public Health 27, 136–146. 10.1177/1010539512454163 [DOI] [PubMed] [Google Scholar]
- Davis K., Huang A. T. (2008). Learning from Taiwan: experience with universal health insurance. Ann. Intern. Med. 148, 313–314. 10.7326/0003-4819-148-4-200802190-00011 [DOI] [PubMed] [Google Scholar]
- Di Cesare M., Bennett J. E., Best N., Stevens G. A., Danaei G., Ezzati M. (2013). The contributions of risk factor trends to cardiometabolic mortality decline in 26 industrialized countries. Int. J. Epidemiol. 42, 838–848. 10.1093/ije/dyt063 [DOI] [PubMed] [Google Scholar]
- Dieleman J., Campbell M., Chapin A., Eldrenkamp E., Fan V. Y., Haakenstad A., et al. (2017). Evolution and patterns of global health financing 1995–2014: development assistance for health, and government, prepaid private, and out-of-pocket health spending in 184 countries. Lancet 389, 1981–2004. 10.1016/S0140-6736(17)30874-7 [DOI] [PMC free article] [PubMed] [Google Scholar]
- Dunn H. L. (1946). Record linkage. Am. J. Public Health Nations Health 36, 1412–1416. 10.2105/AJPH.36.12.1412 [DOI] [PMC free article] [PubMed] [Google Scholar]
- Dye C., Reeder J. C., Terry R. F. (2013). Research for Universal Health Coverage. Geneva: World Health Organization. [DOI] [PubMed] [Google Scholar]
- Edwards R. D. (2011). Changes in world inequality in length of life: 1970–2000. Popul. Dev. Rev. 37, 499–528. 10.1111/j.1728-4457.2011.00432.x [DOI] [PubMed] [Google Scholar]
- Esposito D. H., Tate J. E., Kang G., Parashar U. D. (2011). Projected impact and cost-effectiveness of a rotavirus vaccination program in India, 2008. Clin. Infect. Dis. 52, 171–177. 10.1093/cid/ciq094 [DOI] [PubMed] [Google Scholar]
- Ezeh O. K., Agho K. E., Dibley M. J., Hall J. J., Page A. N. (2015). Risk factors for postneonatal, infant, child and under-5 mortality in Nigeria: a pooled cross-sectional analysis. BMJ Open 5:e006779. 10.1136/bmjopen-2014-006779 [DOI] [PMC free article] [PubMed] [Google Scholar]
- Goldie S. J., Levin C., Mosqueira-Lovón N. R., Ortendahl J., Kim J., O'shea M., et al. (2012). Health and economic impact of human papillomavirus 16 and 18 vaccination of preadolescent girls and cervical cancer screening of adult women in Peru. Rev. Panameric. Salud Públic 32, 426–434. Available online at: https://www.scielosp.org/pdf/rpsp/2012.v32n6/426-434/en [PubMed] [Google Scholar]
- Guest C., Ricciardi W., Kawachi I., Lang I. (2006). Oxford Handbook of Public Health Practice. Oxford: Oxford University Press. [Google Scholar]
- Husain A. R. (2002). Life expectancy in developing countries: a cross-section analysis. Bangladesh Dev. Stud. 28, 161–178. Available online at: https://www.jstor.org/stable/i40035939 [Google Scholar]
- Jakovljevic M., Getzen T. E. (2016). Growth of global health spending share in low and middle income countries. Front. Pharmacol. 7:21. 10.3389/fphar.2016.00021 [DOI] [PMC free article] [PubMed] [Google Scholar]
- Jakovljevic M., Groot W., Souliotis K. (2016b). Health care financing and affordability in the emerging global markets. Front. Public Health 4:2. 10.3389/978-2-88919-837-5 [DOI] [PMC free article] [PubMed] [Google Scholar]
- Jakovljevic M., Laaser U. (2015). Population aging from 1950 to 2010 in seventeen transitional countries in the wider region of South Eastern Europe. Available online at: https://papers.ssrn.com/sol3/papers.cfm?abstract_id=2725386
- Jakovljevic M., Potapchik E., Popovich L., Barik D., Getzen T. E. (2017c). Evolving health expenditure landscape of the BRICS nations and projections to 2025. Health Econom. 26, 844–852. 10.1002/hec.3406 [DOI] [PubMed] [Google Scholar]
- Jakovljevic M., Varavikova E. A., Walter H., Wascher A., Pejcic A. V., Lesch O. M. (2017b). Alcohol beverage household expenditure, taxation and government revenues in broader European WHO region. Front. Pharmacol. 8:303. 10.3389/fphar.2017.00303 [DOI] [PMC free article] [PubMed] [Google Scholar]
- Jakovljevic M. B., Vukovic M., Fontanesi J. (2016a). Life expectancy and health expenditure evolution in Eastern Europe—DiD and DEA analysis. Expert Rev. Pharmacoeconom. Outcomes Res. 16, 537–546. 10.1586/14737167.2016.1125293 [DOI] [PubMed] [Google Scholar]
- Jakovljevic M. M, Arsenijevic, J., Pavlova M., Verhaeghe N., Laaser U., Groot W. (2017a). Within the triangle of healthcare legacies: comparing the performance of South-Eastern European health systems. J. Med. Econom. 20, 483–492. 10.1080/13696998.2016.1277228 [DOI] [PubMed] [Google Scholar]
- Jutte D. P., Roos L. L., Brownell M. D. (2011). Administrative record linkage as a tool for public health research. Ann. Rev. Public Health 32, 91–108. 10.1146/annurev-publhealth-031210-100700 [DOI] [PubMed] [Google Scholar]
- Kabir M. (2008). Determinants of life expectancy in developing countries. J. Dev. Areas 41, 185–204. 10.1353/jda.2008.0013 [DOI] [Google Scholar]
- Kwon S. (2009). Thirty years of national health insurance in South Korea: Lessons for achieving universal health care coverage. Health Pol. Plann. 24, 63–71. 10.1093/heapol/czn037 [DOI] [PubMed] [Google Scholar]
- Lagomarsino G., Garabrant A., Adyas A., Muga R., Otoo N. (2012). Moving towards universal health coverage: health insurance reforms in nine developing countries in Africa and Asia. Lancet 380, 933–943. 10.1016/S0140-6736(12)61147-7 [DOI] [PubMed] [Google Scholar]
- Lim S. S., Vos T., Flaxman A. D., Danaei G., Shibuya K., Adair-Rohani H., et al. (2013). A comparative risk assessment of burden of disease and injury attributable to 67 risk factors and risk factor clusters in 21 regions, 1990–2010: a systematic analysis for the Global Burden of Disease Study 2010. Lancet 380, 2224–2260. 10.1016/S0140-6736(12)61766-8 [DOI] [PMC free article] [PubMed] [Google Scholar]
- Lin R.-T., Chen Y.-M., Chien L.-C., Chan C.-C. (2012). Political and social determinants of life expectancy in less developed countries: a longitudinal study. BMC Public Health 12:85 10.1186/1471-2458-12-85 [DOI] [PMC free article] [PubMed] [Google Scholar]
- Mathers C. D., Stevens G. A., Boerma T., White R. A., Tobias M. I. (2015). Causes of international increases in older age life expectancy. Lancet 385, 540–548. 10.1016/S0140-6736(14)60569-9 [DOI] [PubMed] [Google Scholar]
- McMichael J. (1942). Organisation of the medical services in the USSR. Postgraduate Med. J. 18:12 10.1136/pgmj.18.194.12 [DOI] [PMC free article] [PubMed] [Google Scholar]
- Mondal M, N., Shitan M. (2012). Relative importance of demographic, socioeconomic and health factors on life expectancy in low-and lower-middle-income countries. J. Epidemiol. 24, 117–124. 10.2188/jea.JE20130059 [DOI] [PMC free article] [PubMed] [Google Scholar]
- Moreno-Serra R., Smith P. C. (2012). Does progress towards universal health coverage improve population health? Lancet 380, 917–923. 10.1016/S0140-6736(12)61039-3 [DOI] [PubMed] [Google Scholar]
- Moser K., Shkolnikov V., Leon D. A. (2005). World mortality 1950-2000: divergence replaces convergence from the late 1980s. Bull. World Health Organ. 83, 202–209. Available online at: https://www.scielosp.org/pdf/bwho/2005.v83n3/202-209/en [PMC free article] [PubMed] [Google Scholar]
- Murray C. J., Barber R. M., Foreman K. J., Ozgoren A. A., Abd-Allah F., Abera S. F., et al. (2015). Global, regional, and national disability-adjusted life years (DALYs) for 306 diseases and injuries and healthy life expectancy (HALE) for 188 countries, 1990–2013: quantifying the epidemiological transition. Lancet 386, 2145–2191. 10.1016/S0140-6736(15)61340-X [DOI] [PMC free article] [PubMed] [Google Scholar]
- Nolte E., McKee M. (2004). Does Health Care Save Lives? Avoidable Mortality Revisited. Geneva: The Nuffield Trust. [Google Scholar]
- O'Connell T., Rasanathan K., Chopra M. (2014). What does universal health coverage mean? Lancet 383, 277–279. 10.1016/S0140-6736(13)60955-1 [DOI] [PubMed] [Google Scholar]
- Ogura S., Jakovljevic M. (2014). Health financing constrained by population aging-an opportunity to learn from Japanese experience/Finansiranje Zdravstvene Zaštite U Uslovima Starenja Popualcije-Prilika Da Učimo Na Japanskom Iskustvu. Serb. J. Exp. Clin. Res. 15, 175–181. 10.2478/sjecr-2014-0022 [DOI] [Google Scholar]
- Olshansky S. J., Passaro D. J., Hershow R. C., Layden J., Carnes B. A., Brody J., et al. (2005). A potential decline in life expectancy in the United States in the 21st century. N. Engl. J. Med. 352, 1138–1145. 10.1056/NEJMsr043743 [DOI] [PubMed] [Google Scholar]
- Paasche-Orlow M. K., Wolf M. S. (2007). The causal pathways linking health literacy to health outcomes. Am. J. Health Behav. 31(Suppl. 1):S19–S26. 10.5993/AJHB.31.s1.4 [DOI] [PubMed] [Google Scholar]
- Rabbi A. F. (2013). Imbalance in life table: effect of infant mortality on lower life expectancy at birth. J. Sci. Res. 5, 479–488. 10.3329/jsr.v5i3.14105 [DOI] [Google Scholar]
- Ranabhat C. L., Kim C.-B., Park M.-B., Acharaya S. (2017a). Multiple disparities in adult mortality in relation to social and health care perspective: results from different data sources. Global. Health 13:57 10.1186/s12992-017-0283-z [DOI] [PMC free article] [PubMed] [Google Scholar]
- Ranabhat C. L., Kim C.-B., Park M.-B., Bajgai J. (2018a). Impact of spiritual behavior on self-reported illness: a cross-sectional study among women in the Kailali district of Nepal. J. Lifestyle Med. 8:23. 10.15280/jlm.2018.8.1.23 [DOI] [PMC free article] [PubMed] [Google Scholar]
- Ranabhat C. L., Kim C.-B., Singh D. R., Park M. B. (2017b). A comparative study on outcome of government and co-operative community-based health insurance in Nepal. Front. Public Health 5:250. 10.3389/fpubh.2017.00250 [DOI] [PMC free article] [PubMed] [Google Scholar]
- Ranabhat C. L., Park M., Kim C., Kim C., Jeonh H., Koh S., et al. (2018b). Influence of key health related indicators on adult mortality: result from UN member countries. Iran. J. Public Health 47, 794–802. [PMC free article] [PubMed] [Google Scholar]
- Rancic N., Jakovljevic M. M. (2016). Long term health spending alongside population aging in N-11 emerging nations. East Eur. Bus. Econ. J. 2, 2–26. Available online at: http://eebej.eu/2016v2n1/2-26.pdf [Google Scholar]
- Rutstein S. O. (2000). Factors associated with trends in infant and child mortality in developing countries during the 1990s. Bull. World Health Organ. 78, 1256–1270. Available online at: https://www.scielosp.org/pdf/bwho/2000.v78n10/1256-1270/en [PMC free article] [PubMed] [Google Scholar]
- Salomon J. A., Wang H., Freeman M. K., Vos T., Flaxman A. D., Lopez A. D., et al. (2013). Healthy life expectancy for 187 countries, 1990–2010: a systematic analysis for the Global Burden Disease Study 2010. Lancet 380, 2144–2162. 10.1016/S0140-6736(12)61690-0 [DOI] [PubMed] [Google Scholar]
- Savedoff W. D., de Ferranti D., Smith A. L., Fan V. (2012). Political and economic aspects of the transition to universal health coverage. Lancet 380, 924–932. 10.1016/S0140-6736(12)61083-6 [DOI] [PubMed] [Google Scholar]
- Semashko N. A. (1934). Health Protection in the USSR, vol. 2: V. Gollancz, ltd. [Google Scholar]
- SPSS I (2011). IBM SPSS statistics for Windows, version 20.0. New York, NY: IBM Corp. [Google Scholar]
- Stuckler D., Feigl A. B., Basu S., McKee M. (2010). The political economy of universal health coverage, in Background Paper for the Global Symposium on Health Systems Research, Geneva: World Health Organization; Available online at: https://researchonline.lshtm.ac.uk/2157/1/the%20political%20economy%20of%20uhc.PDF [Google Scholar]
- Tomini S. M., Packard T. G., Tomini F. (2013). Catastrophic and impoverishing effects of out-of-pocket payments for health care in Albania: evidence from Albania Living Standards Measurement Surveys 2002, 2005 and 2008. Health Pol. Plan. 28, 419–428. 10.1093/heapol/czs073 [DOI] [PubMed] [Google Scholar]
- Vågerö D. (2014). Health inequalities across the globe demand new global policies [editorial]. Scand. J. Public Health 35, 113–115. 10.1080/14034940701217679 [DOI] [PubMed] [Google Scholar]
- World Health Organization (1994). WHO Statistical Information System (WHOSIS). Geneva: World Health Organization. [Google Scholar]
- World Health Organization (2010). WHO Global Information System on Alcohol and Health (GISAH). Geneva. [Google Scholar]
- World Health Organization (2014a). Global Health Observatory:(GHO). Geneva: World Health Organization. [Google Scholar]
- World Health Organization (2014b). The Global Health Sector Strategy on HIV/AIDS. Geneva: World Health Organization. [Google Scholar]
Associated Data
This section collects any data citations, data availability statements, or supplementary materials included in this article.
Data Availability Statement
The data are readily accessible and freely available from the websites of the respective organizations as described in Table 1.