Abstract
Aim
The aim of your study is to characterize serrated lesions according to their molecular patterns, specifically BRAF/KRAS mutation, methylation, and microsatellite statuses. We evaluated the molecular patterns of 163 serrated lesions, including 37 microvesicular hyperplastic polyps, 73 sessile serrated adenomas/polyps (SSA/Ps), 31 traditional serrated adenomas, and 22 SSA/Ps with cytological dysplasia/adenocarcinoma.
Methods
Mutations in BRAF (V600E)/KRAS (exon 2) and microsatellite status [microsatellite stability (MSS) vs. MSI] were examined using a pyrosequencer and the PCR-based microsatellite method, respectively. DNA methylation status was classified as low (LME), intermediate (IME), or high methylation epigenotype (HME) according to a PCR-based two-step method. In addition, mucin and annexin A10 expression was examined. Finally, we performed a hierarchical clustering analysis of the BRAF/KRAS mutation, DNA methylation, and microsatellite statuses.
Results
The molecular patterns observed in the serrated lesions could be divided into five subgroups: lesions characterized by (1) BRAF mutation, HME, and MSI; (2) BRAF mutation, HME, and MSS; (3) BRAF mutation, LME/IME, and MSS; (4) no BRAF/KRAS mutations, LME/IME, and MSS; and (5) KRAS mutation, LME/IME, and MSS. In addition, we demonstrated that these observed molecular patterns help identify the associations of the molecular patterns and markers (i.e., mucin and annexin A10) with the clinicopathological findings, including histological features and histological diagnosis.
Conclusions
We suggest that the identified molecular patterns play an important role in the pathway of serrated lesion development.
Keywords: BRAF mutation, Cluster analysis, KRAS mutation, Methylation, Microsatellite instability, Serrated lesion
Introduction
Colorectal cancer (CRC) is a heterogeneous disease in terms of the genetic pathways involved [1, 2]. Although the adenoma–carcinoma sequence proposed by Vogelstein et al. [3] has long been considered the single pathway involved in progression to CRC, the serrated CRC pathway, starting from a hyperplastic polyp (HP), which develops into a sessile serrated adenoma/polyp (SSA/P) and subsequently into a specific type of CRC characterized by microsatellite instability (MSI), has been proposed in Western countries [1, 2, 4]. In addition, traditional serrated adenoma (TSA) is considered an important serrated lesion that results from the serrated pathway [4]. A previous study showed two genetic pathways associated with TSA development: the classical and alterative pathways [4]. Although the former is characterized by a high frequency of BRAF mutation, a high CpG island methylator phenotype (CIMP), and microsatellite stability (MSS), the latter is closely associated with a high frequency of KRAS mutation, low CIMP, and MSS [4]. Previously, it was believed that HP is a precursor lesion of SSA/P and TSA [1, 4]. Thus, according to the serrated pathway theory, HP develops into SSA/P or TSA, which then develops into CRC with MSI (major pathway) or MSS (minor pathway) [4–6]; the serrated pathway ultimately results in MSI-high CRC, which accounts for approximately 10% of all CRCs [1, 4]. A recent study showed an alternative pathway in which CRC is derived from a serrated polyp, instead of traditional adenoma, as the precursor lesion [5, 6]. Although detailed molecular findings of the types of serrated lesions, including microvesicular hyperplastic polyp (MVHP), SSA/P, TSA, and SSA/P with cytological dysplasia/adenocarcinoma, have been evaluated extensively, the associations between serrated lesions and the molecular patterns characteristic of serrated lesions with respect to the BRAF/KRAS mutation, methylation, and microsatellite statuses are not fully understood.
Previous studies have identified important markers closely associated with serrated lesions. For example, mucins [7, 8], in particular MUC5AC and MUC6, and annexin A10 [9, 10] are useful markers for differentiating serrated lesions from conventional adenomas. In addition, reduced expression of mismatch repair genes (MLH1 and PMS2) results in MSI-high cancer [4, 5]. These findings suggest that expression of mucin and annexin A10 and low expression of mismatch repair genes play important roles in the development of serrated lesions [7, 9].
In the present study, our aim was to identify the molecular patterns characteristic of serrated lesions based on the BRAF/KRAS mutation, methylation, and microsatellite statuses using hierarchical clustering analysis and to evaluate the associations of the molecular patterns identified from the clustering analysis with markers (mucin and annexin A10) related to the pathogenesis of serrated lesions.
Methods
Patients
Patients who underwent routine pathological diagnosis at Iwate Medical University Hospital and related hospitals between January 2011 and December 2016 were enrolled in this study. Tumor tissue sections were reviewed and diagnosed by a senior gastrointestinal pathologist blinded to the endoscopic findings. The patients’ characteristics, including sex, age, and the size, location, and macroscopic features of the lesions, were extracted from the pathology reports. In addition, the serrated lesions examined were further classified into two groups according to tumor location: left side of the colon, rectum, sigmoid colon and descending colon versus right side of the colon, transverse colon, ascending colon, and cecum. Finally, laterally spreading tumors (LSTs) are generally defined as superficial lesions ≥ 10 mm in diameter that typically extend laterally rather than vertically along the colonic wall.
All patients and controls provided informed consent, and the study protocol was approved by the Clinical Research Ethics Committee of Iwate Medical University. All recruited patients provided written consent for use of their specimens.
Histological Criteria of the Serrated Lesions
The histological diagnosis of SSA/P was performed according to the Japanese Society for Cancer of the Colon and Rectum [11]. In brief, SSA/P was characterized histologically by architectural disturbances in the crypt bases, serrated crypt dilatation, and irregular and asymmetrical branching of serrated crypts. At least two of these three histological findings were required for the histological diagnosis of SSA/P; however, architectural disturbances in the crypt bases were considered the most important histological finding in the present study [11, 12]. The histological definition of a TSA is a lesion with a protuberant, villiform appearance, and villi lined with tall columnar cells with a narrow pencil-like nucleus and eosinophilic cytoplasm (called dysplastic cells). Budding (so-called ectopic crypt foci) is considered the most important finding for the histological diagnosis of TSA [12–15]. MVHP is defined as a tumor exhibiting elongated straight crypts with a narrow crypt base lined with columnar cells displaying varying degrees of serration and nuclear atypia, and the cytoplasm of these cells shows a microvesicular pattern [12].
All patients and controls provided informed consent, and the study protocol was approved by the Clinical Research Ethics Committee of the Iwate Medical University. All specimens were obtained with written consent from the patients.
Immunohistochemistry
Immediately after excision, the specimens were fixed in 10% neutral buffered formalin, embedded in paraffin wax, cut into 3-μm-thick paraffin sections, and stained with hematoxylin and eosin for routine pathological diagnosis. For immunohistochemical staining, additional 3-μm-thick sections were cut from paraffin-embedded tissues and placed on poly-l-lysine-coated glass slides. To evaluate the expression of mucins, annexin A10, and mismatch repair proteins, immunostaining was performed using antibodies against MUC2 (Ccp58, Novocastra Laboratories, Newcastle, UK), MUC6 (CLH5, Novocastra Laboratories), MUC5AC (CLH2, Novocastra Laboratories), annexin A10 (NBP1-90156, Novus, Litteleton, CO, USA), CD10 (56C6, Novocastra Laboratories), hMLH1 (clone G168-15; BD Biosciences, Bedford, MA, USA), and hPMS2 (clone C-20; Santa Cruz Biotechnology, Dallas, TX, USA).
Immunohistochemistry was performed using the DAKO Envision + system, consisting of dextran polymers conjugated with horseradish peroxidase (DAKO), USA. The specimens in citrate buffer (pH 6.0) were heated by microwave at 750 W three times for 5 min each before incubating with the antibodies (H2500, Microwave Processor, Bio-Rad, USA), as described previously. Hematoxylin was used as the counterstain.
Evaluation of Mucins, CD10, and Annexin A10 Expression
In this study, whereas cytoplasmic expression of MUC2, MUC5AC, and MUC6 was regarded as positive immunostaining for these proteins, CD10 immunostaining was considered positive if its expression was found along the brush border of tumor cells. Immunostaining results were regarded as positive if > 10% of the tumor cells were stained and negative if < 10% were stained, in accordance with previous reports [9].
The presence of annexin A10 nuclear staining in > 5% of the tumor area in any tissue section was defined as positive expression of annexin A10, in accordance with a previous report [16].
DNA Extraction
Microdissection of formalin-fixed, paraffin-embedded tissue was performed on hematoxylin-stained slides for both tumor and non-neoplastic mucosae. The tumor and non-neoplastic mucosal components were microdissected separately. In brief, the tissue blocks were scratched at both lateral margin of tumor tissue for marking the surface of the object tissue. Subsequently, histological sections were removed from the histological block (up to 10 µm). We confirmed that the histological sections contained at least 50% tumor tissue. Microdissected tissue was incubated at 56 °C for 12–18 h in 50 µl buffer containing 0.5% Tween-20 (Boehringer Mannheim, Mannheim, Germany), 20 µg proteinase K (Boehringer Mannheim), 50 mmol/l Trizma base, pH 8.9, and 2 mmol/l ethylenediaminetetraacetic acid. Proteinase K was inactivated by incubating the samples at 100 °C for 10 min.
Analysis of MSI
PCR analysis of MSI was performed as described previously [17]. Five different loci were assessed for MSI, including all of those recommended by the Bethesda panel for colon cancer (BAT25, BAT26, D5S346, D2S123, and D17S250). A tumor was defined as MSI-positive when PCR amplification of a specific marker resulted in an abnormal-sized DNA band in the tumor sample compared with the normal sample. MSI-positive CRCs were used as controls in the study and were divided into two groups: those with high-level instability (i.e., MSI at ≥ 20% of loci) and those with low-level instability (i.e., MSI at < 20% of loci), as described previously. Low-level MSI was considered MSS in this study.
DNA Methylation Analysis
Pyrosequencing using the PyroMark Q24 system was performed to assess the DNA methylation status of selected markers. Primer sequences were designed using PyroMark Assay Design 2.0 software (Qiagen, Hulsterweg, NLD). The levels of DNA methylation at six specific promoters, originally described by Yagi et al., were quantified [18, 19]. Methylation at the promoters of three markers (RUNX3, MINT31, and LOX) was analyzed, and those with at least two of these markers methylated were defined as highly methylated epigenotype (HME) tumors. The remaining tumors were screened for methylation at the promoters of three other markers (NEUROG1, ELMO1, and THBD), and those with at least two of these markers methylated were defined as intermediate methylation epigenotype (IME) tumors. Tumors not classified as HME or IME were considered to have the low methylation epigenotype (LME).
Analysis of KRAS and BRAF Mutations
Mutations in the KRAS (exon 2) and BRAF (V600E) genes were examined using the PyroMark Q24 pyrosequencer, as described previously [20]. Each reaction contained 1 × PCR buffer, 1.5 mM MgCl2, 0.2 mM each dNTP, 5 pmol forward primer, 5 pmol reverse primer (biotinylated), 0.8 U HotStarTaq DNA polymerase (Qiagen), 10 ng template DNA, and dH2O to a final volume of 25 μl. Cycling conditions were as follows: 95 °C for 15 min; 38 cycles of 95 °C for 20 s, 53 °C for 30 s, and 72 °C for 20 s; and a final extension at 72 °C for 5 min, with holding at 8 °C. Following amplification, 10 μL biotinylated PCR products were immobilized on streptavidin-coated Sepharose beads (streptavidin Sepharose high performance; GE Healthcare Bio-Sciences Corp., Piscataway, NJ, USA) and washed in 70% EtOH. The purified biotinylated PCR products were loaded into the PyroMark Q24 (Qiagen) using PyroMark Gold reagents (Qiagen) containing 0.3 μM of the sequencing primer and annealing buffer.
Hierarchical Clustering Analysis
Hierarchical clustering analysis was performed to group all samples according to their mutation (BRAF/KRAS), methylation (LME, IME, or HME), and microsatellite (MSI or MSS) statuses, with the goal of achieving maximal homogeneity within each group and the greatest differences among groups. The clustering algorithm used the standard method of centroid linkage clustering.
Statistical Analysis
Differences in the histological features, immunohistochemical findings, and methylation status among the subgroups were analyzed using Chi-square tests in Stat Mate-III (Atom, Tokyo, Japan). If a significant statistical difference among the subgroups was identified, further Chi-square tests between two specific groups were performed. Differences in the age distribution among the groups were evaluated using the Kruskal–Wallis H test in Stat Mate-III. A p value < 0.05 was considered to indicate significance.
Results
Global Features of the Serrated Lesions
A total of 163 individuals who met the inclusion criteria, including 37 with MVHPs, 31 with TSAs, 73 with sessile SSA/Ps, and 22 with SSA/Ps with cytological dysplasia/adenocarcinoma, were enrolled from Iwate Medical University.
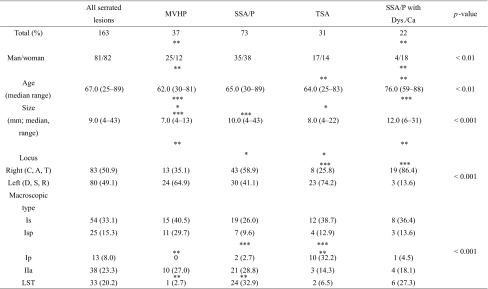
Significant differences were found in the sex ratio between those with MVHP and those with SSA/P with cytological dysplasia (p < 0.01) and in the median age between those with SSA/P and those with MVHP or TSA (p < 0.01). A significant difference in the median tumor size was also seen between the MVHP and SSA/P or SSA/P with cytological dysplasia cases (p < 0.01) and between the MVHP and TSA cases (p < 0.05). The frequency of a right-sided tumor location was significantly higher in the MVHP (13/37) (p < 0.05), SSA/P (43/73) (p < 0.01), and SSA/P with cytological dysplasia (19/22) (p < 0.001) cases than in the TSA (8/31) cases. Finally, regarding macroscopic features, there were significant differences in the frequency of the pedunculated type between TSA (10/31) and MVHP (0/37) or SSA/P (2/73) cases (TSA > MVHP, p < 0.01; TSA > SSA/P, p < 0.001) and in the frequency of the LST type between SSA/P (24/73) and MVHP (1/37) or TSA (2/31) cases (SSA/P > MVHP, p < 0.01; SSA/P > TSA, p < 0.01)). These associations are depicted in Table 1.
Table 1.
Clinicopathological findings in the serrated lesions
*p < 0.05; **p < 0.01; ***p < 0.001
MVHP, hyperplastic polyp microvesicular variant; SSA/P, sessile serrated adenoma/ polyp; TSA, traditional serrated adenoma; C, cecum; A, ascending colon; T, transverse colon; D, descending colon; S, sigmoid colon; R, rectum; LST, laterally spreading tumor; Is, sessile elevated lesion; Isp, semi-pedunculated lesion; Ip, pedunculated lesion; IIa, superficial elevated lesion
Hierarchical Clustering Analysis of the Serrated Lesions
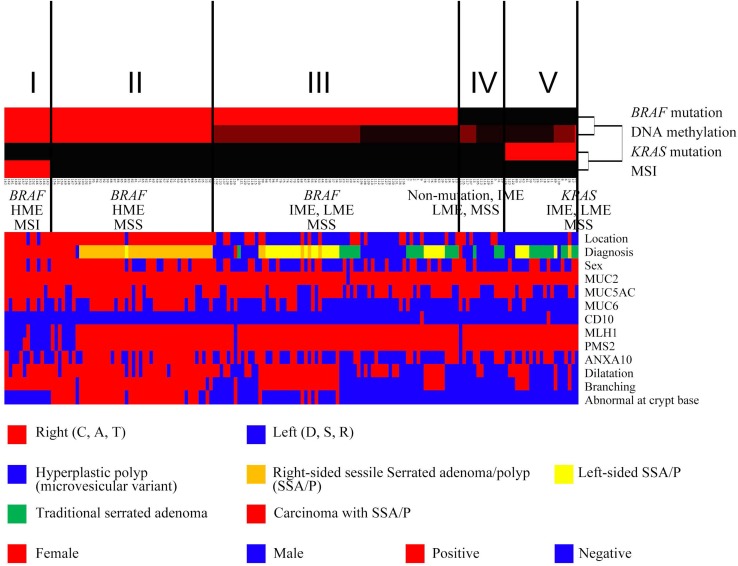
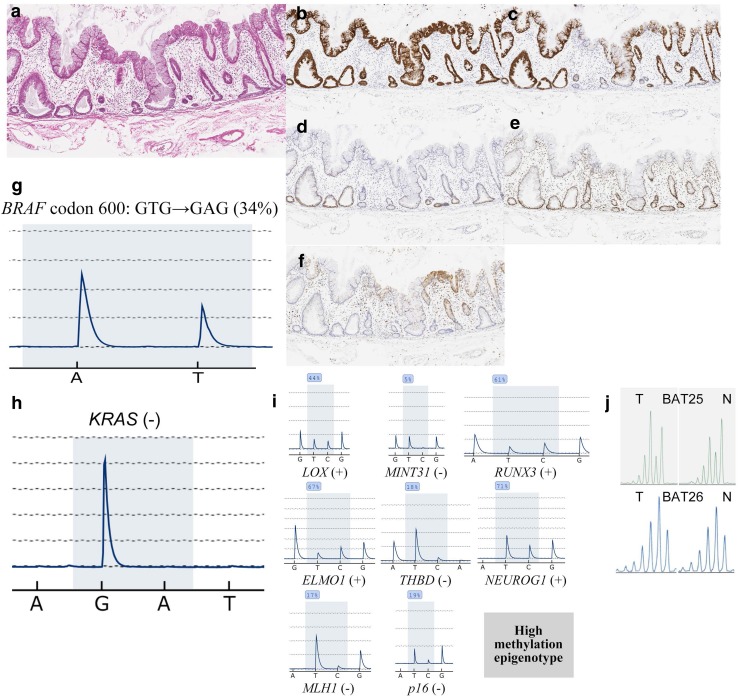
We performed hierarchical clustering analysis according to the mutation (BRAF/KRAS), DNA methylation (LME, IME, or HME), and MSI (MSI or MSS) statuses to evaluate the genetic alterations in patients with serrated lesions. Five distinct subgroups were identified, as shown in Fig. 1. As a result, the serrated lesions examined were classified into five subgroups. Subgroup 1 (13 cases) was characterized by frequent BRAF mutation, HME and MSI, and subgroup 2 (46 cases) by frequent BRAF mutation, HME and MSS. Frequent BRAF mutation, IME/LME and MSS, were characteristic of subgroup 3 (70 cases). Subgroup 4 (13 cases) exhibited no BRAF/KRAS mutations, IME/LME and MSS, and subgroup 5 (21 cases) was characterized by KRAS mutation, IME/LME and MSS. Representative histological and immunohistochemical images are shown in Figs. 2 and 3.
Fig. 1.
Hierarchical analysis of serrated lesions according to the BRAF/KRAS mutation, microsatellite, and methylation statuses. The vertical lines in Fig. 1 denote genetic alterations and the horizontal lines “relatedness” between samples. The serrated lesions examined were classified into five subgroups. The clinicopathological findings, histological findings, and expression of mucins, mismatch repair proteins, and annexin A10 are indicated in the lower half of figure
Fig. 2.
Histological and immunohistochemical staining of left-sided colon tissues. a HE staining. b Positive for MUC2 expression. c Positive for MUC5AC expression. d Negative for MUC2 expression. e Positive for MLH1 expression. f Negative for annexin A10 expression. g Staining for the BRAF mutation in codon 600 (GTG → GAG; 20%). h Negative for KRAS expression. i Methylation panel, intermediate methylation epigenotype. j Microsatellite stability
Fig. 3.
a Histological and immunohistochemical staining of right-sided colon tissues. b Positive for MUC2 expression. c Positive for MUC5AC expression. d Negative for MUC2 expression. e Positive for MLH1 expression. f Positive for annexin A10 expression. g Staining for the BRAF mutation in codon 600 (GTG → GAG; 34%). h Negative for KRAS expression. i Methylation panel, high methylation epigenotype. j Microsatellite stability
Differences in the Clinicopathological Findings Among Subgroups
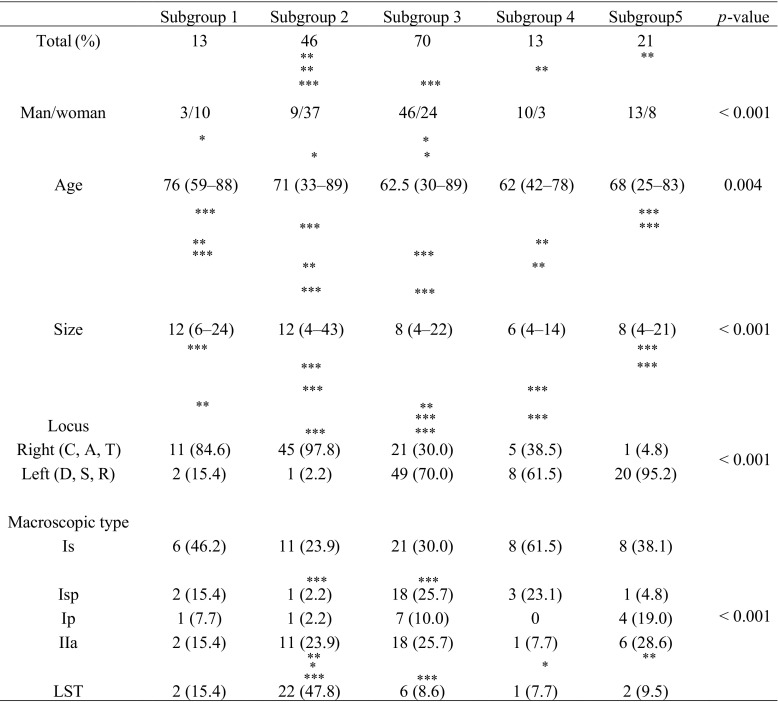
There were significantly more females in subgroup 2 (37/46) than in subgroups 3 (24/70), 4 (3/13), and 5 (8/21) (p < 0.05, p < 0.01, and p < 0.001, respectively) (Table 2). The median age was significantly different between subgroup 3 and subgroup 1 or 2 (subgroup 3 < subgroups 1 and 2) (Table 2; p < 0.05). In addition, significant differences in the median tumor size and the frequency of a right-sided tumor among the subgroups (subgroup 1, 11/13; subgroup 2, 45/46; subgroup 3, 21/70; subgroup 4, 5/13; subgroup 5, 1/21) were found (p < 0.05; p < 0.01; p < 0.001; Table 2).
Table 2.
Clinicopathological findings between each subgroup
*p < 0.05; **p < 0.01; ***p < 0.001
C, cecum; A, ascending colon; T, transverse colon; D, descending colon; S, sigmoid colon; R, rectum; LST, laterally spreading tumor
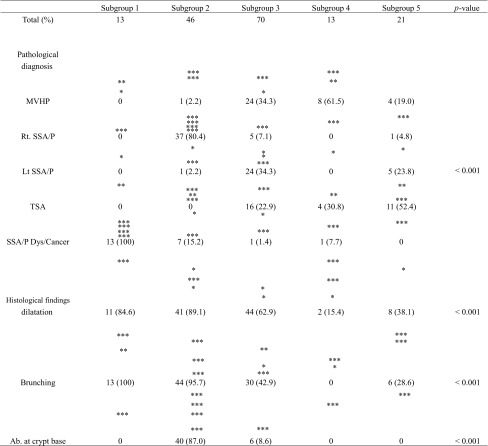
SSA/P with cytological dysplasia/adenocarcinoma was the only lesion subtype associated with subgroup 1 (13/13). Most right-sided SSA/Ps were assigned to subgroup 2 (37/43), while most left-sided SSA/Ps were assigned to subgroup 3 (24/30). TSA was associated primarily with subgroups 3 (16/31) and 5 (11/36). Although the majority of MVHPs belonged to subgroup 3 (24/37), a few were assigned to the other subgroups (13/37).
Although crypt dilatation was commonly found in subgroups 1 (11/13), 2 (41/46) and 3 (44/70), it was infrequent in subgroup 4 (8/21). Crypt branching was frequently observed in subgroups 1 (13/13) and 2 (41/46) but was not observed in subgroup 4 (2/13). Crypt branching was also seen in one-third to one-half of the lesions in subgroups 3 (44/70) and 5 (6/21). Finally, the frequency of crypt dilatation at the crypt base was significantly more frequent in subgroup 2 (40/46) than in all other subgroups (subgroup 1, 0/13; subgroup 3, 6/70; subgroup 4, 0/13; subgroup 5, 0/21). These results are presented in Table 3.
Table 3.
Pathological diagnosis and the histological findings between each subgroup
*p < 0.05; **p < 0.01; ***p < 0.001
MVHP, hyperplastic polyp microvesicular variant; SSA/P, sessile serrated adenoma/ polyp; TSA, traditional serrated adenoma; Ab, abnormality
Expression of MUC2, MUC5AC, MUC6, CD10, Annexin A10, MLH1, and PMS2
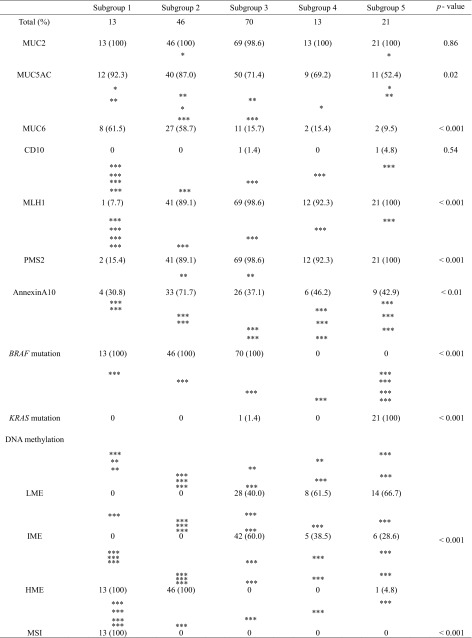
MUC2 expression was frequently observed in each subgroup (subgroup 1, 13/13; subgroup 2, 46/46; subgroup 3, 69/70; subgroup 4, 13/13; subgroup 5, 21/21). There was a significant difference in the frequency of MUC5AC expression between subgroups 2 (40/46) and 5 (11/21) (p < 0.05). Expression of MUC6 was significantly higher in subgroups 1 (8/13) and 2 (27/46) compared with subgroups 3 (11/70), 4 (2/13), and 5 (2/21) (p < 0.05; p < 0.01; p < 0.001; Table 4). Although no CD10 expression was found in subgroup 1 (0/13), 2 (0/46), or 4 (0/13), it was observed, albeit infrequently, in subgroups 3 (1/70) and 5 (1/21) (Table 4). Significant differences in the frequencies of MLH1 and PMS2 expression between subgroup 1 (MLH1, 1/13; PMS2, 2/13) and subgroups 2 (MLH1, 41/46; PMS2, 41/46), 3 (MLH1, 69/70; PMS2, 69/70), 4 (MLH1, 12/13; PMS2, 12/13), and 5 (MLH1, 21/21; PMS2, 21/21) were found (p < 0.001). Annexin A10 expression was significantly higher in subgroup 2 (33/46) than in subgroup 3 (26/70) (p < 0.01).
Table 4.
Molecular findings between each subgroup
*p < 0.05; **p < 0.01; ***p < 0.001
MVHP, hyperplastic polyp microvesicular variant; SSA/P, sessile serrated adenoma/polyp; TSA, traditional serrated adenoma; LME, low methylation epigenotype; IME, intermediate methylation; epigenotype; HME, high methylation epigenotype; MSI, microsatellite instability
Mutations of BRAF and KRAS Genes in the Subgroups
The frequency of BRAF mutation was significantly higher in subgroups 1 (13/13), 2 (46/46), and 3 (70/70) than in subgroups 4 (0/13) and 5 (0/21) (p < 0.001). On the other hand, the frequency of KRAS mutation was significantly higher in subgroup 5 (21/21) than in subgroups 1 (0/13), 2 (0/46), 3 (1/70), and 4 (0/13) (p < 0.001). The results are shown in Table 4.
Analysis of DNA Methylation in the Subgroups
Whereas the frequency of LME was significantly higher in subgroups 3 (28/70), 4 (8/13), and 5 (14/21) compared with subgroups 1 (0/13) and 2 (0/46) (p < 0.01 or 0.001; Table 4), the frequency of HME was significantly higher in subgroups 1 (13/13) and 2 (46/46) than in subgroups 3 (0/70), 4 (0/13), and 5 (1/21) (p < 0.001) (Table 4). In addition, although there were statistical differences in the frequencies of IME between subgroup 2 (0/46) and 3 (42/70), 4 (5/13), and 5 (6/21) (p < 0.001), significant difference in the frequency of IME between subgroup 2 (0/72) and 3 (42/70) was found (p < 0.01; Table 4).
MSI Frequency in the Subgroups
MSI was seen in subgroup 1 (13/13) only, and not in subgroups 2–5. There was a statistical difference in the frequency of MSI between subgroup 1 and subgroups 2–5 (p < 0.001; Table 4).
Discussion
The histological classification of serrated lesions proposed by WHO comprises four types: MVHP, TSA, SSA/P, and SSA/P with cytological dysplasia/adenocarcinoma [12]. These serrated lesions share common molecular findings including BRAF/KRAS mutations, a high genome-wide CIMP status, and MSI caused by silencing of MLH1/PMS2 expression [1, 2, 4]. However, although many researchers have focused on differences in individual molecular markers that are closely associated with serrated lesions, including HPs, SSA/Ps, and TSAs, previous studies have not fully elucidated the association between serrated lesions and molecular patterns (i.e., the combination of BRAF/KRAS mutation, methylation, and microsatellite statuses) using hierarchical clustering, which excludes subjectivity. We examined the associations of the molecular patterns obtained from the hierarchical clustering analysis with serrated lesion subtype and other biological findings (e.g., mucin and annexin A10 expression) typical of serrated lesions.
Previous studies have shown that three distinct histological findings, (1) crypt dilatation, (2) irregular and asymmetrical branching of the crypt, termed “abnormal proliferation,” and (3) basal crypt dilatation and laterally spreading crypt bases, which can result in crypt bases that commonly resemble boots, anvils or Viking ships, are useful for differentiating SSA/P from other serrated lesions including MVHP and TSA [4, 11, 12]. These three histological findings help determine the histological diagnosis of serrated lesions in routine practice [4, 11, 12]. In particular, the findings of basal crypt dilatation and laterally spreading crypt bases are reportedly important for differentiating SSA/P from other serrated lesions [11, 12] and can be used to divide SSA/P into two types: SSA/P with versus SSA/P without basal crypt dilatation and laterally spreading crypt bases. In the present study, basal crypt dilatation and laterally spreading crypt bases were found significantly more frequently in subgroup 2 than in the other subgroups. Furthermore, they were the most useful findings for differentiating subgroup 2 serrated lesions, characterized by frequent BRAF mutation, HME and MSS, from the other subgroup lesions. In addition, whereas most subgroup 2 tumors were right-sided SSA/Ps, subgroup 3 consisted of other serrated lesions, including MVHPs, TSAs, and left-sided SSA/Ps. Although there are common molecular alterations between right- and left-sided SSA/Ps, differences exist in terms of methylation status and annexin A10 expression.
Previous studies have shown that the mucin phenotype plays an important role in gastrointestinal carcinogenesis [21, 22], and gastric mucins are frequently found in serrated lesions [7, 8]. In addition, gastric mucin expression is closely associated with the development of serrated lesions [7, 8]. However, the associations between mucin (as well as CD10) expression and the molecular patterns occurring in serrated lesions have not been well evaluated. In the present study, although the expression of MUC5AC was common in all subgroups, it was significantly more frequent in subgroup 2 than in subgroup 5. In addition, high expression of MUC6 was frequently found in subgroups 1 and 2. These findings showed that, to an extent, MUC5AC expression contributes to the development of serrated lesions and that the expression of MUC6 is closely associated with specific types of molecular alterations (subgroups 1 and 2).
Annexin A10 was suggested to be a candidate marker for the development of SSA/P in previous reports [9, 10, 23, 24]. Recent studies showed that immunohistochemical expression of annexin A10 is useful for differentiating SSA/P from other serrated lesions [23, 24]. In the present study, although the tumors in subgroup 2, characterized by a high BRAF mutation frequency and high methylation, showed frequent expression of annexin A10, this association did not reach statistical significance (except for a significant difference between subgroups 2 and 3). However, there were significant differences in the frequency of Annexin A10 expression in SSA/Ps and TSAs compared with MVHPs (data not shown in the Results section; MVHP: 9/37 [24.3%]; SSA/P: 40/73 [54.8%]; TSA: 21/31 [67.7%]; SSA/P with cytological dysplasia/adenocarcinoma: 8/22 [36.4%]). This difference might explain the difference in methylation status between subgroups 2 (HME) and 3 (IME/LME). Therefore, we suggest that expression of annexin A10 is associated with methylation status, supported by previous reports that CRCs with Annexin A10 expression were associated with CpG island methylator phenotype [25, 26].
In the present study, we classified the molecular patterns of serrated lesions into five subgroups based on the BRAF/KRAS mutation, methylation, and microsatellite statuses. Tumors in subgroup 1 were characterized by BRAF mutation, high methylation, and MSI, and those in subgroup 2 were closely associated with BRAF mutation, high methylation, and MSS. The MSI status of subgroup 1 was supported by the loss of expression of MLH1/PMS2, which were expressed only in subgroup 1. Tumors in subgroup 3 were defined by BRAF mutation, intermediate/low methylation, and MSS. Tumors in subgroup 4 were associated with no BRAF/KRAS mutation, intermediate/low methylation, and MSS. Finally, tumors in subgroup 5 were characterized by KRAS mutation, intermediate/low methylation, and MSS. We suggest that serrated lesions can be classified into five subgroups according to their molecular patterns.
Although there are some limitations in the present study, a clinical benefit was shown by the present study despite the limitations. Although differences were found in clinical parameters such as sex, age, and the size and location of the lesions among the five subgroups in the present study, the clinical benefit of the current results may be unclear. Recent studies have shown that “SSA/P with cytological dysplasia” is very important lesion to identify carcinogenesis of SSA/P that is main precursor lesion of microsatellite instability-high colorectal cancer. In the present study, “SSA/P with cytological dysplasia” was primarily assigned into subgroup 1 that is characterized by BRAF mutation, CIMP and MSI. This suggests that such molecular pattern helps to clarify molecular distinction of “SSA/P with cytological dysplasia.”
In conclusion, we examined molecular alterations in serrated lesions, specifically the BRAF/KRAS mutation, methylation, and microsatellite statuses using hierarchical clustering, which excludes arbitrary analysis. The hierarchical clustering results indicated that serrated lesions can be classified into five subgroups: subgroup 1, characterized by BRAF mutation, HME and MSI; subgroup 2, characterized by BRAF mutation, HME and MSS; subgroup 3, characterized by BRAF mutation, IME/LME and MSS; subgroup 4, characterized by no BRAF/KRAS mutations, IME/LME and MSS; and subgroup 5, characterized by KRAS mutation, IME/LME and MSS. In addition, these molecular patterns identified may help determine the associations between the molecular alterations and clinicopathological findings, including tumor location, histological features, and histological diagnosis, associated with serrated lesions. We suggest that these molecular patterns play an important role in serrated lesion pathways.
Acknowledgments
We gratefully acknowledge the technical assistance of Ms. E. Sugawara. We also thank the members of the Department of Molecular Diagnostic Pathology, Iwate Medical University for their support.
Author’s contribution
TS, who is the first and corresponding author, contributed to the preparation of the manuscript, including all data collection and analyses. ME and YF generated the figures and tables and performed the statistical analysis. HY, TM, and HS provided input during the preparation of the manuscript. EY provided assistance with the experiments involving molecular technologies. KK and KI assisted with the clinical data and experiments. We guarantee that (a) the work is original; (b) the work has not been, and will not be, published in whole or in part in any other journal; and (c) all of the authors have agreed to the content of the manuscript in its submitted form.
Conflict of interest
The authors declare that they have no conflict of interest.
Ethics approval and consent to participate
This study was approved by the Ethical Research Committee of Iwate Medical University.
References
- 1.Jass JR, Whitehall VL, Young J, Leggett B. Emerging concepts in colorectal neoplasia. Gastroenterology. 2002;123:862–876. doi: 10.1053/gast.2002.35392. [DOI] [PubMed] [Google Scholar]
- 2.Ogino S, Goel A. Molecular classification and correlates in colorectal cancer. J Mol Diagn. 2008;10:13–27. doi: 10.2353/jmoldx.2008.070082. [DOI] [PMC free article] [PubMed] [Google Scholar]
- 3.Vogelstein B, Fearon ER, Hamilton SR, et al. Genetic alterations during colorectal tumor development. N Engl J Med. 1988;319:525–532. doi: 10.1056/NEJM198809013190901. [DOI] [PubMed] [Google Scholar]
- 4.Leggett B, Whitehall V. Role of the serrated pathway in colorectal cancer pathogenesis. Gastroenterology. 2010;138:2088–2100. doi: 10.1053/j.gastro.2009.12.066. [DOI] [PubMed] [Google Scholar]
- 5.Yamane L, Scapulatempo-Neto C, Reis RM, Guimarães DP. Serrated pathway in colorectal carcinogenesis. World J Gastroenterol. 2014;20:2634–2640. doi: 10.3748/wjg.v20.i10.2634. [DOI] [PMC free article] [PubMed] [Google Scholar]
- 6.Patai AV, Molnár B, Tulassay Z, Sipos F. Serrated pathway: alternative route to colorectal cancer. World J Gastroenterol. 2013;19:607–615. doi: 10.3748/wjg.v19.i5.607. [DOI] [PMC free article] [PubMed] [Google Scholar]
- 7.Gibson JA, Hahn HP, Shahsafaei A, Odze RD. MUC expression in hyperplastic and serrated colonic polyps: Lack of specificity of MUC6. Am J Surg Pathol. 2011;35:742–749. doi: 10.1097/PAS.0b013e31821537a2. [DOI] [PubMed] [Google Scholar]
- 8.Fujita K, Hirahashi M, Yamamoto H, et al. Mucin core protein expression in serrated polyps of the large intestine. Virchows Arch. 2010;457:443–449. doi: 10.1007/s00428-010-0959-8. [DOI] [PubMed] [Google Scholar]
- 9.Gonzalo DH, Lai KK, Shadrach B, et al. Gene expression profiling of serrated polyps identifies annexin A10 as a marker of a sessile serrated adenoma/polyp. J Pathol. 2013;230:420–429. doi: 10.1002/path.4200. [DOI] [PubMed] [Google Scholar]
- 10.Pai RK, Shadrach BL, Carver P, et al. Immunohistochemistry for annexin A10 can distinguish sporadic from Lynch syndrome-associated microsatellite-unstable colorectal carcinoma. Am J Surg Pathol. 2014;38:518–525. doi: 10.1097/PAS.0000000000000148. [DOI] [PubMed] [Google Scholar]
- 11.Shida Y, Ichikawa K, Fujimori T, et al. Differentiation between sessile serrated adenoma/polyp and non-sessile serrated adenoma/polyp in large hyper plastic polyp: A Japanese collaborative study. Mol Clin Oncol. 2013;1:53–58. doi: 10.3892/mco.2012.20. [DOI] [PMC free article] [PubMed] [Google Scholar]
- 12.Hamilton SR, Bosman FT, Boffetta P, et al. Carcinoma of the Colon and Rectum. WHO Classification of Tumours of the Digestive System. Lyon: International Agency for Research on Cancer; 2010. pp. 134–146. [Google Scholar]
- 13.Chetty R. Traditional serrated adenoma (TSA): morphological questions, queries and quandaries. J Clin Pathol. 2016;69:6–11. doi: 10.1136/jclinpath-2015-203452. [DOI] [PubMed] [Google Scholar]
- 14.Bettington ML, Chetty R. Traditional serrated adenoma: An update. Hum Pathol. 2015;46:933–938. doi: 10.1016/j.humpath.2015.04.002. [DOI] [PubMed] [Google Scholar]
- 15.Bettington ML, Walker NI, Rosty C, et al. A clinicopathological and molecular analysis of 200 traditional serrated adenomas. Mod Pathol. 2015;28:414–427. doi: 10.1038/modpathol.2014.122. [DOI] [PubMed] [Google Scholar]
- 16.Kim JH, Rhee YY, Kim KJ, Cho NY, Lee HS, Kang GH. Annexin A10 expression correlates with serrated pathway features in colorectal carcinoma with microsatellite instability. APMIS. 2014;122:1187–1195. doi: 10.1111/apm.12284. [DOI] [PubMed] [Google Scholar]
- 17.Boland CR, Thibodeau SN, Hamilton SR, et al. A National Cancer Institute workshop on microsatellite instability for cancer detection and familial predisposition: Development of international criteria for the determination of microsatellite instability in colorectal cancer. Cancer Res. 1998;58:5248–5257. [PubMed] [Google Scholar]
- 18.Yagi K, Takahashi H, Akagi K, et al. Intermediate methylation epigenotype and its correlation to KRAS mutation in conventional colorectal adenoma. Am J Pathol. 2012;180:616–625. doi: 10.1016/j.ajpath.2011.10.010. [DOI] [PubMed] [Google Scholar]
- 19.Kaneda A, Yagi K. Two groups of DNA methylation markers to classify colorectal cancer into three epigenotypes. Cancer Sci. 2011;102:18–24. doi: 10.1111/j.1349-7006.2010.01712.x. [DOI] [PubMed] [Google Scholar]
- 20.Yamamoto E, Suzuki H, Yamano HO, et al. Molecular dissection of premalignant colorectal lesions reveals early onset of the CpG island methylator phenotype. Am J Pathol. 2012;181:1847–1861. doi: 10.1016/j.ajpath.2012.08.007. [DOI] [PubMed] [Google Scholar]
- 21.Sugai T, Tsukahara M, Endoh M, et al. Analysis of cell cycle-related proteins in gastric intramucosal differentiated-type cancers based on mucin phenotypes: A novel hypothesis of early gastric carcinogenesis based on mucin phenotype. BMC Gastroenterol. 2010;10:55. doi: 10.1186/1471-230X-10-55. [DOI] [PMC free article] [PubMed] [Google Scholar]
- 22.Sugai T, Sugimoto R, Habano W, et al. Genetic differences stratified by PCR-based microsatellite analysis in gastric intramucosal neoplasia. Gastric Cancer. 2017;20:286–296. doi: 10.1007/s10120-016-0616-2. [DOI] [PubMed] [Google Scholar]
- 23.Bae JM, Kim JH, Rhee YY, Cho NY, Kim TY, Kang GH. Annexin A10 expression in colorectal cancers with emphasis on the serrated neoplasia pathway. World J Gastroenterol. 2015;21:9749–9757. doi: 10.3748/wjg.v21.i33.9749. [DOI] [PMC free article] [PubMed] [Google Scholar]
- 24.Sajanti SA, Väyrynen JP, Sirniö P, et al. Annexin A10 is a marker for the serrated pathway of colorectal carcinoma. Virchows Arch. 2015;466:5–12. doi: 10.1007/s00428-014-1683-6. [DOI] [PubMed] [Google Scholar]
- 25.Bae JM, Kim JH, Rhee YY, Cho NY, Kim TY, Kang GH. Annexin A10 expression in colorectal cancers with emphasis on the serrated neoplasia pathway. World J Gastroenterol. 2015;21:9749–9757. doi: 10.3748/wjg.v21.i33.9749. [DOI] [PMC free article] [PubMed] [Google Scholar]
- 26.Pai RK, Shadrach BL, Carver P, Heald B, Moline J, Church J, Kalady MF, Burke CA, Plesec TP, Lai KK, Gonzalo DH, Pai RK. Immunohistochemistry for annexin A10 can distinguish sporadic from Lynch syndrome-associated microsatellite-unstable colorectal carcinoma. Am J Surg Pathol. 2014;38:518–525. doi: 10.1097/PAS.0000000000000148. [DOI] [PubMed] [Google Scholar]


