Abstract
Digital holographic microscopy is the state of the art quantitative phase imaging of micro-objects including living cells. It is an ideal tool to image and quantify cell thickness profiles with nanometer thickness resolution. Digital holographic techniques usually are implemented using a two-beam setup that may be bulky and may not be field portable. Self-referencing techniques provide compact geometry but suffer from a reduction of the field of view. Here, we discuss the development of a wavefront division digital holographic microscope providing the full field of view with a compact system. The proposed approach uses a wavefront division module consisting of two lenses. The developed microscope is tested experimentally by measuring the physical and mechanical properties of red blood cells.
OCIS codes: (180.0180) Microscopy, (090.1995) Digital holography
1. Introduction
Quantification of morphology of living cells is important from the point of view of their comparison, identification and characterization. Bright filed microscopy has limitations, since it provides only the intensity profile of the object and hence the morphological information is lost [1]. Usually cells have low absorption coefficient in the visible regime and hence produce only low contrast images, making the use of contrast enhancing agents necessary. High contrast images of low absorbing objects can be obtained by recording the phase of the light beam interacting with the object (object beam) as an intensity profile [2-3]. If the phase information of the object beam can be quantified, it leads to quantitative phase imaging, which can provide high contrast object images as well as its morphology [4].
Digital holographic microscopy is the state of the art quantitative phase imaging technique used for quantitative imaging of living cells [4–25]. It is an ideal tool to image and quantify cell thickness profile with nanometer thickness resolution. Digital holographic techniques require the superposition of the beam interacting with the object and a background reference beam and are usually implemented using two beam setup employing Mach-Zehnder interferometer [5–15]. The two beam setup requires many optical elements and precise alignment, which may be bulky and not field portable. Common path techniques which convert a portion of the object beam into a reference wavefront provide a temporally stable setup, while providing the same image quality of Mach-Zehnder configuration [15–22]. But these techniques require specialized optical elements for the creation of reference wavefront. Self-referencing techniques which use a portion of the object beam as the reference use only few optical elements making compact geometries possible [14, 22–25]. But this geometry suffers from reduction of field of view and the reference wave might contain some object information. To overcome these issues, here we describe a wavefront division digital holographic interferometer using two lenses, which provides the full field of view and image quality of Mach-Zehnder microscope, while maintaining the compact structure of self-referencing techniques. The proposed approach uses a wavefront division module consisting of two lenses and does not require any specialized optical component. The developed microscope is tested experimentally by measuring the physical and mechanical properties of red blood cells from their reconstructed thickness profile and its temporal variation.
2. Two lens wavefront division digital holographic microscope (WD-DHM)
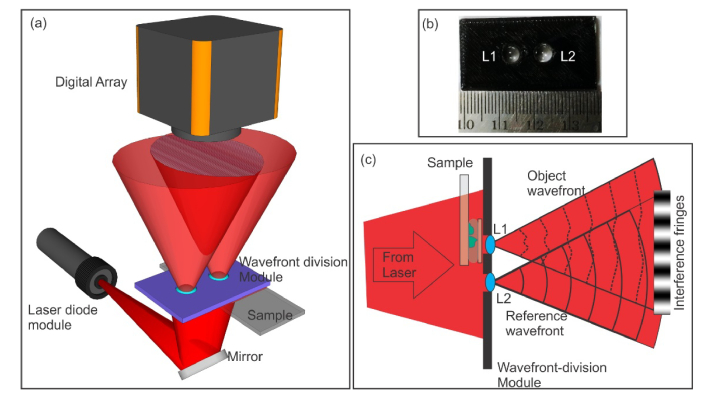
In wavefront division, two coherent sources are generated by dividing the wavefront originating from a common source, by employing mirrors, biprisms or even lenses. This class of interference essentially requires a narrow slit source or a point source. Figure 1a shows the schematic of wavefront division digital holographic microscope (WD-DHM) employed for quantitative phase contrast imaging.
Fig. 1.
(a) Wavefront division digital holographic microscope. (b) Wavefront division module. (c) Conversion of incident laser beam into object and reference wavefronts.
In the present case, two lenses, 6mm in focal length and diameter providing a numerical aperture of approximately 0.4, kept side by side (4mm gap between the lenses) on a platform (3D printed) acts as the wavefront division module (Fig. 1(b)). The expanding beam from a laser diode module (un-collimated) working at 635nm (output power<2mW) trans-illuminates the object. The sample is kept under the lens L1 (Fig. 1(c)), which magnifies the object and the wavefront after lens L1 acts as the object wavefront. The remaining unperturbed portion of the initial expanding wavefront, passes through the second lens L2 and creates a separate reference wavefront of the same curvature as the object wavefront. The object and the reference wavefronts interfere at the imaging sensor generating interference patterns or holograms (Fig. 1(c)). These holograms were recorded by a CCD array (768 × 1024 pixels, monochrome, 8-bit, 4.65μm pixel pitch) kept at the image plane of lens L1, and hence no numerical propagation is needed. At the sensor plane the computed magnification of the system was 32 × . Recorded holograms were numerically reconstructed using angular spectrum propagation diffraction integral [9, 12–15]. For each set of object holograms (holograms recorded with the object in the field of view) a reference hologram (with the medium surrounding the object in the field of view) was recorded. The reconstructed holograms provide the complex amplitude distribution of the object wavefront at the hologram plane. The phase obtained without object in the field of view was subtracted from the phase obtained with the object in the field of view, nullifying phase due to aberrations in the system, bringing out the object quantitative phase image [9, 12–15, 20,21, 25]. This phase difference (Δϕ) is related to the object thickness distribution (h) through the constant average refractive indices of the object (nO) and the surrounding medium (nR) through [12–15]
| (1) |
where λ is the vacuum wavelength of the laser source. If the refractive index of the object and the surrounding medium is unknown Eq. (1) provides the optical thickness distribution.
3. Microscope calibration
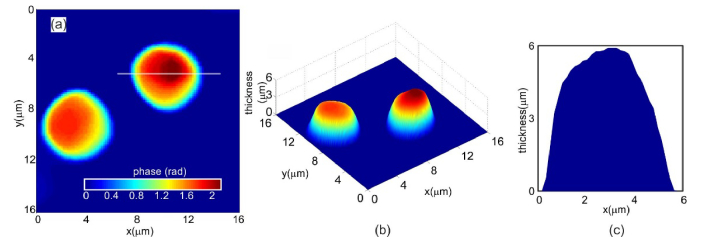
The developed microscope was calibrated by performing a set of experiments on polystyrene microspheres of 6μm diameter (refractive index = 1.56) immersed in microscope oil (refractive index 1.52). Object and reference holograms were recorded for phase comparison. Phase difference obtained after numerical reconstruction and phase subtraction was thresholded by the mean of background phase to reduce noise so as to bring out the object phase information (Fig. 2(a)). This phase can be plugged into Eq. (1) along with the refractive index values of the object and the immersion oil to compute the object thickness profile (polystyrene microspheres) as shown in Fig. 2(b). The cross-sectional thickness profile of the polystyrene sphere is shown in Fig. 2(c). The diameter measured from the phase profile was 5.92 ± 0.41μm which is very close to the manufacturer specified values of 6.0 ± 0.3μm. This indicates that the proposed technique provides accurate thickness reconstruction of transparent phase objects.
Fig. 2.
(a) Quantitative phase image of the polystyrene microspheres obtained after thresholding the phase map. (b) Reconstructed thickness profile of the microsphere obtained by plugging the quantitative phase information shown in Fig. 2(a) into Eq. (1). (c) Cross-sectional thickness profile of the polystyrene microspheres along the line shown in Fig. 2(a).
4. Quantitative imaging of red blood cells
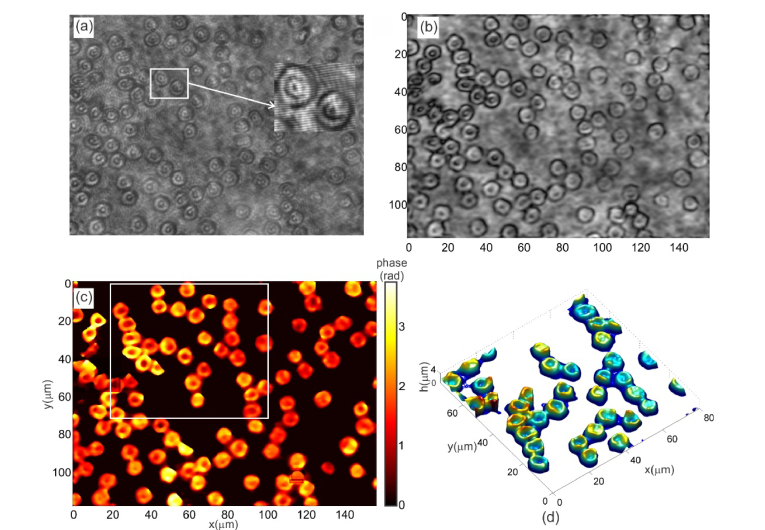
The same microscope was then used for three dimensional imaging of human red blood cells. For this thin blood smears were made on a microscope slide and placed under lens L1 of the microscope. Figure 3(a) shows the recorded hologram in the case of human red blood cells. The region of interest shows the detailed view of the interference fringes. In the case of red blood cells also the reconstruction plane was the hologram plane and hence the reconstructions required just the Fourier analysis of the interference fringes. Figure 3(b) shows the reconstructed intensity pattern of the red blood cells. Quantitative phase image obtained after phase subtraction is shown in Fig. 3(c). This is used to calculate the thickness profile of the cells. The computed thickness profile of the cells using refractive indices of 1.42 for the cell and 1.34 for the plasma [26] is shown in Fig. 3(d), which clearly shows the expected doughnut profile of red blood cells.
Fig. 3.
(a) Recorded hologram of human red blood cells. (b) Reconstructed intensity pattern of the human red blood cells. (c) Quantitative phase image (d). Thickness profile of blood cells inside the region of interest shown in Fig. 3(c).
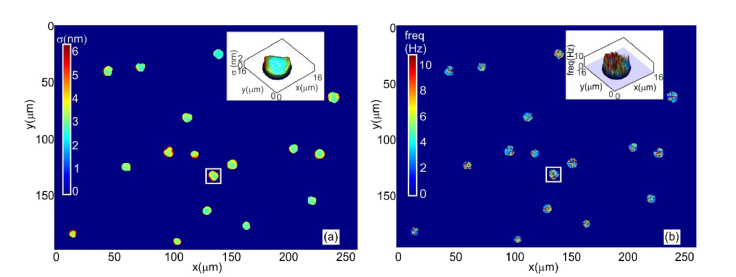
The common path nature of technique makes it temporally stable. This aspect also makes it an attractive tool for imaging and quantification of nanometer level thickness fluctuations of cells. Temporal stability of the microscope was measured by recording a time series of holograms at the rate of 25Hz for 10s, without any sample present in the field of view. The mean of the standard deviation of path length change for 10000 random space points was computed to be 0.68nm. With the sample (a microscope slide) present in the field of view, the value for average of pathlength fluctuation was 0.89nm, which defines the temporal stability of the system. The increase in the pathlength fluctuation is due to the vibrations of the microscope slide. Mechanical parameters (amplitude and frequency of thickness fluctuation) of red blood cells in thin blood smears were measured using the microscope from a time series of holograms. Amplitude (Fig. 4(a)) of thickness fluctuation is found from the standard deviation of the time varying thickness and the peak frequency (Fig. 4(b)) of the cell fluctuation was obtained by Fourier analysis of time varying thickness profile.
Fig. 4.
(a) Thickness fluctuation of red blood cells. (b) Peak frequency of thickness fluctuation. Inset shows three dimensional rendering of the amplitude of thickness fluctuation as well as its frequency for the cell inside the rectangle.
WD-DHM provides a host of cell parameters based on the cell morphology including thickness, diameter, volume, surface area, surface area to volume ratio, sphericity, thickness fluctuation and frequency of thickness fluctuations. These parameters can be used for cell characterization and identification. Reconstructed thickness distributions were used to compute the cell parameters. The cells were automatically identified by thresholding the thickness distribution with mean of the background thickness. Figure 5 shows some of the computed red blood cell parameters. Each distribution is constructed using red blood cells from multiple field of views. A total of 2114 red blood cells were used in the computations and the obtained cell parameter values are close to those reported in literature [7].
Fig. 5.
Computed cell parameter distributions. (a) Mean cell thickness. (b) Cell volume. (c) Surface Area to Volume ratio.
5. Conclusions
The developed technique is compact and does not require any specialized optical component to generate a separate reference wavefront and provides the same image quality and field of view of a more complex Mach-Zehnder interferometer based microscope. One of the advantages of this setup is its common path geometry which provides high temporal stability making it a potential tool to image and quantify cell thickness fluctuations. Since both the lenses in the wavefront division module have the same focal length, curvature matching of object and reference wavefronts occur at the detector plane leading to creation of linear fringe system, which can be easily quantified by Fourier fringe analysis. Similar clear aperture sizes of the two lenses lead to equal light fluxes for object and reference wavefronts providing high contrast fringes. In the case of blood cells, the device can act as a compact hematology analyzer. A compact, low cost, field portable version of the microscope is presently being constructed using laser diode modules, DVD pickup lenses, and webcam arrays. This approach will be used for field trials and remote cell analysis and identification.
Funding
Department of Atomic Energy-Board of Research in Nuclear Sciences (DAE-BRNS) (2013/34/11/BRNS/504); Department of Science and Technology-FIST, UGC-DRS.
Disclosures
The authors declare that there are no conflicts of interest related to this article.
References and links
- 1. Murphy D. B., Fundamentals of Light Microscopy and Electronic Imaging (Wiley-Liss, 2001). [Google Scholar]
- 2.Zernike F., “Phase contrast, a new method for microscopic observation of transparent objects,” Physica 9(7), 686–698 (1942). 10.1016/S0031-8914(42)80035-X [DOI] [Google Scholar]
- 3.Nomarski G., “Microinterférométrie differential et ondes polarizés,” J. Phys. Radium 16, 9–135 (1955). [Google Scholar]
- 4. Ferraro P., Wax A., Zalevsky Z., Coherent Light Microscopy: Imaging and Quantitative Phase Analysis (Springer, 2011). [Google Scholar]
- 5.Marquet P., Rappaz B., Magistretti P. J., Cuche E., Emery Y., Colomb T., Depeursinge C., “Digital holographic microscopy: a noninvasive contrast imaging technique allowing quantitative visualization of living cells with subwavelength axial accuracy,” Opt. Lett. 30(5), 468–470 (2005). 10.1364/OL.30.000468 [DOI] [PubMed] [Google Scholar]
- 6.Dubois F., Yourassowsky C., Monnom O., Legros J. C., Debeir O., Van Ham P., Kiss R., Decaestecker C., “Digital holographic microscopy for the three-dimensional dynamic analysis of in vitro cancer cell migration,” J. Biomed. Opt. 11(5), 054032 (2006). 10.1117/1.2357174 [DOI] [PubMed] [Google Scholar]
- 7.Rappaz B., Barbul A., Emery Y., Korenstein R., Depeursinge C., Magistretti P. J., Marquet P., “Comparative study of human erythrocytes by digital holographic microscopy, confocal microscopy, and impedance volume analyzer,” Cytometry A 73(10), 895–903 (2008). 10.1002/cyto.a.20605 [DOI] [PubMed] [Google Scholar]
- 8.Rappaz B., Cano E., Colomb T., Kühn J., Depeursinge C., Simanis V., Magistretti P. J., Marquet P., “Noninvasive characterization of the fission yeast cell cycle by monitoring dry mass with digital holographic microscopy,” J. Biomed. Opt. 14(3), 034049 (2009). 10.1117/1.3147385 [DOI] [PubMed] [Google Scholar]
- 9.Anand A., Chhaniwal V., Javidi B., “Real-time digital holographic microscopy for phase contrast 3D imaging of dynamic phenomena,” IEEE J. Disp. Technol. 6(10), 500–505 (2010). 10.1109/JDT.2010.2052020 [DOI] [Google Scholar]
- 10.Kemper B., Bauwens A., Vollmer A., Ketelhut S., Langehanenberg P., Müthing J., Karch H., von Bally G., “Label-free quantitative cell division monitoring of endothelial cells by digital holographic microscopy,” J. Biomed. Opt. 15(3), 036009 (2010). 10.1117/1.3431712 [DOI] [PubMed] [Google Scholar]
- 11.Memmolo P., Di Caprio G., Distante C., Paturzo M., Puglisi R., Balduzzi D., Galli A., Coppola G., Ferraro P., “Identification of bovine sperm head for morphometry analysis in quantitative phase-contrast holographic microscopy,” Opt. Express 19(23), 23215–23226 (2011). 10.1364/OE.19.023215 [DOI] [PubMed] [Google Scholar]
- 12.Anand A., Chhaniwal V. K., Patel N., Javidi B., “Automatic identification of malaria infected RBC with digital holographic microscopy using correlation algorithms,” IEEE Photonics J. 4(5), 1456–1464 (2012). 10.1109/JPHOT.2012.2210199 [DOI] [Google Scholar]
- 13.Rappaz B., Moon I., Yi F., Javidi B., Marquet P., Turcatti G., “Automated multi-parameter measurement of cardiomyocytes dynamics with digital holographic microscopy,” Opt. Express 23(10), 13333–13347 (2015). 10.1364/OE.23.013333 [DOI] [PubMed] [Google Scholar]
- 14.Anand A., Moon I., Javidi B., “Automated Disease Identification with 3D Optical Imaging: a medical diagnostic tool,” Proc. IEEE 105(5), 924–946 (2017). 10.1109/JPROC.2016.2636238 [DOI] [Google Scholar]
- 15.Anand A., Chhaniwal V. K., Javidi B., “Imaging embryonic stem cell dynamics using quantitative 3D digital holographic microscopy,” IEEE Photonics J. 3(3), 546–554 (2011). 10.1109/JPHOT.2011.2158637 [DOI] [Google Scholar]
- 16.Popescu G., Badizadegan A. K., Dasari R. R., Feld M. S., “Observation of dynamic subdomains in red blood cells,” J. Biomed. Opt. 11, 040503 (2006). [DOI] [PubMed] [Google Scholar]
- 17.Shaked N. T., Satterwhite L. L., Bursac N., Wax A., “Whole-cell-analysis of live cardiomyocytes using wide-field interferometric phase microscopy,” Biomed. Opt. Express 1(2), 706–719 (2010). 10.1364/BOE.1.000706 [DOI] [PMC free article] [PubMed] [Google Scholar]
- 18.Mir M., Tangella K., Popescu G., “Blood testing at the single cell level using quantitative phase and amplitude microscopy,” Biomed. Opt. Express 2(12), 3259–3266 (2011). 10.1364/BOE.2.003259 [DOI] [PMC free article] [PubMed] [Google Scholar]
- 19.Shaked N. T., “Quantitative phase microscopy of biological samples using a portable interferometer,” Opt. Lett. 37(11), 2016–2018 (2012). 10.1364/OL.37.002016 [DOI] [PubMed] [Google Scholar]
- 20.Anand A., Faridian A., Chhaniwal V. K., Mahajan S., Trivedi V., Dubey S. K., Pedrini G., Osten W., Javidi B., “Single Beam Fourier Transform Digital Holographic Quantitative Phase Microscopy,” Appl. Phys. Lett. 104(10), 103705 (2014). 10.1063/1.4868533 [DOI] [Google Scholar]
- 21.Vora P., Trivedi V., Mahajan S., Patel N., Joglekar M., Chhaniwal V., Moradi A. R., Javidi B., Anand A., “Wide field of view common-path lateral-shearing digital holographic interference microscope,” J. Biomed. Opt. 22(12), 1–11 (2017). [DOI] [PubMed] [Google Scholar]
- 22.Bianco V., Mandracchia B., Marchesano V., Pagliarulo V., Olivieri F., Coppola S., Paturzo M., Ferraro P., “Endowing a plain fluidic chip with micro-optics: a holographic microscope slide,” Light Sci. Appl. 6(9), e17055 (2017). 10.1038/lsa.2017.55 [DOI] [PMC free article] [PubMed] [Google Scholar]
- 23.Coppola G., Di Caprio G., Gioffré M., Puglisi R., Balduzzi D., Galli A., Miccio L., Paturzo M., Grilli S., Finizio A., Ferraro P., “Digital self-referencing quantitative phase microscopy by wavefront folding in holographic image reconstruction,” Opt. Lett. 35(20), 3390–3392 (2010). 10.1364/OL.35.003390 [DOI] [PubMed] [Google Scholar]
- 24.Kemper B., Vollmer A., Rommel C. E., Schnekenburger J., von Bally G., “Simplified approach for quantitative digital holographic phase contrast imaging of living cells,” J. Biomed. Opt. 16(2), 026014 (2011). 10.1117/1.3540674 [DOI] [PubMed] [Google Scholar]
- 25.Singh A. S., Anand A., Leitgeb R. A., Javidi B., “Lateral shearing digital holographic imaging of small biological specimens,” Opt. Express 20(21), 23617–23622 (2012). 10.1364/OE.20.023617 [DOI] [PubMed] [Google Scholar]
- 26.Hammer M., Schweitzer D., Michel B., Thamm E., Kolb A., “Single scattering by red blood cells,” Appl. Opt. 37(31), 7410–7418 (1998). 10.1364/AO.37.007410 [DOI] [PubMed] [Google Scholar]


