Abstract
Background:
Diabetes is a chronic condition that requires constant self-management. As a consequence, several software platforms have been developed to facilitate the tracking of diabetes data to improve diabetes management. Our aim was to determine the real-world glycemic benefits of a mobile diabetes management platform used by individuals with type 1 and type 2 diabetes.
Methods:
Mobile platform-using (n = 899) and control (n = 900) participants meeting specific minimum data criteria were randomly selected from a database of diabetes users. All results were modeled using different mixed effect generalized linear models, assigning random intercepts for each user, and adjusting the distribution assumption for each outcome.
Results:
Users of the mobile platform increased their frequency of blood glucose monitoring (+8.8 tests per month, 95% CI [3.4, 14.1], P < .001) and had fewer hyperglycemic events and lower average glucose levels compared to the control group. In addition, a mobile user could expect a 3.5% drop in average BG (−6.4 mg/dL, 95% CI [−2.0, −10.7], P < .001) and a 10.7% decrease in hyperglycemia (P < .001) after 2 months.
Conclusion:
Users of the mobile platform tested their BG more often and demonstrated greater improvement in blood glucose compared to users who did not use the mobile platform. This supports previous studies indicating that digital technologies can enhance diabetes care in a real-world setting.
Keywords: average blood glucose, blood glucose, blood glucose meter, hyperglycemia, mobile app for diabetes, self-monitoring of blood glucose, mobile health
Diabetes is a chronic disease currently affecting 11.9% of the US population.1 In the United States and elsewhere a substantial portion of individuals living with diabetes are managed by primary care teams, with office visits averaging 15 minutes twice a year; therefore individuals are essentially on their own for the rest of the time.2 Because of this enormous gap between visits, diabetes care is primarily dependent on personal self-management, which, if not performed well can lead to the risk of premature death, blindness, amputation, and kidney failure.3 In reality diabetes self-management is neither easy nor simple and requires time as well as numeracy and literacy skills.4
As a consequence of the growing personal, societal and health economic burden of diabetes, several software platforms have been developed to support self-management of the condition. There are already more than 165 000 health-related apps available for download, but few diabetes-focused apps have been either cleared by the FDA or have supporting data described in the medical literature.5 In type 2 diabetes there is some evidence that mobile phone applications can be used as an “adjunctive intervention” with the reported expected reduction of HBA1c of 0.5%.6
The Glooko Mobile App (Mountain View, CA) is capable of automatically downloading data from more than 50 commercially available blood glucose (BG) meters after a user initiates an upload. The Glooko Mobile App has received FDA clearance (510(k) Premarket Notification). In addition, it offers a personalized digital logbook and displays data through customizable graphs. This data display allows users to easily view their glucose readings, meals, and medications, while receiving feedback on their progress (examples of the display are available as supplemental material). This has particular relevance, as a recent meta-analysis found that the presentation of data through a mobile application can be used to improve glycemic control.7
For this study we hypothesized that access to a structured data display using the mobile app would improve glycemic outcomes (ie, average BG, hypoglycemic, hyperglycemic, and in-range BG readings) more than simply uploading data to the office of a health care provider (HCP). For this we compared users of the mobile application to a control group who uploaded their data in an HCP’s office, but did not have the accompanying mobile app. Both groups received usual care as offered by their HCPs.
Methods
This research was considered exempt from IRB review because it utilized only aggregate metrics from the Glooko server. No study team member had access to any data containing any of the 18 HIPAA identifiers. As part of a terms of service agreement, users consent to share their data and have their data analyzed in a deidentified, aggregate form for research purposes.
For this retrospective study, we collected data from the database (Figure 1). From a total of 184,120 accounts we selected participants who had successfully uploaded their data at least twice between January 2011 and March 2017. A breakdown of the final sample’s age, gender, and diabetes type is available in Table 1. We required that each participant had at least 90 days (ie, approximately 3 months) of data prior to their initial upload. This was defined as a user actively testing their BG across a time period of at least 75 days within an overall 90-day period. A maximum of 90 days were included in the baseline measurement. A visual illustration of the relationship between uploads and back data can be found in Figure 2.
Figure 1.
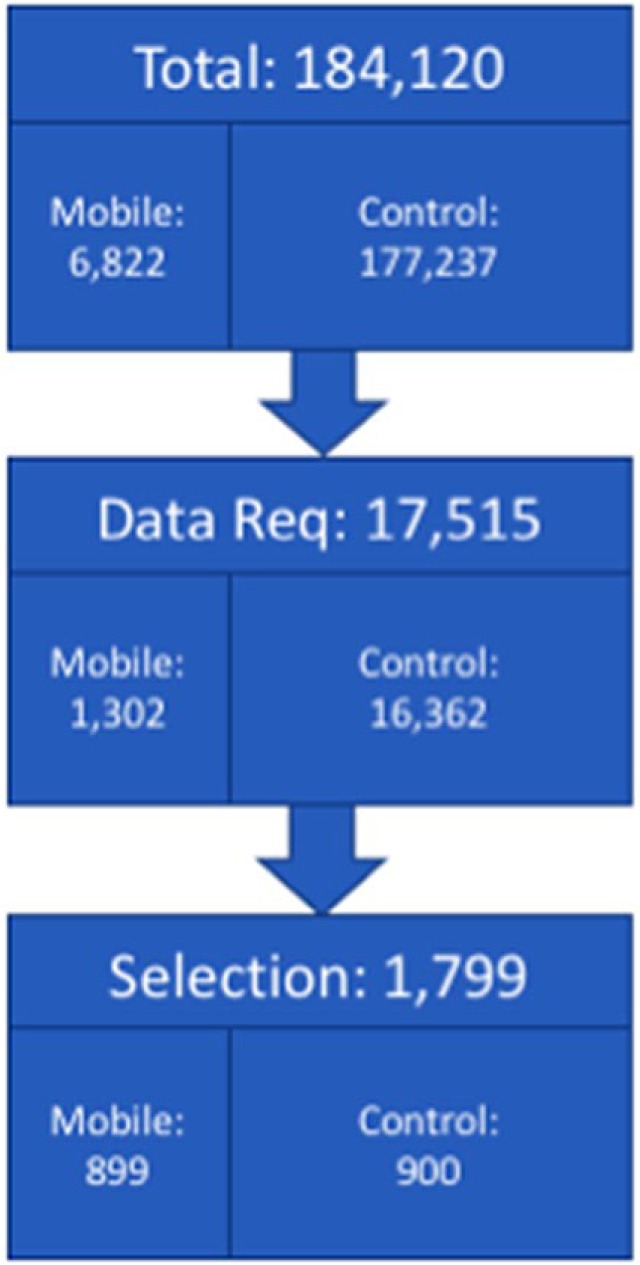
Selection of users eligible for current study. The Total number refers to is all users at time of analysis (not including Diasend users). The Data Req number refers to the number of users who met the data requirements (detailed in the methods section) for the study. The Selection number refers to the number of users who were randomly selected for the study. Note that the mobile group includes 899 because a test user was originally randomized into the study and subsequently excluded from any analyses.
Table 1.
Study sample demographics.
| Control | Mobile | ||
|---|---|---|---|
| Agea | Mean ± SD | 57.0 ± 20.5 | 49.0 ± 19.3 |
| Valid n | 900 | 759 | |
| Gender | Male | 0 | 440 |
| Female | 2 | 171 | |
| Unknownb | 898 | 288 | |
| Diabetes type | Type 1 | 3 | 375 |
| Type 2 | 15 | 285 | |
| Other | 0 | 22 | |
| Unknownb | 882 | 285 | |
| Total n | 900 | 899 |
Notably, date of birth was a required field when creating a patient profile for the control group.
Unknown values occur when users or clinicians decline to provide data, or are not presented with the option of filling in their profile. Because data from the control group were typically uploaded by a health care provider, the reporting of demographic information was often not prioritized.
Figure 2.
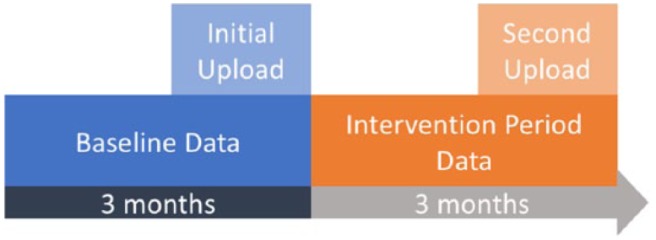
Illustration of the relationship between uploads and data. Every patient included in this study had initiated an initial upload (light blue), which allowed us to collect data before they had started using the mobile app or control (dark blue). Every patient had also initiated a second upload (light orange) and allowed us to collect data after their use of the mobile app or control (dark orange).
Although we required each participant to have self-monitoring blood glucose (SMBG) data on the third month after their initial upload, we analyzed data from only 2 months. Using a 90-day data inclusion criterion allowed us to avoid biasing the sample set against infrequent testers (ie, users who failed to take any SMBG measurements during their first or second months). If we had required only a 60-day data inclusion criterion, then any user who failed to test in the first or second month would have been excluded from the study. We also removed individuals who had meter readings occurring after their upload time (ie, in the future; typically caused by improperly calibrated meter times).
Groups
We defined the mobile group as any user of the mobile app. This contains a digital logbook, user-initiated SMBG data capture, and graphical displays of the collected glucose data. Mobile users also have access to the full range of features, including the ability to view stored BG data in graphical format, the ability to complement glucose data with personal information about food intake, medications, and exercise, and the ability to set reminders for themselves to support their care plan.
For comparison purposes the control group was defined as any individual not using the mobile app, who uploaded their data at their HCP’s office using an office uploading device as part of usual clinical care. Although these data were still accessible to the user, they were not as available as within the mobile app. Because the control group uploaded their data at a provider’s office, we were able to assume they received clinical care based on their uploaded data during their office visit.
Outcomes and Statistical Modeling
Because this was a retrospective cohort design, we randomly selected mobile and control users from our database using the numpy.random (https://docs.scipy.org/doc/numpy/reference/routines.random.html) package in Python version 2.7.10, once they met the inclusion criteria outlined above. A sample of 900 per group was chosen to ensure the study had adequate power. Random selection within the mobile group was used to decrease bias due to our sample of convenience, while random selection within the control group was used to avoid an overpowered sample.
For each dependent variable, we used a mixed effects generalized linear model (GLM), considering users as a random effect and time as a linear fixed effect. We adjusted the distribution assumptions for each dependent variable.
Monthly testing rate was modeled using a quasipoisson distribution, which was chosen because test rate was a count variable. Testing rate was analyzed as number of BG tests per month and change in testing rate was reported using an incidence rate ratio (IRR). The IRR allows us to report the percentage change in the monthly count of SMBG testing events.
Average BG was modeled using a Gaussian distribution with a log link. The log link accounted for greater variance in the right tail of BG values to a greater degree than the identity link. BG was analyzed and presented in the format of mg/dL. Change in means was reported as a percentage difference, based on exponentiated coefficients.
All glycemic events (ie, hypoglycemia, hyperglycemia, and in-range readings) were preprocessed into the individualized monthly probability of a glycemic event. Probability of a glycemic event was modeled using a binomial distribution, making these analyses equivalent to a Beta regression. This probability was weighted by the number of SMBG observations, which allowed us to account for variations in user measurements.
A hypoglycemic event was defined as a BG measurement below 70 mg/dL; a hyperglycemic event was defined as a BG measurement above 200 mg/dL. An in-range event was defined as a BG measurement between 70 and 200 mg/dL.
In addition, we explored the relationship between change in testing rate, glycemic events, and average BG using Spearman’s ρ (rho), a nonparametric indicator of correlation.
While a detailed analysis of potential gender differences in glycemia outcomes is beyond the scope of the current study, we also leveraged the limited amount of available self-reported demographic data from our mobile group users to glean insights into gender differences in post hoc exploratory analyses.
Results
Testing Rate
Users in the mobile group started with a 15.3% higher monthly testing rate compared to the control group (mean diff = 7.5 tests per month, 95% CI [3.0, 12.0], P < .001). Over time, control group testing rates were unchanged (P = .055), whereas the mobile group testing rate significantly increased by 7.9% per month (P < .001) (Figure 3). Overall, a mobile user exhibited a 16.3% higher testing rate, after 2 months, compared to the control group. This translated to a mean increase of 8.8 tests per month, 95% CI [3.4, 14.1], after 2 months of using the mobile app.
Figure 3.
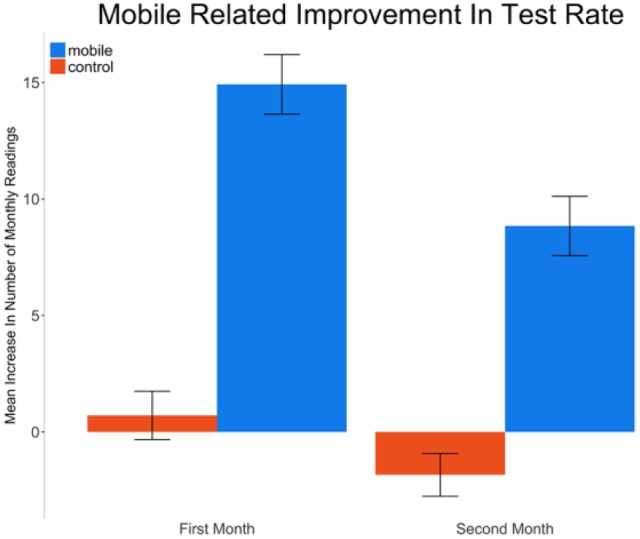
Mean (standard error) increase in monthly SMBG test rate compared to baseline for the control and mobile groups.
Achieved Blood Glucose Levels
Before the start of the study, users in the mobile group demonstrated 4.6% lower modeled average BG compared to control users (mean difference = −8.5 mg/dL, 95% CI [−3.9, −13.0], P < .001). Over time, in the control group, average recorded BG levels increased modestly by 1% per month (P = .024), from 173.5 mg/dL at baseline to 173.9 mg/dL at month 2. By comparison, the users in the mobile group achieved glucose levels that decreased 1.8% per month (P < .001). In total, across 2 months, a mobile user could expect a 3.5% drop in average BG, compared to the user’s baseline measurements (Figure 4). This translated to a mean decrease of 6.4 mg/dL, 95% CI [2.0, 10.7], P < .001, from an average of 165.0 mg/dL to 158.6 mg/dL, after 2 months of using the mobile app.
Figure 4.
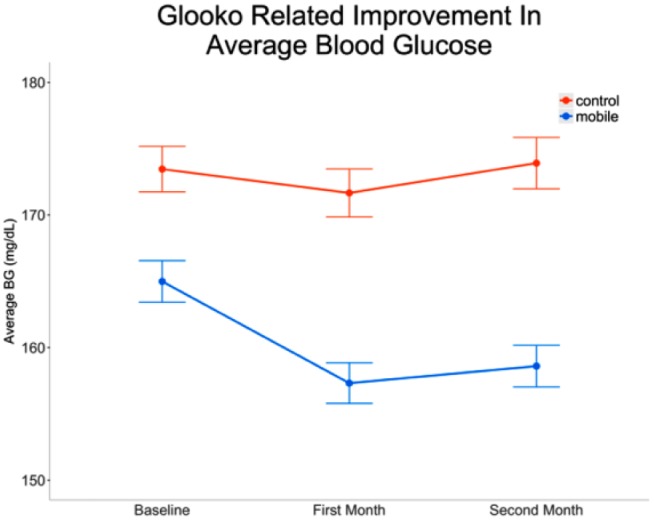
Average blood glucose (standard error) at baseline and following 2 months.
Glycemic Events
At baseline, mobile users had a 8.4% higher probability of experiencing hypoglycemia compared to the control group (P = .016). However, over time, we did not find a significant change in the probability of hypoglycemic events for either group (all Ps > .05).
Before the start of the study, mobile users had a 15.6% lower probability of hyperglycemic events compared to the control group (P < .001). After the start of the study, rates of hyperglycemia were unchanged in the control group (P > .05). By comparison, a mobile user could expect a 10.7% decrease in the probability of hyperglycemic events by the end of 2 months (Figure 5). Overall, mobile users exhibited an additional decrease in the probability of hyperglycemic events by 4.4% per month, compared to control group (P < .001).
Figure 5.
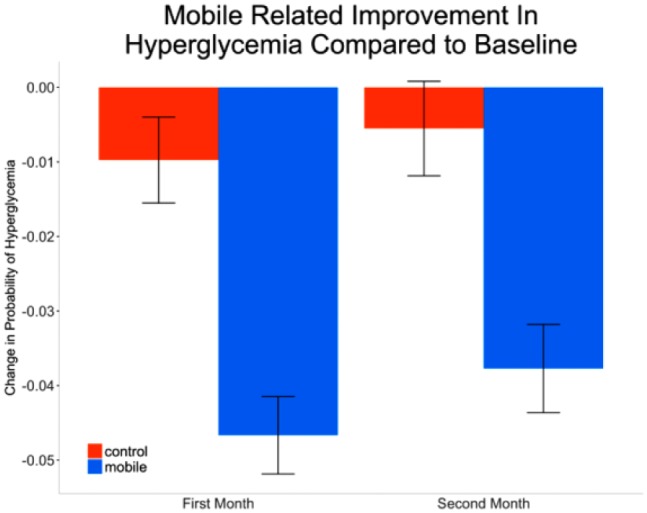
Monthly improvement in hyperglycemia over baseline. Improvement quantified by mean (standard error) decrease in proportion of hyperglycemic readings, weighted by number of readings for that month.
These findings support an observed change in in-range BG readings from 63.6% to 67.1% (+3.5%, P < .001) for the mobile group, compared to a change in in-range BG readings from 61.2% to 62.1% (+0.9%, P = .19) the control group. However, these absolute changes in the proportions of in-range readings do not account for preexisting differences in testing frequency. After accounting for these differences in testing frequency, mobile users had a 13.9% greater probability of being in-range (70 mg/dL to 200 mg/dL) compared to the control group (P = .002) before the start of the study. Over the study period, the number of in-range BG values increased by 1.4% (P = .041 compared to baseline) for control group users. By comparison, mobile users had an additional increase of in-range BG values of 4% per month (P < .001 compared to control group). Overall, a mobile user could expect a 11% increase of the probability of in-range events by the end of 2 months, compared to the control group.
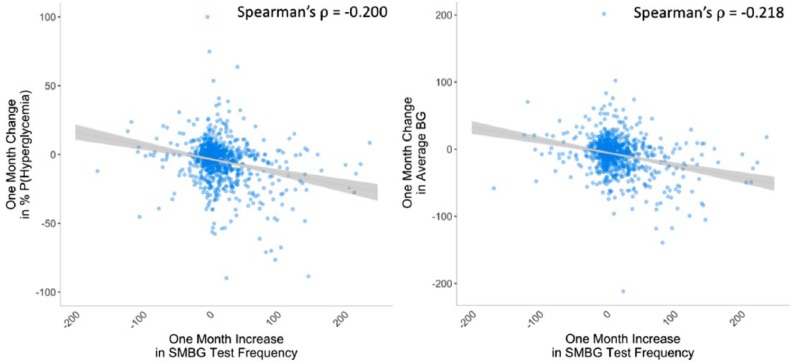
Using Spearman correlations, we found that the increase in SMBG test rate negatively correlated with change in the probability of experiencing a hyperglycemic event (Spearman’s ρ = −.200, P < .001) and change in average BG (Spearman’s ρ = −.218, P < .001).
Post Hoc Analyses
Self-report gender information was available for 80.5% of our mobile group users. We observed no differences between males and females with regard to testing rate at any study time point. We did find that males had lower BG levels than females at the start of the study (P = .0249), but that change in BG during the study did not differ between male and female users. In terms of probability of dysglycemic events, male users exhibited lower hypoglycemia and hyperglycemia rates than females at the start of the study (all Ps < .05), and increased hypoglycemia and decreased hyperglycemia rates over the course of the study relative to female users (all Ps < .05).
Discussion
In this study, we evaluated the use of an FDA-cleared mobile health application that helps people with diabetes organize and display their personal data. We hypothesized that increased access to structured data would improve glycemic control and this was supported by our results. Users of the mobile app increased their frequency of BG monitoring, had fewer hyperglycemic events and better average glucose, compared to individuals having the same data simply uploaded at their providers’ offices. Importantly, the reported decrease in hyperglycemia occurred without an accompanying increase in hypoglycemia. We believe that these improved outcomes were associated with features unique to the mobile platform that enabled easier uploading and viewing of the users’ data.
A substantial proportion of the mobile group users provided self-report demographic information including gender, and we were able to leverage that data to gain insights into gender differences in glycemic outcomes. Although not the primary focus of the manuscript, insights into potential gender differences in glycemic outcomes can be helpful in prescribing treatment. Overall, male mobile users tended to show less engagement with the mobile app than female users8 and exhibit lower BG levels. The overall lower BG levels in male users corresponded to a decrease in hyperglycemia rates and an increase in hypoglycemia rates through the course of the study.
Previous research has shown that SMBG test rate may positively correlate with glycemic improvement.9,10 Although we observed that more frequent testing was associated with improved glycemic outcomes (Figure 6), the effect size was modest and did not explain all the improvement within the mobile group. Therefore, it is likely that other features specific to the mobile platform, including the structured display of user data, contributed to the observed glycemic improvement.
Figure 6.
Mobile group users only. Scatter plots between changes in SMBG count and changes in h percentage probability of hyperglycemia (Spearman’s ρ = −.200, P < .001; left) and average BG (Spearman’s ρ = −.218, P < .001; right).
These findings support a recent meta-analysis suggesting the structured display of data from a mobile application can contribute to improving glycemic control.7 Our results are similar to previously conducted studies,11-18 but very few studies have isolated the effect of a mobile app, while controlling for usual care, as in the current study.
The present study should be interpreted within the context of certain limitations. Because the study was a retrospective cohort design, we could not randomly assign users to the mobile or control groups. One inherent difference between the groups, based on how the groups are defined, is the time between BG device syncs/uploads. In the control group, data were uploaded at every clinician office visit (mean 45.9 days between uploads) whereas in the mobile group, the interupload interval was shorter as data was uploaded during every device/mobile app sync (mean 13.9 days between syncs). How this difference might influence outcomes is unclear and perhaps impossible to quantify as mobile users will naturally be able to upload more often.
Incidentally, several other between-group differences in user characteristics were noted. Compared to control users, mobile users were younger and exhibited lower average BG, more hypoglycemia, and less hyperglycemia at baseline. One possibility is that younger people with diabetes were simply more likely to seek and continue to use mobile health solutions. Another non–mutually exclusive possibility is that older people with diabetes were more likely to have more advanced stage diabetes necessitating clinical care (ie, self-selection into the control user group). Both scenarios, however, can only be considered speculative, and how these between-group baseline differences might influence the current findings remains unknown, and therefore, a limitation of the study.
In addition, mobile and control group users also exhibited incidentally and inherently different BG device engagement characteristics such as SMBG rate and upload rate (to mobile app or clinician’s office). Furthermore, it is plausible that these groups also differed in some unknown way. Apart from knowing that mobile users had the ability to upload their BG data directly to the mobile app and that control users could only upload their BG data during regular visits to their HCPs, we do not know whether systematic differences in diabetes management or HCP settings (eg, endocrinologists, primary care physicians, educators, coaches) might exist between the two groups. Also, our demographic data were limited to the information provided to us by users and we were not able to account for unknown variables such as age, ethnicity, diabetes type or gender. Thus, we do not know how these factors might contribute to our findings. In addition, we have no information related to changes in the dose, frequency or timing of individual therapies.
However, in our analyses we controlled for known preexisting differences by focusing on the difference in rate of change between the groups (ie, the interaction between time and group). Cohort measurements at baseline suggested the mobile group was closer to their health-related goals, compared to the control group. As such, some mobile users might have failed to improve due to a ceiling effect. Ceiling effects can occur when certain populations are already close to a goal at the beginning of a study (eg, the mobile group) and fail to show improvement. Inversely, patients who are further away from a goal at the beginning of a study (eg, the control group) tend to show more dramatic improvement over time.19 Within this context, the modest improvements reported in this study were still clinically relevant, given the baseline glycemic control of our sample. Further studies of digital health technologies are required to determine their impact on those with more poorly controlled diabetes, the reasons for which are often psychosocial in their origins.20
Conclusion
Overall, we present evidence supporting our hypothesis that using mobile health management software facilitates improvement in multiple glycemic outcomes. Although we can directly attribute some of this improvement to an increase in SMBG testing rate, previous research has found the structured display of data can also contribute to a significant improvement in glycemic control.7 Although the goal of the current study was not to determine how mobile health platforms improve health outcomes per se, our demonstrated improvements across multiple glycemic outcomes could have been the result of increased awareness of glycemic status and enhanced contextual awareness and engagement in self-care,7 resulting in a greater ability to regulate behavior based on such information.
Graph 1.
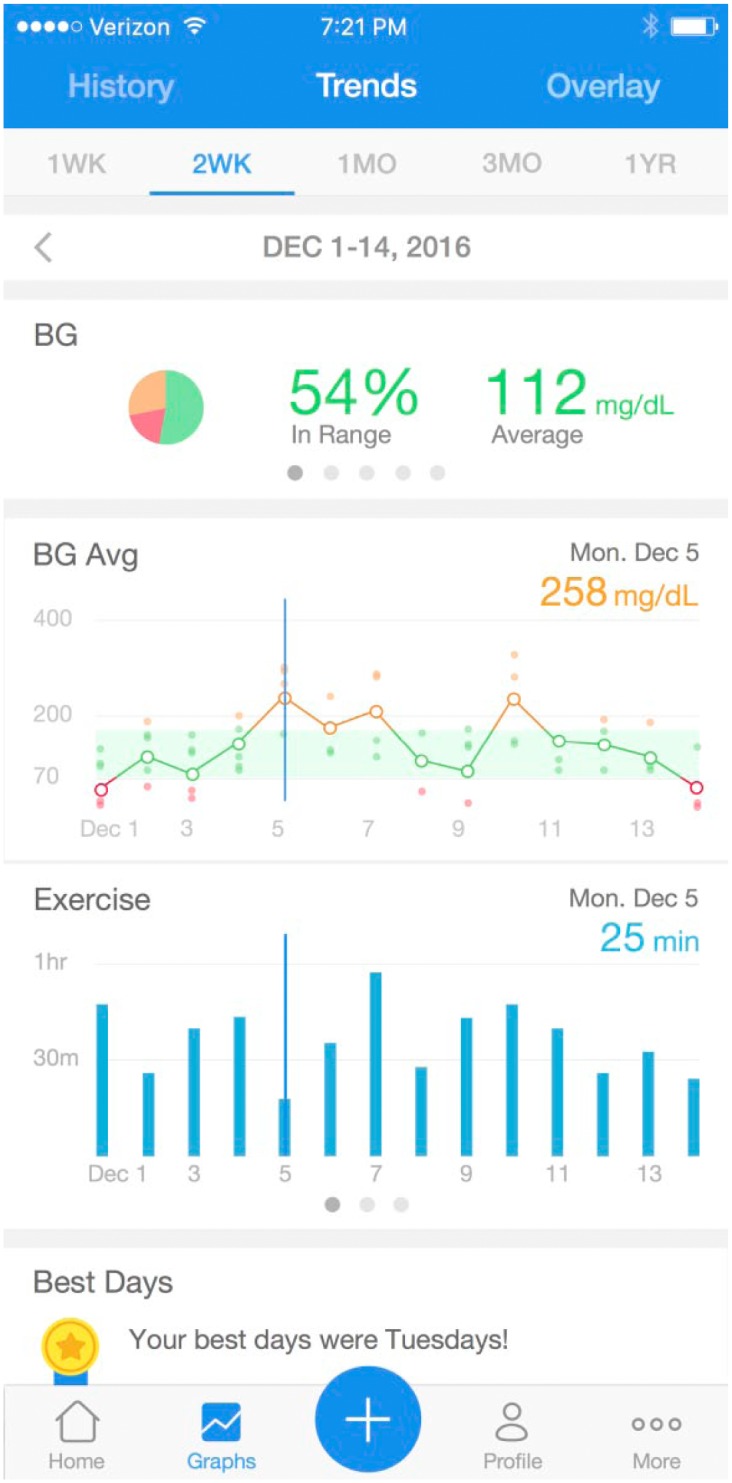
Example display of the mobile app. Users can view their BG data across different time windows (1 week to 1 year) and juxtaposed with contextual (eg, exercise) information.
Graph 2.
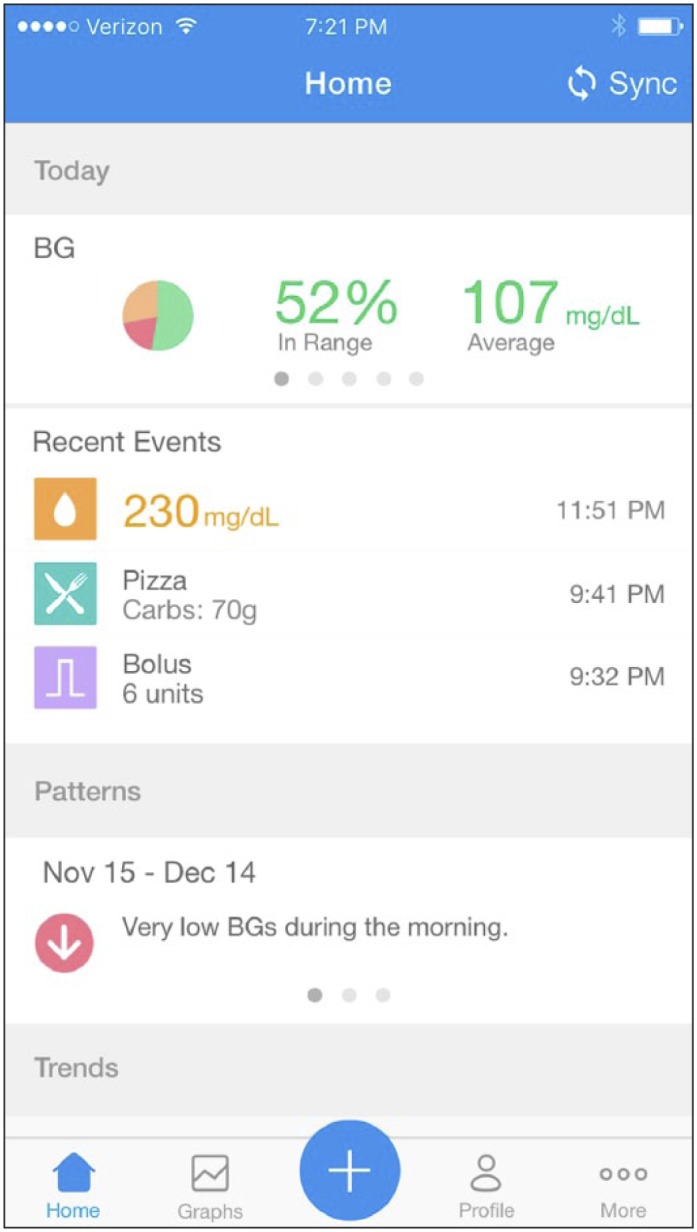
Example display of the mobile app. Users can have a more detailed view of their BG data and contextual (eg, food, medication) information for each day.
Acknowledgments
We’d like to thank Michelle de Haaff for her insight, editing, and guidance on this project.
Footnotes
Abbreviations: BG, blood glucose; FDA, Food and Drug Administration; GLM, generalized linear model; HCP, health care provider; IRR, incidence rate ratio; SMBG, self-monitoring of blood glucose.
Declaration of Conflicting Interests: The author(s) declared the following potential conflicts of interest with respect to the research, authorship, and/or publication of this article: RO, TS, and LP are full-time employees of Glooko, Inc. MSG is the chief medical officer of Glooko, Inc. MC, DK, and MSG are members of the company’s medical board. All authors except MC either hold stock or have the option to purchase stock.
Funding: The author(s) disclosed receipt of the following financial support for the research, authorship, and/or publication of this article: This work was funded by Glooko, Inc.
References
- 1. National Center for Health Statistics. Health, United Stastes, 2016: With Chartbook on Long-term Trends in Health. Hyattsville, MD: 2017. [PubMed] [Google Scholar]
- 2. National Ambulatory Medical Care Survey. Centers for Disease Control & National Center for Health Statistics; 2010. Available at: https://www.cdc.gov/nchs/data/ahcd/namcs_summary/2010_namcs_web_tables.pdf. Accessed June 22, 2017.
- 3. Harris MI. Health care and health status and outcomes for patients with type 2 diabetes. Diabetes Care. 2000;23:754-775. [DOI] [PubMed] [Google Scholar]
- 4. Kerr D. Poor numeracy: the elephant in the diabetes technology room. J Diabetes Sci Technol. 2010;4:1284-1287. [DOI] [PMC free article] [PubMed] [Google Scholar]
- 5. Drincic A, Prahalad P, Greenwood D, Klonoff DC. Evidence-based mobile medical applications in diabetes. Endocrinol Metab Clin North Am. 2016;45(4):943-965. [DOI] [PMC free article] [PubMed] [Google Scholar]
- 6. Hou C, Carter B, Hewitt J, Francisca T, Mayor S. Do mobile phone applications improve glycemic control (HbA1c) in the self-management of diabetes? A systematic review, meta-analysis, and GRADE of 14 randomized trials. Diabetes Care. 2016;39:2089-2095. [DOI] [PubMed] [Google Scholar]
- 7. Wu Y, Yao X, Vespasiani G, et al. Mobile app-based interventions to support diabetes self-management: a systematic review of randomized controlled trials to identify functions associated with glycemic efficacy. JMIR Mhealth Uhealth. 2017;5(3):e35. [DOI] [PMC free article] [PubMed] [Google Scholar]
- 8. Carroll JK, Moorhead A, Bond R, LeBlanc WG, Petrella RJ, Fiscella K. Who uses mobile phone health apps and does use matter? A secondary data analytics approach. J Med Internet Res. 2017;19(4):e125. [DOI] [PMC free article] [PubMed] [Google Scholar]
- 9. Schramm W. Self-monitoring of blood glucose: one STeP forward? J Diabetes Sci Technol. 2012;6:978-982. [DOI] [PMC free article] [PubMed] [Google Scholar]
- 10. Polonsky WH, Fisher L, Schikman CH, et al. Structured self-monitoring of blood glucose significantly reduces A1C levels in poorly controlled, noninsulin-treated type 2 diabetes: results from the Structured Testing Program study. Diabetes Care. 2011;34:262-267. [DOI] [PMC free article] [PubMed] [Google Scholar]
- 11. Wang G, Zhang Z, Feng Y, et al. Telemedicine in the management of type 2 diabetes mellitus. Am J Med Sci. 2017;353(1):1-5. [DOI] [PubMed] [Google Scholar]
- 12. Marcolino MS, Maia JX, Alkmim MB, Boersma E, Ribeiro AL. Telemedicine application in the care of diabetes patients: systematic review and meta-analysis. PLOS ONE. 2013;8(11):e79246. [DOI] [PMC free article] [PubMed] [Google Scholar]
- 13. Hsu WC, Lau KH, Huang R, et al. Utilization of a cloud-based diabetes management program for insulin initiation and titration enables collaborative decision making between healthcare providers and patients. Diabetes Technol Ther. 2016;18(2):59-67. [DOI] [PMC free article] [PubMed] [Google Scholar]
- 14. Baron J, McBain H, Newman S. The impact of mobile monitoring technologies on glycosylated hemoglobin in diabetes: a systematic review. J Diabetes Sci Technol. 2012;65:1185-1196. [DOI] [PMC free article] [PubMed] [Google Scholar]
- 15. Holmen H, Torbjørnsen A, Wahl AK, et al. A mobile health intervention for self-management and lifestyle change for persons with type 2 diabetes, part 2: one-year results from the Norwegian Randomized Controlled Trial RENEWING HEALTH. JMIR Mhealth Uhealth. 2014;2(4):e57. [DOI] [PMC free article] [PubMed] [Google Scholar]
- 16. Istepanian RS, Zitouni K, Harry D, et al. Evaluation of a mobile phone telemonitoring system for glycaemic control in patients with diabetes. J Telemed Telecare. 2009;15(3):125-128. [DOI] [PubMed] [Google Scholar]
- 17. Kirwan M, Vandelanotte C, Fenning A, Duncan MJ. Diabetes self-management smartphone application for adults with type 1 diabetes: randomized controlled trial. J Med Internet Res. 2013;15(11):e235. [DOI] [PMC free article] [PubMed] [Google Scholar]
- 18. Waki K, Fujita H, Uchimura Y, et al. DialBetics: a novel smartphone-based self-management support system for type 2 diabetes patients. J Diabetes Sci Technol. 2014;8(2):209-215. [DOI] [PMC free article] [PubMed] [Google Scholar]
- 19. Retnakaran R, Hochman J, DeVries JH, et al. Continuous subcutaneous insulin infusion versus multiple daily injections: the impact of baseline A1c. Diabetes Care. 2004;27(11):2590-2596. [DOI] [PubMed] [Google Scholar]
- 20. Rossi M, Lucisano G, Pintaudi B, et al. The complex interplay between clinical and person-centered diabetes outcomes in the two genders. Health Qual Life Outcomes. 2017;15:41. [DOI] [PMC free article] [PubMed] [Google Scholar]


