

Abstract
For individuals high in Rejection Sensitivity (RS; Downey & Feldman, 1996), a learned orientation to anxiously expect rejection from valued others, negative feedback from social sources may disrupt engagement with learning opportunities, impeding recovery from mistakes. One context in which this disruption may be particularly pronounced is among women high in RS following evaluation by a male in authority. To investigate this prediction, 40 college students (50% female) answered general knowledge questions followed by immediate performance feedback and the correct answer while we recorded event-related potentials. Error correction was measured with a subsequent surprise retest. Performance feedback was either nonsocial (incorrect: red asterisk/tone) or social (incorrect: male professor’s face/voice). Attention and learning were indexed respectively by the anterior frontal P3a (attentional orienting) and a set of negative-going waveforms over left-inferior-posterior regions associated with successful encoding. For women, but not men, higher RS scores predicted poorer error correction in the social condition. A path analysis suggested that, for women, high RS disrupted attentional orienting to social-evaluative feedback, which affected subsequent memory for the correct answer by reducing engagement with learning opportunities. These results suggest a mechanism for how social feedback may impede learning among women who are high in RS.
Keywords: Attention, Memory, P3a, FRN, LERN
Feedback from those who matter shapes people’s behavior and is critical to successful learning (Hattie & Timperley, 2007; Shute, 2008; Taras, 2003). When feedback comes from sources viewed as supportive, it can effectively draw attention to behaviors that need modification (e.g., Audia & Locke, 2004; Hattie & Timperley, 2007; Yeager et al., 2014). However, when individuals perceive the feedback source as unsupportive and even threatening, resources that could be oriented toward learning from feedback may instead be allocated toward managing this perceived self-threat (Kluger & DeNisi, 1996; Mangels, Butterfield, Lamb, Good, & Dweck, 2006; Mangels, Good, Whiteman, Maniscalco, & Dweck, 2012; Morrison & Bies, 1991; Whiteman & Mangels, 2016).
Individuals high in rejection sensitivity (RS) are characterized by doubts about the supportiveness of the people who matter and are important in their lives (Downey & Feldman, 1996). Modeled as a defensive motivational system, RS is defined as a learned orientation to anxiously expect rejection during evaluation by important others (Downey, Mugious, Ayduk, London, & Shoda, 2004). Individuals high in RS often experience interpersonal difficulties and compromised well-being (Romero-Canyas, Downey, Berenson, Ayduk, & Kang, 2010a), possibly because they overly focus attention on information potentially relevant to rejection (Berenson et al., 2009; Ehrlich, Gerson, Vanderwert, Cannon, & Fox, 2015; Zayas, Shoda, Mischel, Osterhout, & Takahashi, 2009) and are biased toward seeing rejection in others’ behavior (Downey & Feldman, 1996). Consequently, attentional resources may be diverted from other information sources to the detriment of achieving other valued goals (Downey et al., 2004; Romero-Canyas, et al., 2010a).
An important goal for college students is academic success. London, Downey, Romero-Canyas, Rattan, & Tyson (2012) found that evaluative feedback coming from a distinguished male professor triggered more anxious expectations of rejection in women compared to men. Moreover, when provided with weakness-focused feedback women high in RS because of their gender (RS-Gender) reported feeling devalued and were unwilling to pursue further opportunities to learn from the male professor. This suggests that, in evaluative situations, the more that a woman anxiously anticipates being rejected because of her gender in situations where this is a possibility, the more she may be vulnerable to disengagement from important learning opportunities.
In this study we directly investigated whether evaluative feedback given in a disapproving manner that conveys rejection would lead those high in RS to disengage from learning opportunities via a disruptive effect of such feedback on attention. We used a well-studied test-feedback-retest paradigm (Butterfield & Mangels, 2003; Mangels et al., 2006; Whiteman & Mangels, 2016), in which participants’ self-generated responses to challenging, general knowledge questions were followed first by performance-evaluative feedback (i.e., indicating accuracy) and then by the correct answer. Participants later completed a surprise retest of the questions they initially answered incorrectly, with their error correction rate on this retest serving as behavioral evidence of participants’ motivation to attend to and encode the correct answer during the initial test. Based on evidence that individuals high in RS show heightened attention to faces perceived as socially threatening (e.g., disapproving faces. Berenson et al., 2009), we expected them to increase their attention to negative feedback from someone who mattered in an academically-relevant context, such as a male professor. We further expected that such a reaction would compromise engagement with a subsequent learning opportunity, ultimately undermining retest performance.
Given the importance of interpersonal evaluation for eliciting maladaptive responses in individuals high in RS, we also tested whether any disruptive effects of RS were specific to social (face) feedback or would also be observed for non-social feedback. For one set of questions, evaluative feedback was private, with the computer using symbols to convey whether a response was correct or not that were neither implicitly nor explicitly social (i.e., colored asterisk and pure tone; nonsocial condition). For a second set, evaluative feedback came in the form of the face and voice of a male, White “professor” conveying approval or disapproval in the context of an “online course” (i.e., social condition). Although RS might impede retest performance in the social more than in the nonsocial condition for both men and women, London et al. (2012) provide a basis for expecting that women would be particularly vulnerable to withdrawal from learning opportunities when disapproving feedback came from an evaluative, high-status man. However, that study used a measure of RS based on one’s gender.
In the present study, we chose to assess RS using the RS-Personal version of the RS Questionnaire, in which participants imagine situations where they face an important other’s acceptance or rejection of them as an individual (e.g., “You ask your friend to do you a big favor.”), rather than as a member of a specific stereotyped-status group, such as being a woman. Individuals indicate their anticipated anxiety in the situation and the likelihood they would be rejected (Downey & Feldman, 1996). Use of the RS-Personal scale, rather than the RS-Gender scale, allowed us to determine whether gender-specific effects might emerge in a situation threatening to college students, even when RS was defined in a more generalized interpersonal way that would be equally relevant to women and men.
Across a range of previous studies, high scores on the RS-Personal scale have predicted a variety of social, cognitive, and affective difficulties, independent of related constructs including self-esteem, neuroticism, and attachment style (Romero-Canyas et al., 2010a for review). Interestingly however, the effects of RS-personal in situations involving other individuals who matter have often been found to be more pronounced for women than men, with RS being more predictive of reactions to group status-devaluation in men (Romero-Canyas, Downey, Reddy, et al., 2010b). Thus, even though the RS scale we used is gender-neutral, there is a basis for expecting that its ability to predict responses to the academically-relevant feedback in the present study will be more pronounced for women than men.
To capture the effect of RS on attention to evaluative information, we examined two midline frontal event-related potential (ERP) waveforms that are sensitive to feedback valence and/or salience, the Feedback Related Negativity (FRN; Gehring, Goss, Coles, Meyer, & Donchin, 1993 for review see Luft, 2014; Simons, 2010), and a subsequent positive waveform that shows characteristics similar to the P3a (e.g., Butterfield & Mangels, 2003). The FRN is a negative-going waveform that peaks at ~250 ms post-feedback and is generally larger when an outcome is negative rather than positive, particularly when the negative outcome is worse relative to expectations (Holroyd & Coles, 2002; Holroyd & Yeung, 2012). Immediately following the FRN at frontal sites, our group and others have also observed a positive waveform peaking ~350 ms post-feedback that is sensitive to feedback frequency and expectancy, but unlike the FRN, is not sensitive to valence (Butterfield & Mangels, 2003; Mangels et al., 2006; see also Arbel, Goforth, & Donchin, 2013; Arbel & Wu, 2016). Rather, it is heightened for either positive or negative outcomes that are low frequency or otherwise unexpected. Because of its similarities in form and function to the P3a, a waveform classically associated with the up-regulation of a frontal attention system to novel events (Friedman, Cycowicz, & Gaeta, 2001; Polich, 2007), we have referred to this feedback-related positivity as the P3a in the interest of parsimony.
To create a challenging task, we titrated individual performance such that participants received a high percentage of questions they would answer incorrectly (~65% of trials). Consistent with the heightened attentional orienting of those high in RS toward threat cues (Downey et al., 2004; Olsson, Carmona, Downey, Bolger, & Ochsner, 2013), we expected that individuals high in RS would find this frequent negative performance-evaluative feedback to be more motivationally salient than those low in RS, and also habituate to it less readily. Consequently, in individuals high in RS, both the FRN and P3a may be enhanced for negative feedback when averaging across the task as a whole. Alternatively, if RS primarily influences the expectation of a negative outcome, without influencing the intensity or salience of its meaning to the individual, the amplitude of the expectancy-sensitive FRN and P3a to negative feedback may be reduced in people high in RS. Indeed, for the FRN at least, this pattern has been found in anxious individuals (Foti & Hajcak, 2009; Gu, Huang, & Lou, 2009). Finally, although both the FRN and P3a may be equally sensitive to the probability of the negative feedback, it is possible that any specific effects of RS manifest more strongly at only one of these components. For example, the extent to which effects occur more at the P3a, relative to the FRN, might indicate whether RS influences how attention is oriented to the feedback (i.e., P3a) subsequent to the initial detection of the evaluative feedback valence (i.e., FRN).
Interestingly, there appears to be overlap between the proposed generators of the FRN and P3a and regions associated with social rejection or disapproval. Specifically, past ERP studies have localized both the FRN and P3a to generators in dorsal anterior cingulate cortex (dACC; e.g., Holroyd & Yeung, 2012; Huang, Chen, & Zhang, 2015; Warren, Hyman, Seamans, & Holroyd, 2015), although the P3a additionally seems to involve regions in lateral prefrontal cortex and even the hippocampus (e.g., Knight, 1984, 1996). Previous fMRI studies of social exclusion suggest that dACC activity tracks social distress (Eisenberger, Lieberman, & Williams, 2003), including the threat of negative social evaluation (Eisenberger, Inagaki, Muscatell, Haltom, & Leary, 2011). Furthermore, fMRI studies find that people high in RS show a greater activity in the dACC in response to disapproving facial expressions, but not to negative facial expressions more generally (Burklund, Eisenberger, & Lieberman, 2007). Although source localization is beyond the scope of the current study, together these findings suggest that socially-evaluative negative feedback (i.e., disapproving face of the male professor) may be more likely than non-social negative feedback (i.e., red asterisk) to modulate the FRN and/or P3a in high RS individuals.
With regard to the relationship between these feedback-related potentials and downstream error correction in our task, we would expect a stronger relationship with the P3a than the FRN. Although a more-negative going FRN is often predictive of improved performance in skill learning and/or probabilistic learning tasks (Cohen, Elger, & Ranganath, 2007; van der Helden, Boksem, & Blom, 2010), studies using declarative memory tasks (such as the one used in the present study) typically find either no relationship between the FRN and learning (Butterfield & Mangels, 2003; Mangels et al., 2006), or a negative relationship (i.e., smaller FRN associated with faster/better learning; Arbel & Wu, 2016; Ernst & Steinhauser, 2012; Mangels et al., 2012). Yet, a robust relationship to feedback-based declarative learning has been found for the P3a (Butterfield & Mangels, 2003; Mangels et al., 2006; see also Arbel et al., 2013; Arbel & Wu, 2016).
Additionally, past studies have differentiated between the more fronto-central aspect of the P3a (maximal at FCz) that appears to index processes that facilitate successful encoding of a learning opportunity (Arbel et al., 2013; Arbel & Wu, 2016; Butterfield & Mangels, 2003; Mangels et al., 2006), and a more anterior aspect of the feedback-related P3a (maximal at Fz) that may be associated with processes more likely to interfere with encoding (Mangels et al., 2006). Importantly, unlike the fronto-central P3a, the more anterior P3a can be modulated by top-down attention based on motivational goals and beliefs, in addition to the bottom-up salience of the feedback frequency (Mangels et al., 2006). Specifically, using a task highly similar to the nonsocial condition in the present study, Mangels et al., (2006) found that entity theorists (i.e., individuals who believed that intelligence was fixed and could not be improved through effort; Dweck, 2006) not only demonstrated an enhanced anterior P3a to persistent negative feedback compared to growth theorists (i.e., individuals who believed intelligence could be modified through effort), but also experienced poorer learning outcomes on the surprise retest. In addition, for both entity and incremental theorists, the amplitude of the anterior P3a was positively correlated with the endorsement of normative goals (i.e., the goal to perform better than others; Grant & Dweck, 2003) – a goal that the persistent negative feedback signaled was not being met. Thus, given that the anterior aspect of the P3a might be particularly sensitive to the orienting of attention to evaluative feedback that is highly salient with regard to personal goals and beliefs, here we will focus on this aspect of the P3a, its relationship to RS, and to potential interference with the ability to optimally encode subsequent learning opportunities.
For our measure of engagement with the learning feedback (i.e., correct answer), we focused on sustained, negative-going waveforms over left-inferior-posterior sites that our previous studies have shown to be larger when correct answers are correctly recalled on the subsequent retest compared to when they are not (Butterfield & Mangels, 2003; Mangels et al., 2006; Whiteman & Mangels, 2016). Given that successful error correction in this paradigm involves updating semantic knowledge, it is not surprising that these sites, which lie proximal to a critical part of the larger semantic processing network (e.g., Binder & Desai, 2011), show this type of encoding-related “difference due to memory” effect (see Mangels, Picton, & Craik, 2001; Paller & Wagner, 2002). We expected to replicate the sensitivity of these left-inferior-posterior waveforms to successful encoding of corrective information. We also expected that differences in the amplitude of these waveforms would mediate any observed relationship linking RS-based differences in the neural response to the performance feedback (i.e., FRN, anterior P3a) with retest performance.
Summary.
Building on evidence that individuals high in RS selectively attend to social threat cues (Berenson et al., 2009; Zayas et al., 2009), this study combines ERP and behavioral measures to examine whether and how these patterns emerge within a challenging, academically-relevant task focused on learning after failure. Given that RS is specifically tied to concerns with social rejection, we expected that any effects of RS would be stronger when feedback was social (i.e., from a male professor) rather than nonsocial (i.e., computer), with women high in RS particularly vulnerable to such social evaluations (London et al. 2012). ERP evidence linking worse behavioral outcomes in those high in RS with events occurring during feedback-presentation and encoding would provide compelling evidence for one mechanism by which RS might undermine academic achievement in challenging, evaluative situations.
Methods
Participants
We consented 55 (32 women; 59%) English-speaking, right-handed, neurologically-normal Baruch College undergraduates into the study. Participants were recruited from a cohort (n = 540) who completed a prescreening survey that included the Personal version of the RS Questionnaire (Downey & Feldman, 1996) and questions assessing eligibility for EEG. Of the screened participants, 154 (29%) were EEG eligible and consented to be recontacted. In recruiting from this group, we sought a normal distribution of RS scores, an equal number of men and women, and a racial/ethnic makeup representative of Baruch students. Of the 55 selected participants, one woman exceeded our exclusion cutoff for depression (Beck Depression Inventory-II; BDI-II > 23) and was directed to counseling services, and 2 women were excused because of technical problems with EEG recording. Of study completers, seven (3 women) were excluded for performing outside a predefined ±6% window around our 35% titration target for initial test accuracy, and five (2 women) were excluded for failing our incidental learning probe (i.e., did you deliberately study the correct answer?). The final sample included 20 men and 20 women. They received either course credit or $10/hr for participation. All participants returned for the retest and received a $10 bonus.
Table 1 gives sample demographic information. Ethnic/racial composition reflected the Baruch College student population (http://www.cuny.edu/about/administration/offices/ira/ir/data-book/current/race-ethnicity.html): 48% Asian American1, 20% White, 13% Multi-Racial, 3% African-American, 3% Pacific Islander, 13% declined to report. There were no gender differences in age [t(36) = 0.75 p = .46], education [t(36) = −0.07 p = .94], or racial distribution [χ2 (5, N = 37) = 4.40, p = .49]. RS means are similar to those typically seen in undergraduate samples (Downey & Feldman, 1996), with women scoring marginally higher than men, t(38) = 1.97, p = .06 (Downey & Feldman, 1996).
Table 1:
Sample characteristics and subjective experiences (SD in parentheses)
| Women (n=20) | Men (n=20) | |
|---|---|---|
| Prescreen | ||
| Age | 21.25 (4.25) | 20.11 (1.83) |
| Years Education | 14.64 (2.96) | 14.61(2.81) |
| Rejection Sensitivity (RS) | 11.31 (2.41) | 9.62 (2.97) |
| DAY 1: Initial test | ||
| Pre-test Mood | ||
| BDI-II | 10.35 (6.24) | 7.30 (5.40) |
| STAI-state (time 1) | 35.65 (10.54) | 31.40 (8.78) |
| Post-Block: Nonsocial Condition | ||
| Task Efforta | 4.70 (1.80) | 5.33 (1.54) |
| Task Difficultyb | 6.38 (1.56) | 5.93 (1.25) |
| Anxiety During Taskc | 4.35 (1.91) | 5.33 (1.35) |
| Post-Block: Social Condition | ||
| Task Effort(a) | 4.75 (2.56) | 5.58 (1.73) |
| Task Difficulty(b) | 6.10 (1.07) | 6.05 (1.54) |
| Anxiety During Task(c) | 4.75 (1.97) | 4.98 (1.88) |
| Post-Test Mood | ||
| STAI-state (time 2) | 39.40 (12.45) | 33.75 (9.02) |
| DAY 2: Retest | ||
| Post-Test Task Experience | ||
| Expected Retest(d) | 3.00 (2.23) | 4.35 (2.89) |
| Deliberately Studied(e) | 1.22 (0.43) | 1.25 (0.55) |
| Task Effort(f) | 6.28 (2.02) | 5.40 (2.33) |
| Task Difficulty(g) | 3.44 (1.42) | 3.05 (1.15) |
| Post-Test Mood | ||
| STAI-state (time 3) | 30.83 (9.00) | 28.25 (9.12) |
In general, how motivated were you to do a good job throughout this block? (1 = not at all, 9 = extremely)
In general, how difficult were the questions in this block? (1 = not at all, 9 = extremely)
During this block of questions I felt anxious most of the time. (1 = very anxious, 7= very relaxed)
Did you anticipate a retest? (1 = not at all, 9 = extremely)
Did you deliberately study any items? (1 = not at all, 9 = extremely)
How hard did you try? (1 = not at all, 9 = extremely)
How difficult did you find the test to be? (1 = not at all, 9 = extremely)
Design and Procedure
On Day 1, participants provided consent, completed measures of state anxiety (STAI-state test; Spielberger, Gorsuch, Lushene, Vagg, & Jacobs, 1983) and depression (Beck Depression Inventory – II, BDI-II; Beck, Steer, & Brown, 1996), and then were set up for EEG. Instructions for the general knowledge test were presented visually with a simultaneous voice-over read by a woman (not an experimenter) and followed by specific instructions for either the nonsocial or social conditions, detailed below.
Participants answered 100 questions in two 50-trial blocks under one condition, after which they received instructions for the other condition and answered a second set of 100 questions, also broken into two 50-trial blocks. Condition order was counterbalanced across participants.
After each block, participants reported on effort, task difficulty, and anxiety (see Table 1). After the final block, the EEG cap was removed and participants completed the STAI-state again. Finally, participants viewed the two pictures used to indicate feedback in the social condition and selected the one emotion they believed was most clearly displayed in each picture from a list of 6 adjectives (happy, disapproval, surprise, calm, angry, neutral, none of the above).
The 200 questions asked of each participant were randomly selected from a larger set of 434 normed questions tapping a variety of academic domains, including science, history, music, art history, literature, geography, and religion. The current version of this question set is available as the B-KNorms; http://www.mangelslab.org/bknorms. A titration algorithm was used to maintain each participant at a stable, but low, accuracy rate of 35% throughout the task (for algorithm details see Butterfield & Mangels, 2003). Titration was done to ensure consistency in intra- and inter-individual level of negative feedback regardless of participants’ pre-existing knowledge level. As noted above, we excluded 7 participants for whom titration failed to bring performance within a reasonable approximation (± 6%) of the target, given that “breaking” titration by a large margin might produce substantial differences in the psychological experience of failure and in task demands on memory for that individual.
Figure 1 shows a sample trial. Questions were presented one at a time, and participants had a 3-minute window to provide their best response. If they did not know an answer, they were prompted to type their best guess or could wait 3 minutes, after which they would be marked incorrect. After submitting their response, participants rated their confidence in its accuracy (1 = “sure wrong,” 4 = “unsure,” 7 = “sure right”). Next, participants saw feedback indicating their accuracy, followed by the correct answer. Only the accuracy feedback and the specific instructions framing it differed between nonsocial and social conditions.
Figure 1: Behavioral method.
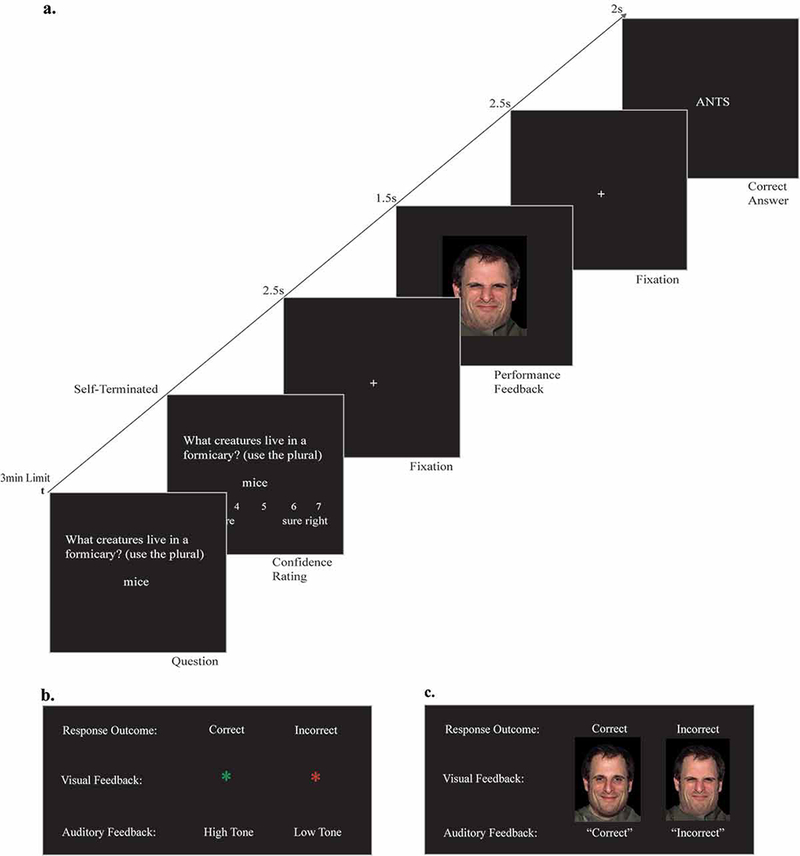
(A) Stimulus sequence for a single error trial in the social condition. (B) Nonsocial condition performance feedback (correct and incorrect). (C) Social condition performance feedback (correct and incorrect).
In the nonsocial condition participants read and simultaneously heard over headphones from a prerecorded female voice the following instructions:
In this section, you will be interacting with a computer. After you enter your response and response confidence for a given question, the computer will give you feedback and your accuracy using a symbol. That is, if your response is correct the computer will show you a large asterisk (*) in green and play a high tone. If your response is incorrect the computer will show you a large asterisk (*) in red and play a low tone.
Correct and incorrect feedback consisted of a green asterisk and a high tone or a red asterisk and a low tone, respectively, replicating previous studies of this paradigm (see Butterfield & Mangels, 2003; Mangels et al., 2006; Whiteman & Mangels, 2016). Asterisks subtended a visual angle of 1.38° by 1.72°.
In the social condition, participants read and simultaneously heard over headphones, also from a prerecorded female voice, the following instructions:
In this section, imagine yourself completing an exam for an online course where the professor gives you immediate feedback on your responses. If your response is correct you will see the professor expressing approval and hear him say “correct.” If your response is incorrect you will see the professor expressing disapproval and hear him say “incorrect.” After he gives you feedback, he will show you the correct answer to the question.
Correct and incorrect feedback consisted of a photo of a man with either a smiling expression or close-mouthed, moral disgust expression (NimStim; Tottenham, Borscheid, Ellertsen, Marcus, & Nelson, 2002), paired with a male voice (not an experimenter) saying “correct” and “incorrect,” respectively. In an explicit evaluative context, a close-mouthed or moral disgust expression is known to elicit feelings of disapproval and rejection (Chapman & Anderson, 2013; Westphal, Bonanno, & Mancini, 2014). In post-study testing, 82% of participants (18 women; 15 men) correctly identified the positive feedback as happy and 78% (17 women; 14 men) correctly identified the negative feedback as disapproval (see Table 2 for complete breakdown). Face stimuli subtended a visual angle of 13.85° by 22.07°.
Table 2:
Participants indications of the facial emotions displayed in the social evaluative feedback
| Women |
Men |
|||
|---|---|---|---|---|
| Positive Feedback |
Negative Feedback |
Positive Feedback |
Negative Feedback |
|
| Happy | 18 (90%) | 0 (0%) | 15 (75%) | 0 (0%) |
| Disapproval | 1 (5%) | 17 (85%) | 0 (0%) | 14 (70%) |
| Surprise | 1 (5%) | 1 (5%) | 1 (5%) | 0 (0%) |
| Calm | 0 (0%) | 0 (0%) | 2 (10%) | 0 (0%) |
| Angry | 0 (0%) | 1 (5%) | 0 (0%) | 4 (20%) |
| Neutral | 0 (0%) | 0 (0%) | 1 (5%) | 0 (0%) |
| None of the Above | 0 (0%) | 1 (5%) | 1 (5%) | 2 (10%) |
Participants returned 24 to 48 hours later for a surprise retest of the questions they had answered incorrectly during the first test. At the end of the first testing session (Day 1) participants were told only that the second session (Day 2) involved completing additional questions. However, after they arrived for the second session, written task instructions displayed on the computer monitor informed them that they would be retested on questions they had answered incorrectly on Day 1 and to answer the questions as best they could. No EEG was recorded and no specific framing instructions were given.
Retest feedback consisted of a single stimulus presented for 2000 ms that simultaneously indicated response accuracy and the correct answer (incorrect: correct answer in red; correct: correct answer in green). To preserve overall study-test delay, questions answered during the first block of the first test were presented before questions answered during the second block. Within each retest block, question order was randomized. When the retest ended, participants completed an incidental memory probe and reported on task effort, task difficulty, and state anxiety (see Table 1). They then were debriefed and compensated.
EEG Recording and Averaging.
Continuous EEG was recorded during the first test from 64 sintered Ag/AgCl Quick-Cap electrodes using Neuroscan Synamps 2 (Compumedics USA, Charlotte, NC). Sampling was at 500 Hz A/D rate, with a DC-100 Hz band-pass. Impedance was below 5 kΩ at the start of testing and maintained below 11 kΩ throughout the ~2 hr testing period (see also Mangels et al., 2006; Whiteman & Mangels, 2016). EEG was initially referenced to Cz and converted to an average reference offline. Any bad channels were either bypassed during recording or later interpolated from surrounding electrodes before re-referencing to the average (maximum 3 channels per subject). We compensated for blinks and other ocular artifacts with 3–6 PCA-derived components (BESA 5.3). Offline, ERPs for the accuracy and learning feedback were created by averaging 1000 ms epochs that were stimulus-locked and baseline corrected to the 100 ms pre-stimulus onset.
Epochs containing excessive noise (+/− 120μV) were rejected. Overall, an average of 89.1% performance feedback epochs and 88.5% learning feedback epochs survived artifact rejection. More detailed ANOVA on the retained performance feedback trials as a function of gender, condition, and accuracy demonstrated a significant interaction between feedback type and condition, F(1, 36) = 23.3, p < .001. In the social condition there was a greater retention of positive feedback trials (90.1%) compared to negative feedback trials (78.8%), but this difference was only marginal in the nonsocial condition (positive feedback: 89.2%, negative feedback: 86.5%). It is not surprising that the more unpleasant outcome (negative feedback) elicited more artifacts (e.g., sweat potential, muscle noise), with the greater loss for the social condition indirectly suggesting greater aversiveness for the social stimulus. Importantly, however, there were no effects on retained performance trials involving gender.
Next, with regard to retained learning feedback trials, although men retained a significantly lower percentage of trials than women overall (Men: M = 85%, Women: M = 92%; F(1, 38) = 4.66, p < .04), there were no other significant main effects on retained learning trials, nor any interactions between gender and these factors (all Fs < 2.5, ps > .12). Finally, RS did not relate to trial retention for either performance or learning feedback, for either gender in any condition, suggesting that any observed RS effects could not be attributed simply to differences in signal-to-noise ratio.
Analysis.
Titration successfully eliminated effects of order, gender, condition, RS, or their interactions on first test accuracy (all Fs < 1.21, all MSE < 0.01, all ps > .31). Yet, because initial and retest performance were moderately to highly correlated within each condition even after titration and removal of titration breakers (social: r(39) = .39 p = .01; nonsocial: r(39) = .70, p < .001), we regressed out accuracy at first test on retest accuracy and added the residuals back to the sample mean of retest accuracy to create a retest measure for each condition (see also Mangels et al., 2012; Whiteman & Mangels, 2016). Because ERPs of interest could also reflect individual variability in error frequency/probability (Butterfield & Mangels, 2003; Holroyd & Coles, 2002), we also regressed accuracy on first test on the ERP variables of interest and added the residuals back to the sample mean of the relevant ERP variable to create an adjusted ERP variable for each condition.
Other potential covariates were also considered. First, past studies in which RS was significantly correlated with state anxiety (STAI-state), included STAI-state as a covariate to differentiate RS-specific effects from general anxiety effects (Berenson et al., 2009). However, we did not find a significant relationship between RS and either pre- or post-test state anxiety (ps > .43), and thus, did not include STAI-state as a covariate. Past studies have also shown that participants’ confidence in their initial errors strongly influences retest performance (e.g., hypercorrection of high confidence errors compared to low confidence errors; see Butterfield & Mangels, 2003; Butterfield & Metcalfe, 2001; Mangels et al., 2006). We replicated the hypercorrection effect on retest performance. However, because this behavioral effect was not moderated by any other independent variables or their interactions (see S1), for our ERP analyses, we opted to maximize trial counts for our ERP (and behavioral) analyses by collapsing across confidence.
All behavioral and self-report analyses, including retest performance and block-specific subjective experiences (e.g., how difficult was this block?), used mixed-model GLMs, with gender and order as fixed factors, condition (nonsocial; social) as a repeated measure, and RS, treated continuously, along with its interactions with gender and condition. Analyses of the post-block questions from the initial test were based on an average across the two blocks within each condition. When post-retest subjective experience (i.e., retest expectation; see Table 1) was considered, however, we removed condition as a factor in this model, because post-test questions asked about participants’ experiences within the first-test as a whole, rather than in individual conditions. Additionally, when analyzing STAI-state we added time-point as a factor because state anxiety was measured at three time-points: pre-test baseline, post-initial test, post-retest. ERP analyses used a similar model to the basic mixed-model GLM described above for the behavioral variables, but included additional variables described below.
ERP Analysis.
To better visualize the components of interest, epochs were filtered again with 0.15Hz high-pass and 35 Hz low pass zero-phase filters. Due to the substantial visual and auditory perceptual differences between the nonsocial and social feedback stimuli, we analyzed the effects of first-test accuracy (i.e. correct vs. error) on the FRN and anterior P3a independently for each condition. In contrast, the learning feedback (i.e., correct answer) was identical in both conditions and thus, the factor of condition was included in those analyses.
Performance Feedback.
As shown in Figure 3a-b, the scalp topography of both the FRN (shown as the FRNdiff to highlight the greater negativity for errors) and P3a (shown for corrects, which had the larger P3a) included Fz. However, both components also extended more broadly over fronto-central regions. Additionally, during the time period of the P3a for correct feedback, positivity over posterior regions could also be observed. Given that positive outcomes served as a rare, target outcome, this posterior distribution is likely due to overlap with the P3b (Polich, 2007). Despite these broad distributions, however, to maintain consistency with our a priori hypotheses (see Luck & Gaspelin, 2017) that the more anterior P3a would be the best index of both individual differences and feedback valence/frequency effects in this paradigm (Mangels et al., 2006, 2012; Whiteman & Mangels, 2016), our analyses of performance feedback will focus on activity at Fz.
Figure 3:

ERPs to performance-evaluative feedback highlighting the FRN and P3a. (A) Scalp topographies of the Nonsocial FRN and P3a, shown from a top view. The FRN is illustrated using the difference wave (incorrect — correct feedback) in order that it appears as a negative-going waveform. The P3a is shown for positive feedback (corrects), given that positive outcomes are the most novel and elicit the largest P3a. These spline maps are plotted from the average amplitudes at each electrode over the time window used in the FRN or P3a analyses (see text). Blue indicates negative polarity and red indicates positive polarity. Electrode positions are indicated by small red circles, with the Fz electrode highlighted in white. (B) Same as (A), but for the Social Condition. (C) Nonsocial condition grand means plotted as a function of gender and initial-test accuracy. (D) Social condition grand means plotted as a function of gender and initial-test accuracy. (E) Simple Slopes for P3adiff (correct feedback-error feedback) in the social condition as a function of gender (error bars reflect the SEM).
As shown in the grand mean waveforms, the FRN in the nonsocial condition (Figure 3c) had a later latency and shorter duration than the FRN in the social condition (Figure 3d), and was also preceded by a prominent P2 that was notably absent in the social condition.2 Comparison of the average peak latency of the FRN to negative feedback verified this observation [nonsocial: 295.55 ms, social: 233.35 ms; t(39) = −8.18, p < .001]. Accordingly, we measured the mean amplitude of the nonsocial FRN from 274 ms to 326 ms and the social FRN from 150 to 300 ms. We used mean windows rather than peak measurements given the difficulty of discerning a distinct negative waveform for correct trials in individual subjects.
For the anterior P3a (henceforth referred to simply as the P3a), we first analyzed the peak latency to positive feedback and found that it was not statistically different across the two conditions (p = .30). Nonetheless, because the P3a in the social condition appeared more sustained, we measured the mean amplitude of the nonsocial P3a from 324–400 ms and the social P3a from 300–450 ms. Measurement windows of the nonsocial FRN and P3a were consistent with previous studies (Mangels et al., 2006, 2012). In addition to analyses of the raw waveforms, we also computed and analyzed difference waveforms.
Learning Feedback.
To understand the observed relationship between the effect of RS on the response to performance feedback (nonsocial or social) and error correction, we also needed to identify a neural marker for successful encoding of the learning feedback (i.e., correct answer) as a potential mediator of this relationship. Including this component in the analysis is critical, given that performance evaluative feedback only informs the participant that their answer is wrong, not what the correct answer is; only the learning feedback provides specific information about the answer that is right. Given that substantial previous work with this paradigm has already examined “difference due to memory” (Dm) effects predicting successful encoding of the correct answer, we opted to focus our analysis on the electrodes over left-inferior-posterior scalp where Dm effects are consistently found (i.e., TP9/Cb1; Butterfield & Mangels, 2003; Mangels et al., 2006; Whiteman & Mangels, 2016), rather than conduct a broad exploratory analysis of all possible Dm sites. Inspection of the grand mean waveforms at these electrodes confirmed the presence of negative-going waveforms that showed sustained differences between later remembered and forgotten items throughout the 1 sec post-feedback period, with a peak between 400–800 ms (see Figure 4).
Figure 4: ERPs to initial-test learning feedback as a function of error correction on the subsequent retest (later corrected, later not corrected), gender, and condition.
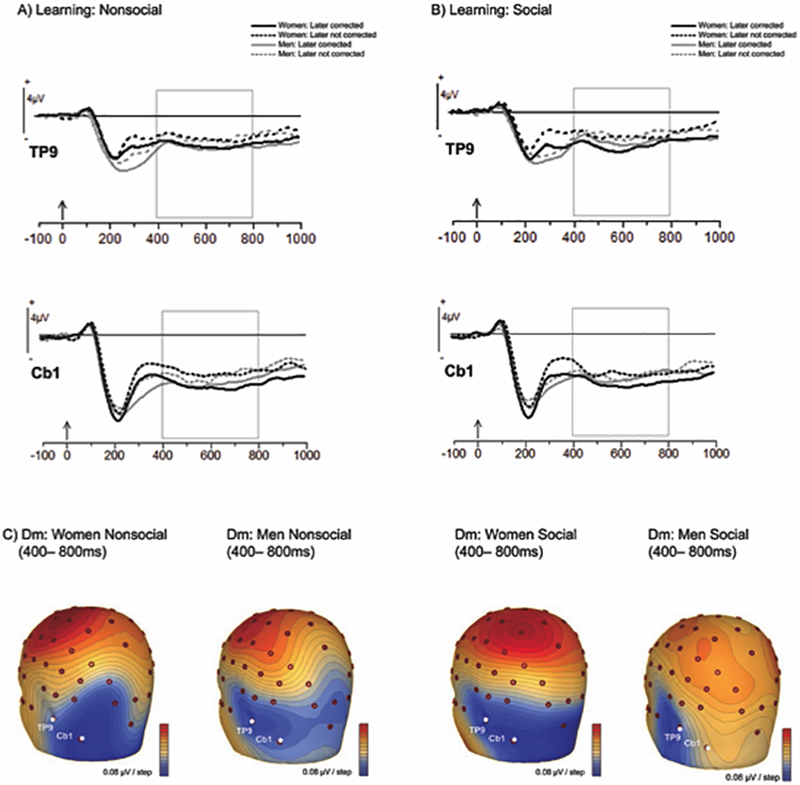
(A) Grand means at left inferior temporal sites (TP9/Cb1): Nonsocial condition. Lines demarcate the 400–800 ms area of interest (B) Grand means at left inferior temporal sites (TP9/Cb1): Social condition. Lines demarcate the 400–800 ms area of interest (C) Scalp topography of the difference due to memory (Dm: corrected – not corrected), averaged from 400–800ms and highlighting the inferior posterior electrodes (TP9/Cb1).
To confirm the statistical significance of these observations, we conducted an ANOVA on the mean amplitude at this window, which included gender and order as between-subjects variables and subsequent memory (later retrieved vs. later not retrieved), frame, and electrode (TP9, Cb1) as within subjects variables. The primary purpose of this analysis was to demonstrate that Dm effects were evident at these sites and to determine if they differed as a function of frame, order, or gender.3 In addition, due to the large number of factors, we only report significant effects involving the factor of subsequent memory, as these effects are the most central to our goal of confirming Dm effects at these sites (a full list of all significant and marginal effects is provided in S3).
Finally, we tested our mediation model in which the ERPs during both performance feedback and learning feedback served as mediators of the relationship between RS and retest performance. For this analysis, we needed to employ a single learning-feedback ERP measure that was representative of continuous, quantitative differences of learning success, unlike the categorical differences captured by separately averaging two outcome categories (i.e., later remembered and forgotten items). Thus, for the mediation model, we used the overall learning feedback ERP (Learning Event Related Negativity [LERN], see also Whiteman & Mangels, 2016), which is an average of the items later corrected and forgotten and should reflect the relative contributions of successful and unsuccessful encoding processes in a given person. In other words, if a person corrects the majority of items at retest, the LERN should be more similar to his/her average of later corrected items used in the previous Dm analysis, whereas if he/she corrects few items at retest the LERN should be more similar to the raw waveform associated with the average of later forgotten items.
Results
Subjective Measures: Mood and task experience
As shown in Table 1, we found no differences in any aspect of subjective task experience as a function of gender, RS, and/or (for Initial Test Post-block measures only) condition (all Fs < 3.50, MSEs < 8.02, ps > .06). Although overall state anxiety did change across the duration of the task, F(2, 36) = 9.74, MSE = 46.51 p < .001, posthoc analysis showed that this effect is driven by significantly lowered state anxiety after the retest was finished (M = 29.47, SD = 1.47), compared to either the pre-test (M = 33.05, SD = 1.44) or after the initial test (M = 36.39, SD = 1.77), which did not differ from each other. However, this decrease had a marginally significant three-way interaction with gender and RS, F(2, 60) = 2.93, MSE = 47.56 p = .07. Although, univariate analysis of the two-way interactions between gender and RS for each STAI measured revealed no further significant (marginal or otherwise) effects (all Fs < 1.81, MSEs < 132.33, ps > .18)
Behavioral Results.
Retest Performance (Error Correction).
Consistent with predictions, we found a significant three-way interaction between gender, RS, and condition, F(1, 36) = 6.51, MSE = 0.01, p = .02. This interaction qualified a main effect of gender, F(1, 36) = 4.36, MSE = 0.09, p = .04, where women corrected more errors than men overall and a two-way interaction between gender and condition, F(1, 36) = 7.46, MSE = 0.04, p = .01, qualifying this advantage for women as specific to the social condition (see Figure 2a). We also found a two-way interaction between gender and RS showing that women low in RS generally corrected more of their errors than men low in RS, F(1, 36) = 4.25; MSE = 0.02, p = .04.
Figure 2: Behavioral Performance.
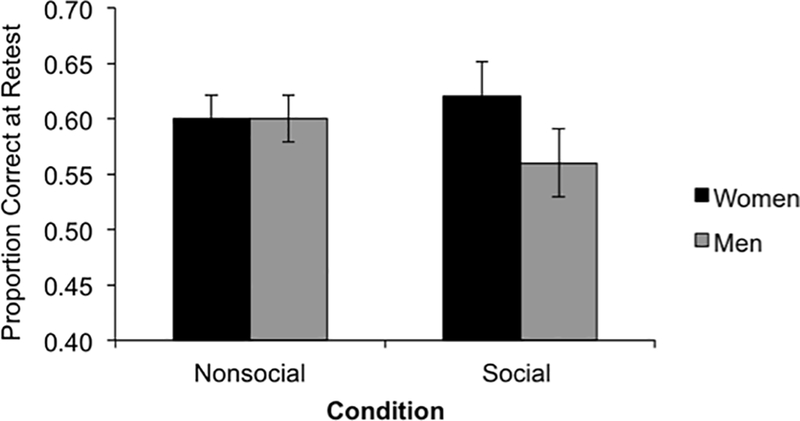
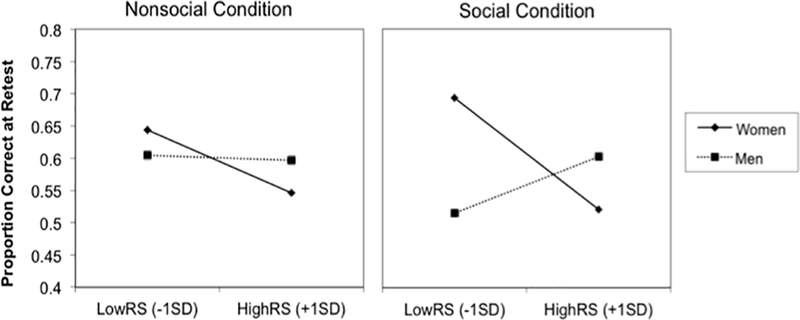
(A) Average proportion corrected on the surprise retest, as a function of gender and condition. (B) Simple slopes illustrating the RS × Gender × Condition interaction. Slopes are graphed separately for the Nonsocial and Social conditions.
To unpack the 3-way interaction, we conducted separate univariate GLMs including gender, RS, and the interaction for each condition. These revealed no significant main effects or interactions in the nonsocial condition (all Fs < 1.20, MSEs < 0.01, ps > .28), but a significant gender × RS interaction in the social condition, F(1, 36) = 6.93, MSE = 0.12, p = .01. As Figure 2b illustrates, the simple slope analysis (Aiken & West, 1991) indicated that in the nonsocial condition, RS was marginally significantly associated with worse retest performance in women, b = −0.31, t(19) = −1.90, p = .07, and the effect was non-significant in men, b = −0.01, t(19) = −0.41, p =.68. In parallel analyses in the social condition, higher RS was associated with worse retest performance in women, b = −0.55, t(19) = −2.13, p = .04, but in men, RS was non-significantly associated with better retest performance, b = 0.32, t(19) = 1.57, p = .13.
In sum, for women, being higher in RS was associated with worse learning from corrective feedback (i.e., correct answer), especially when the corrective feedback was preceded by evaluative feedback from a disapproving male professor. For men, retest performance was not significantly related to RS. Moreover, the overall advantage for women over men in learning from social feedback seems to be driven by individuals with lower RS, with women lower in RS demonstrating better error correction than men lower in RS.
Electrophysiological analyses
Response to performance feedback.
We analyzed ERPs to the performance feedback (FRN, P3a) at Fz4 to test predictions about how RS may moderate attentional responses to negative and positive feedback in the nonsocial and social conditions. We replicated the sensitivity of the FRN to negative feedback, in that a larger FRN (a negative-going waveform) was generated by negative feedback than positive feedback in both the nonsocial condition, F(1, 32) = 11.08, MSE = 1.36, p = .002 (Merrors = 0.55 μV, SE = 0.48 vs. Mcorrects = 2.24 μV, SE = 0.51; Figure 3a;) and social condition, F(1, 32) = 6.89, MSE = 0.93, p = .01 (Merrors = 0.20 μV, SE = 0.41 vs. Mcorrects = 1.55 μV, SE = 0.48; Figure 3b). Yet, there were no main effects or interactions with order, gender, or RS in either condition (all Fs < 2.70, MSEs > 0.25, ps > .06). Analyses of the FRN difference wave (incorrect – correct; FRNdiff) yielded similar results. Thus, initial detection and evaluation of the error outcome did not appear to be modulated by either gender or RS, regardless of whether feedback was in the form of an abstract, nonsocial symbol or an evaluative male face.
Titration rendered positive feedback less frequent than negative feedback, and as expected, the P3a was sensitive to this difference, at least in the social condition, where the more novel positive feedback elicited a larger P3a, F(1, 32) = 10.18, MSE = 1.63, p = .003 (Merrors = 0.90 μV, SE = 0.50 vs. Mcorrects = 1.55 μV, SE = 0.53; Figure 3b). In the nonsocial condition, this difference was nonsignificant, but in the same direction, F(1, 32) = 2.02, MSE = 1.63, p = .17 (Merrors = 0.83 μV, SE = 0.47 vs. Mcorrects = 1.07 μV, SE = 0.49; Figure 3a). Additionally, we found that in the social condition only, RS interacted with feedback accuracy, F(1, 32) = 7.74, MSE = 1.63, p = .009 (nonsocial: F(1, 32) = 1.64, MSE = 1.63, p = .2). Further investigation of this interaction, however, revealed that neither the parameter estimate for corrects, b = −0.62, t(32) = −0.69, p = .47, nor errors, b = 0.33, t(32) = 0.39, p = .7, reached significance. Thus, the interaction was likely to have been driven primarily by the fact the slopes were in opposite directions. No other significant main effects or interactions were found between RS, gender, order in either condition (all Fs < 3.08, MSEs < 4.65, ps > .09).
The nonsigificant, but opposing, effects of RS on the P3a to corrects and errors, further motivated our analysis of the P3a difference wave (P3adiff; positive–negative feedback). As expected, this difference wave showed a significant effect of RS in the social condition only, F(1, 32) = 7.74, MSE = 3.27, p = .009.The simple slopes of this effect (see Figure 3c) illustrated that, as RS increased, the orienting response to common negative outcomes when conveyed via a disapproving face became more similar to that of rare positive outcomes conveyed through an approving face. Taken together with the previous analysis of the raw waves, it appears that this narrowing of the P3adiff in individuals high in RS was due both to a small reduction in the P3a to corrects and a small increase in the P3a to incorrects, rather than being driven by an RS-related change to only one of these feedback responses. This effect did not interact with gender, although the simple slopes suggest that it was stronger in women (see Figure 3c). The possibility that differences in attentional orienting to positive and negative feedback may ultimately be an important link between RS and subsequent memory is explored further in the meditational analyses below.
Response to learning feedback.
To address the relationship between neural activity during the presentation of the correct answer and subsequent learning success, we focused on confirming that negative-going activity from 400–800 ms over left inferior posterior electrodes (TP9/Cb1) was predictive of error correction, with the aim of replicating Dm effects previously found with this paradigm (e.g., Butterfield & Mangels, 2003). Indeed, as shown in Figure 4a-b, regardless of feedback condition, activity at these electrodes was more negative-going for correct answers (i.e., learning feedback) that were later correctly recalled at the retest compared to answers that were not, F(1, 36) = 25.25, MSE = 1.94, p < .001 (later corrected at retest: M = −3.43 μV, SD = 0.36; later not corrected at retest: M = −2.65 μV, SD = 0.37). As shown in Figure 3c, the scalp topography of the difference wave highlighting the “Dm effect” (i.e., later corrected – later not corrected) over the left hemisphere further supports the focal involvement of these posterior inferior electrodes in successful learning across all conditions.
The only interaction with memory that reached conventional levels of significance was a 3-way interaction between memory, gender, and electrode, F(1, 36) = 4.12, MSE = 0.38, p = .05. However, when we used Tukey’s HSD posthoc tests to examine the source of this interaction further, significant Dm effects were found at both sites, for both genders. Rather, the interaction appears to have arisen because the magnitude of the Dm effect was numerically larger at Cb1 for women and at TP9 for men, regardless of condition (see also Figure 4c). Yet, because both electrodes exhibited Dm effects for both genders, regardless of feedback condition and order, we averaged across these electrodes when creating the LERN that was entered into the mediation analysis.
For women in the social condition, the LERN was significantly correlated with retest performance (r = −.54, p < .02), as well as with RS (r = .46, p < .05). Consistent associations were observed for women in the nonsocial condition (LERN→Retest: r = −.39, p = .09, RS→LERN: r = .52, p < .03). However, for men, neither relationship reached significance in either condition (all r’s < −.25, p’s > .31). These non-significant correlations raise the possibility that for men, subsequent memory effects were not as strong at these selected electrodes as they were for women (see also Figure 4c).
The lack of strong LERN to retest behavior relationship in males was unexpected. However, Whiteman and Mangels (2016) similarly found that the LERN was a strong predictor of retest performance in women, but not in men, despite a similar finding of no gender effects in an ANOVA when comparing ERPs waveforms categorized as a function of later error correction (i.e., the Dm effect). Although we cannot rule out the possibility that the greater loss of learning feedback trials for males indicates that their ERPs to learning feedback were somewhat noisier, which would have affected our power to detect a strong relationship, this attrition was proportional across later corrected and not corrected items, and the percentage of retained trials was still high (85%). Alternatively, LERN effects may have been more robust elsewhere over the scalp in men, and it may be worthwhile for future studies to explore gender differences in the distribution of LERN (or Dm) effects for verbal associative learning. Nonetheless, for the purpose of providing a potential mediator to explain the RS effects on learning in women, the LERN associated with the left inferior posterior electrodes appears sufficient, having demonstrated a sufficiently strong relationship between both RS and retest outcomes in that group of electrodes.
Mediational Analysis.
For women in the social condition, RS was associated not only with behavioral learning outcomes (i.e., retest error correction), but also with response to evaluative and learning feedback events (i.e., performance evaluative feedback: P3adiff, learning opportunity: LERN). To assess whether responses to these feedback events were consistent with mediation of the relationship of RS to error correction, we entered these variables into path analyses (Figure 5) in which RS predicted error correction via the serially ordered P3a and LERN ERP components.
Figure 5: Path Diagrams of Hypothesized Process for the Effect of RS on Retest Error Correction (Retest Memory).
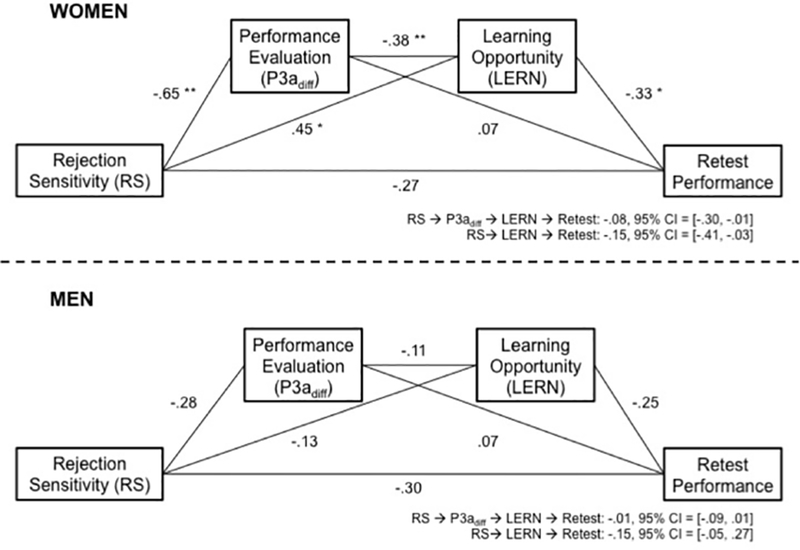
Numbers displayed are the standardized regression coefficients. The model shows that, for women, RS affects retest memory via the relative decrease in orienting to positive versus negative performance evaluative feedback (P3adiff) and poorer encoding of the learning opportunity (LERN). The social condition only is shown, for women and men separately. 95% Confidence intervals (CI) are indicated below each diagram for significant models. ** p < .01, * p < .05.
As in the previous analyses, we first regressed out individuals’ initial test scores from each of the variables and estimated unique paths for women and men, separately for nonsocial and social conditions. For this mediation model, the paths were allowed to vary by gender with emphasis on the female-specific paths. We estimated the model using Mplus (V7.3; Muthén & Muthén, 2012) and allowed the errors of each outcome variable to correlate with one another. Given the small sample and the likelihood of a violation of normality assumptions for testing the mediated path (Shrout & Bolger, 2002), we estimated bias-corrected bootstrapped confidence intervals for the individual effects and mediated paths.
In the social condition, for women, RS significantly predicted a smaller relative difference between the orienting response to negative and positive feedback (P3adiff; b = −0.65), which in turn predicted a more positive-going LERN to the corrective feedback (b = −.38), and which then predicted poorer error correction on the retest (b = −0.33). The resulting indirect effect through orienting to the evaluative feedback (P3adiff) and processing of the learning feedback (LERN) was significant, bRS→P3adiff→LERN→Retest = −0.08, 95% CI = [−0.30, −0.01], and rendered the direct effect non-significant. Notably, while the indirect effect of RS on error correction through the P3adiff alone was not significant, the effect of RS on error correction through the LERN by itself was significant, b = 0.45; bRS→LERN→Retest = −0.15, 95% CI = [−0.41, −0.03], reinforcing the necessity of study-phase engagement with the learning opportunity for successful error correction. Nonetheless, the relationship between the response to evaluative feedback and engagement with learning was the best predictor of retest performance.
None of the individual effects or indirect effects were significant for men when examining social feedback, other than a marginally significant effect of RS on attention (b = −0.28, 95% CI = [−0.57, 0.01], see also simple effects for the RS→P3diff relationship in Figure 3e). Finally, we conducted an exploratory analysis of a moderated mediation model in which women’s indirect paths from RS to error correction were compared to those of men. Though underpowered given that our total sample had only 40 participants, results suggested that the RS→P3adiff→LERN→Retest indirect path was in the predicted direction of being larger for women compared to men (bDiff = −0.08, 90% CI = [−0.25, 0.00]), and that the RS→LERN→Retest indirect path was also larger for women (bDiff = −0.18, 95% CI = [−0.63, 0.00].
In the nonsocial condition, this model confirmed the absence of a direct effect of RS on retest performance for both women and men (see S4a for model estimates). Interestingly, however, it did show a significant indirect effect of RS on error correction for women through the P3adiff and the LERN (bRS→P3adiff→LERN→Retest = −0.04, 95% CI = [−0.22, −0.01]). The magnitude of this effect was half of the parallel indirect effect for social feedback and appeared to be driven mainly by the relationship of the LERN to all three of the other factors in this path (RS, P3adiff, Retest). Though consistent with our hypotheses, we interpret the results of the nonsocial feedback model cautiously. We note that the bRS→P3adiff→Retest indirect effect was positive, consistent with a suppression effect, though it was not statistically significant. This path was not hypothesized, and while it could account for the apparent discrepancy in the total and indirect effects, it could also be due to sampling variability in this relatively small sample. For men, all path coefficients and indirect effects were non-significant. Furthermore, analysis of nonsocial cues using moderated mediation models provided no evidence of differences in the indirect paths of either women or men.
Discussion
The present study found that women who were high in RS exhibited worse error correction than women low in RS in an academically-challenging general knowledge retrieval task when error feedback was communicated in a socially disapproving manner from a male authority figure (i.e., online professor). Importantly, presenting this evaluative feedback in a nonsocial and private manner all but eliminated the direct effect of RS on learning in women. Men’s learning was not significantly impacted by their level of RS regardless of how feedback was delivered.
The event-related potentials (ERPs) recorded during presentation of the evaluative feedback and learning opportunity provided insight into the neurocognitive mechanisms mediating these RS effects. RS did not appear to influence initial face processing (N170; see S2) or registration of feedback valence (FRN) for either social or nonsocial feedback (see also Kawamoto, Nittono, & Ura, 2015). Yet, as evidenced by the significant effect of RS on the P3adiff to social feedback (regardless of gender), RS appeared to somewhat blunt the difference between orienting to the infrequent (~35%) positive social feedback and orienting to the frequent (~65%) negative social feedback. Gender-specific mediation analyses demonstrated that, for women but not men, this RS-related change in orienting response was associated with reduced learning-relevant activity over left-inferior-posterior sites (LERN) when participants were presented with a learning opportunity. This reduced activity, suggestive of failure to engage effectively with the learning opportunity, was ultimately associated with the reduced ability of women with high RS to later correct their errors relative to those with low RS. Moderated mediation analyses further suggested a larger indirect influence in women compared to men.
These results highlight the role that RS plays in orienting to interpersonal threat. Although our findings confirmed our hypothesis that RS would play a more important role in moderating the orientation to the performance feedback when it was interpersonal, compared to private, it was somewhat surprising to find that RS did not influence the absolute amplitude of the response to either negative (or positive) feedback, and rather only significantly influenced the relative difference in anterior P3a between negative and positive feedback (i.e., P3adiff). Specifically, individuals high in RS appeared to treat positive and negative socially communicated outcomes as more equivalent in salience than individuals low in RS, even though positive feedback was much more novel in the context of this task, and there were no differences in the frequency (or confidence) of either error or correct responses across condition, gender, or RS.
The possibility that high RS slightly raised the overall salience of negative social feedback closer to that of positive feedback would be consistent with behavioral evidence of heightened attentional vigilance toward social threat cues (Berenson et al., 2009; Downey et al., 2004; Zayas et al., 2009). Additionally, it may be influenced by reduced habituation to this feedback, even as it became clear to participants that despite their best efforts, it was going to be the dominant outcome. Relevant to this hypothesis, Olsson et al. (2013) found that individuals high in RS were more resistant to extinction of a conditioned threat response to an angry face than to other stimuli, suggesting more difficulty down-regulating threat responses in association with changes in negative stimulus probability. However, given that both RS and the LERN were only significantly related to the P3adiff, some aspect of this effect appears to also have been influenced by the response to positive feedback. One possibility is that pervasive negative feedback may also have blunted, rather than enhanced, orienting to positive outcomes for individuals high in RS. Given that high RS can bias individuals toward seeing rejection in others’ behavior (Downey & Feldman, 1996) and facial expressions (Romero-Canyas & Downey, 2013), it is also possible that they may not have found the positive feedback to be as unambiguously positively valenced as did individuals low in RS.
We also found that high RS played an important role in predicting learning outcomes for women, but not men. In the social condition, we were able to define a model whereby the influence of RS on women’s error correction was mediated through altered orienting to performance feedback, as indexed by the P3adiff, and reduced processing of learning feedback, as indexed by the left-inferior-posterior negativity (LERN). Disengagement from the performance feedback and deep engagement with the learning opportunity is particularly important for this task. Here, although negative performance-evaluative feedback informs the participant that their self-generated answer is incorrect, participants cannot infer the correct answer directly from this feedback. Many questions have numerous plausible-sounding, incorrect responses (see http://www.mangelslab.org/bknorms), and thus, only the learning feedback can definitively provide the specific information necessary for error correction.
It is possible that the altered orienting to negative feedback directly disrupted processing of the learning opportunity in RS, either because women high in RS were less able to disengage from the social threat once it was identified, or because after this initial orienting, they actively disengaged from the rest of the trial in order to reduce further distress (see also Berenson et al., 2009 for evidence of this vigiliance-avoidance pattern). Alternatively, RS may have simply independently influenced how women responded to both the performance and learning feedback, without these feedback responses directly influencing each other. Indeed, for men in the social condition, RS influenced the P3adiff without affecting the LERN or subsequent memory. Furthermore, while the mediation model we describe is consistent with the temporal order of the measured effects, we cannot rule out other plausible, untested explanations for the observed findings, and thus, inferences about causality should be appropriately conservative.
It is worth noting that even in the nonsocial condition, where RS did not have a significant direct effect on error correction for either women or men, high RS was still associated with a reduced LERN in women (see S4a). Even when negative feedback was not explicitly social and measures were taken to make feedback appear private to the participant, it may have been difficult for women high in RS to entirely ignore the contextual social cue that they were taking part in an experiment that was monitored by an experimenter. This context may have had negative consequences for how they processed learning opportunities even if it wasn’t enough to significantly impair error correction when tested a day later. It is possible that negative effects would have been more apparent if tested after a longer delay (~1 week). Indeed, LERN remains a strong predictor of error correction regardless of whether memory is tested immediately, within 1–2 days, or after a week (Butterfield & Mangels, 2003; Mangels et al., 2012), whereas the relationship of the P3a to error correction is strongest when memory is tested immediately (Butterfield & Mangels, 2003).
Gender differences
Our finding that RS impacted women’s ability to engage with learning opportunities after negative social evaluative feedback (compared to nonsocial, private feedback) is highly consistent with London et al. (2012) and extends that work, both by showing direct effects on learning outcomes, and by demonstrating potential neurocognitive mediators of these effects. Similar to London et al. (2012), RS effects were also observed in the presence of a male professor. However, we additionally demonstrated that such effects could emerge even when RS was defined more generally through the RS-Personal scale, rather than specifically through the gender-RS scale. When defined through the RS-Personal scale, RS also impacted men’s orienting to the social feedback in a qualitatively similar way to women, but the effect was weaker, and it was not related to downstream learning, as measured either behaviorally (i.e., error correction) and/or physiologically (i.e., LERN). Although we cannot rule out the possibility that the LERN was not related to RS because it was not the best correlate of subsequent memory for this group, importantly there was no evidence that RS effects on orienting to performance feedback disrupted men’s behavioral performance on the retest. Thus, even if a better neural correlate of learning had been found, it is unlikely that it would have been related to RS.
The more limited effects of RS for men are consistent with much prior research and supports our view that while men and women are equally susceptible to social threat, the situations that elicit it may differ (Romero-Canyas, et al., 2010b). Perhaps framing the task in an academic context may have contributed in part to RS being less of a liability for men. Romero-Canyas, et al. (2010b) found that men high in RS reacted primarily to devaluation of their peer group status, whereas women high in RS reacted to devaluation by an individual who mattered to them. This task did not particularly emphasize normative status relative to a group.
Some research also suggests that women have greater levels of intrinsic motivation for academic learning more generally (Vallerand et al., 1992; but see Cokley, Bernard, Cunningham, & Motoike, 2001), and this task was specifically designed to measure intrinsic engagement with learning opportunities. Although greater intrinsic motivation to succeed academically may have increased women’s engagement with the task as a whole, and with the learning opportunity in particular, it would have simultaneously increased the threat caused by negative feedback for those high in RS. To the extent that women self-identify more strongly with academic learning than men, these results would be consistent with (Romero-Canyas, 2010b)’s observation that the impact of RS will be evident only in domains with which individuals, reflecting their sociocultural histories, are strongly identified and, thus, where feedback about acceptance and rejection is self-defining. Although we found no gender differences and/or RS effects on our post-test measures of task investment, we cannot rule out the possibility that this single retrospective self-report question did not adequately capture qualitative or quantitative differences in motivation within the current task.
Interestingly, the pattern of RS effects on women’s error correction in the social condition also suggests that women had a general advantage in this task that was suppressed when coupled with high RS, rather than that high RS impaired their ability to learn relative to men. Specifically, women low in RS significantly outperformed men low in RS, but the performance of men and women high in RS did not differ significantly. Although the source of the advantage for women in the social condition is unclear, past work in our lab with nonsocial evaluative feedback has found that women tend to underperform relative to men on the initial test, which primarily taps semantic memory, but outperform men on error correction at the surprise retest, which relies heavily on episodic memory for new associations (Whiteman & Mangels, 2016; see also Abraham & Mangels, in prep). Such findings are broadly consistent with the advantage for women often found in verbal and episodic memory tasks (for a review, see Herlitz & Rehnman, 2008). In the present study, the advantage for women was limited to the social condition, however, suggesting some additional memory facilitation from use of facial stimuli and/or an interpersonal context, possibly related to women’s superior sensitivity to subtle facial expressions (Hampson, van Anders, & Mullin, 2006), and desire to maintain interpersonal relationships (e.g., Baumeister & Leary, 1995). Indeed, as a group, the women in the present study demonstrated greater consistency in labeling the facial expressions accurately than did the men.
Caveats and Implications
Future research will need to establish the generalizability of the results beyond this specific task and sample. Although encoding and retrieval of verbal general knowledge is not a domain where women typically experience a stereotype of poor performance based on gender identity (i.e., stereotype threat; Steele & Aronson, 1995), future studies that include a condition with an authoritative female professor would help disentangle whether deleterious effects of RS for women are specific to the presence of the authoritative man, or are evident in any social evaluative situation where interpersonal relationships are salient. With regard to the null effects (nonsocial) or weak benefits (social) of RS on men’s performance, the findings of (Romero-Canyas, et al., 2010b) suggest that negative consequences of RS might be observed in a task where negative feedback lowered social status in a domain for which the male participants were highly self-identified. It is also possible that an authoritative female might have more negatively impacted the performance of male students who were high in RS in the present task.
This study provides the first concrete evidence supporting predictions based on prior research that women high in RS respond to rejection and disapproval in ways that compromise their use of new information (London et al., 2012). By expanding understanding of the neural basis through which rejection cues disrupt the attention deployment in individuals high in RS, we also gain opportunities to intervene. Prior behavioral evidence supports the view that the ability to control attention moderates the relationship between RS and interpersonal and personal difficulties (Ayduk et al., 2000). Our research highlights how disruptions in the normal pattern of orienting to positive and negative social cues are related to downstream effects on the encoding of corrective information and consequently interfere with error remediation. If similar processes operate during social interactions imbued with cues that convey the possibility of discrimination, peer rejection, and social exclusion, distortions in attention to positive and negative social cues by people high in RS may inhibit their ability to use new information that may change their view of how the interaction is going. It will be important to address this question in future research.
Conclusion
Although rejection is a ubiquitous phenomenon, for some people, previous experiences with harsh and reoccurring rejection have led to biases in their detection and interpretation of rejection cues and experiences. Previous research has identified these individuals as being high in RS (Downey & Feldman, 1996). By definition, individuals high in RS tend to anxiously expect and readily perceive rejection in others’ behavior and use a variety of self-protective strategies, including self-silencing, disengaging, or lashing out, with each strategy entailing different costs for wellbeing and achievement.
In this study, we expanded the RS model by demonstrating that high RS can undermine even higher-order processes like the encoding and retrieval of corrective information. We also identified important moderators of this relationship (i.e., attention, gender, social context) raising the possibility that that this research can be expanded to better understand the contexts and mechanisms (e.g., disengagement) by which interpersonal and/or identity-based fears of rejection or devaluation undermine learning and ultimately achievement in a wider range of domains and groups. Such an extension is particularly important given that research has consistently shown that environments that diminish sense of belonging can compromise academic engagement (e.g., Cohen & Swim, 1995; Inzlicht & Ben-Zeev, 2000; London et al., 2012; Mendoza-Denton, Downey, Purdie, Davis, & Pietrzak, 2002). Such research could identify avenues for interventions for individuals high in RS by training them to use self-regulatory strategies (e.g., mindfulness) when under rejection threat that reduce cognitive biases and augment information processing in ways that support learning. It can also help to highlight the links between the ways in which feedback is given and subsequent learning.
Supplementary Material
Footnotes
Conflicts of Interest and Source of Funding: The authors have no conflicts of interest to report. This study was supported by the National Institutes of Health under grant (R01 MH081948) awarded to Geraldine Downey.
The RS-personal version of the RSQ was not originally normed on Asian-Americans. Studies suggest that certain items may skew sample RS scores in this population due to violation of cultural norms (i.e., asking parents for money or asking your parent about advice on a romantic college relationship; Chao & Tseng, 2002). Although we had a large Asian-American sample, Cronbach’s Alpha met acceptable cutoffs for the sample as a whole regardless of whether culturally-biased items were removed (.80) or not (.74). Additionally, the average RS score for Asian-American participants (M = 9.9, SD = 2.79) was not statistically different from the rest of the sample (M = 10.7, SD = 2.89), t(35) = .854; p = .33. Therefore, we proceeded to use the entire RS score in our analyses.
The absence of the P2 and delayed onset of the FRN in the social compared to nonsocial condition were likely the result of the greater perceptual and social complexity of the face, and potentially linked to the enhanced occipito-temporal N170 typically observed for face in comparison to non-face stimuli (e.g. Bentin, Allison, Puce, Perez, & McCarthy, 1996). In a supplemental analysis (see S2), however, we did not find any effects of RS or gender on the N170 amplitude, consistent with findings from Kawamoto, Nittono, & Ura (2015). Thus, to the extent that RS effects are observed at the FRN/P3a, they are likely resulting from enhanced orienting to the personal relevance of the stimuli, rather than to perceptual differences in initial detection of the facial expression.
We did not include RS in this analysis for two reasons. First, the purpose of this analysis was only to confirm a Dm effect at these sites for all groups and conditions, which would permit us to include activity at these sites in our mediation models regardless of gender or condition. Second, any RS interactions with memory effects here, where memory is treated categorically (i.e., corrected vs. not corrected), would have been more difficult to interpret than RS relationships to the overall learning-feedback ERP amplitude. Indeed, the relationship between RS and the LERN is a central part of the mediation model.
Given the broad central scalp distribution of the FRN and P3a (see Figure 3a-b), we also analyzed these waveforms at FCz. Our past studies using non-social stimuli have found that the FRN at FCz was sensitive to feedback valence (correct vs. error), and the P3a was sensitive to feedback frequency/expectancy of feedback (Butterfield & Mangels, 2003; Mangels et al., 2006). In contrast, only the more anterior P3a at Fz was additionally influenced by individual differences in the motivational relevance of the feedback (Mangels et al., 2006). We appear to replicate that distinction here.
When RS was included in the model, the FRN at FCz was more negative-going for negative than positive feedback in the non-social condition, F(1,32) = 4.19, MSE = 1.20, p < .05, but not in the social condition, F(1,32) = 1.45, MSE = 1.12, p = .2. With RS removed from the model, however, significant effects of feedback valence emerged in both conditions (Fs > 84.0, ps < .001). As with the FRN at Fz, however, no main effects or interactions were found with order, gender, condition or RS for either FRN at FCz (raw waves or difference wave; all Fs < 3.5, ps > .07).
With regard to the P3a, when this waveform measured at FCz, it was only sensitive to feedback valence in the social condition, similar to measurements at Fz. Unlike at Fz, however, this difference was only significant when RS was not included in the model. Specifically, without RS in the model, the social P3a at FCz was significantly more positive for the rarer positive feedback, F(1, 36) = 5.6, MSE = 1.8, p < .03, an effect that was moderated by gender, F(1, 36) = 7.8, MSE = 1.8, p < .01, with post hoc comparisons indicating that valence effects were significant only in women (see also Figure 3d). Once RS was introduced into the model, however, no main effects or interactions with feedback valence, order, gender or RS emerged (raw waves or difference wave; all Fs < 2.3, ps > .13). This null result demonstrates an important contrast to the significant interaction between RS and accuracy found at Fz for this condition. In the non-social condition, the difference between positive and negative feedback was not significant regardless of whether RS was included in the model, F(1, 32) = 0.60, p = .44, or not, F(1, 36) = 2.8, p = .10 (see also effects at Fz). When including RS in the analysis of the P3a at FCz, no significant main effects of RS or interactions between RS and any other variable reached conventional levels of significance (raw waves or difference wave; all Fs < 3.4, ps > .07).
References
- Abraham D & Mangels JA (in prep). “A for Effort: The effects of extrinsic reward on motivation and learning after failure.”
- Aiken LS, & West SG (1991). Multiple regression: Testing and interpreting interactions. Newbury Park, CA: SAGE. [Google Scholar]
- Arbel Y, Goforth K, & Donchin E (2013). The good, the bad, or the useful? The examination of the relationship between the feedback-related negativity (FRN) and long-term learning outcomes. Journal of Cognitive Neuroscience, 25(8), 1249–1260. 10.1162/jocn_a_00385 [DOI] [PubMed] [Google Scholar]
- Arbel Y, & Wu H (2016). A Neurophysiological examination of quality of learning in a feedback-based learning task. Neuropsychologia, 93, 13–20. 10.1016/j.neuropsychologia.2016.10.001 [DOI] [PubMed] [Google Scholar]
- Audia PG, & Locke EA (2004). Benefiting from negative feedback. Human Resource Management Review, 13(4), 631–646. 10.1016/j.hrmr.2003.11.006 [DOI] [Google Scholar]
- Ayduk O, Mendoza-Denton R, Mischel W, Downey G, Peake PK, & Rodriguez M (2000). Regulating the interpersonal self: Strategic self-regulation for coping with rejection sensitivity. Journal of Personality and Social Psychology, 79(5), 776–792. 10.1037/0022-3514.79.5.776 [DOI] [PubMed] [Google Scholar]
- Baumeister RF, & Leary MR (1995). The need to belong: Desire for interpersonal attachments as a fundamental human motivation. Psychological Bulletin, 117(3), 497–529. 10.1037/0033-2909.117.3.497 [DOI] [PubMed] [Google Scholar]
- Beck AT, Steer RA, & Brown GK (1996). Beck depression inventory manual (2nd ed.). San Antonio, TX: Psychological Corporation. [Google Scholar]
- Bentin S, Allison T, Puce A, Perez E, & McCarthy G (1996). Electrophysiological studies of face perception in humans. Journal of Cognitive Neuroscience, 8(6), 551–565. 10.1162/jocn.1996.8.6.551 [DOI] [PMC free article] [PubMed] [Google Scholar]
- Berenson KR, Gyurak A, Ayduk Ö, Downey G, Garner MJ, Mogg K, … Pine DS(2009). Rejection sensitivity and disruption of attention by social threat cues. Journal of Research in Personality, 43(6), 1064–1072. 10.1016/j.jrp.2009.07.007 [DOI] [PMC free article] [PubMed] [Google Scholar]
- Binder JR, & Desai RH (2011). The neurobiology of semantic memory. Trends in Cognitive Sciences, 15(11), 527–536. 10.1016/j.tics.2011.10.001 [DOI] [PMC free article] [PubMed] [Google Scholar]
- Burklund LJ, Eisenberger NI, & Lieberman MD (2007). The face of rejection: Rejection sensitivity moderates dorsal cingulate activity to disapproving facial expressions. Social Neuroscience, 2(3–4), 238–253. 10.1080/17470910701391711 [DOI] [PMC free article] [PubMed] [Google Scholar]
- Butterfield B, & Mangels JA (2003). Neural correlates of error detection and correction in a semantic retrieval task. Cognitive Brain Research, 17(3), 793–817. 10.1016/S0926-6410(03)00203-9 [DOI] [PubMed] [Google Scholar]
- Butterfield B, & Metcalfe J (2001). Errors committed with high confidence are hypercorrected. Journal of Experimental Psychology: Learning, Memory, and Cognition, 27(6), 1491–1494. 10.1037/0278-7393.27.6.1491 [DOI] [PubMed] [Google Scholar]
- Chapman HA, & Anderson AK (2013). Things rank and gross in nature: A review and synthesis of moral disgust. Psychological Bulletin, 139(2), 300–327. 10.1037/a0030964 [DOI] [PubMed] [Google Scholar]
- Cohen LL, & Swim JK (1995). The differential impact of gender ratios on women and men: Tokenism, self-confidence, and expectations. Personality and Social Psychology Bulletin, 21(9), 876–884. 10.1177/0146167295219001 [DOI] [Google Scholar]
- Cohen MX, Elger CE, & Ranganath C (2007). Reward expectation modulates feedback-related negativity and EEG spectra. NeuroImage, 35(2), 968–978. 10.1016/j.neuroimage.2006.11.056 [DOI] [PMC free article] [PubMed] [Google Scholar]
- Cokley KO, Bernard N, Cunningham D, & Motoike J (2001). A psychometric investigation of the academic motivation scale using a united states sample. Measurement and Evaluation in Counseling and Development, 34(2), 109–19. [Google Scholar]
- Downey G, & Feldman SI (1996). Implications of rejection sensitivity for intimate relationships. Journal of Personality and Social Psychology, 70(6), 1327–1343. 10.1037/0022-3514.70.6.1327 [DOI] [PubMed] [Google Scholar]
- Downey G, Mugious V, Ayduk O, London B, & Shoda Y (2004). Rejection sensitivity and the startle response to rejection cues: A defensive motivational system. Psychological Science, 15(10), 668–673. 10.1111/j.0956-7976.2004.00738.x [DOI] [PubMed] [Google Scholar]
- Dweck CS (2006). Mindset: The new psychology of success. New York: Random House. [Google Scholar]
- Ehrlich KB, Gerson SA, Vanderwert RE, Cannon EN, & Fox NA (2015). Hypervigilance to rejecting stimuli in rejection sensitive individuals: Behavioral and neurocognitive evidence. Personality and Individual Differences, 85, 7–12. 10.1016/j.paid.2015.04.023 [DOI] [PMC free article] [PubMed] [Google Scholar]
- Eisenberger NI, Inagaki TK, Muscatell KA, Haltom KEB, & Leary MR (2011). The neural sociometer: Brain mechanisms underlying state self-esteem. Journal of Cognitive Neuroscience, 23(11), 3448–3455. 10.1162/jocn_a_00027 [DOI] [PubMed] [Google Scholar]
- Eisenberger NI, Lieberman MD, & Williams KD (2003). Does rejection hurt: An fMRI study of social exclusion. Science, 302(5643), 290–292. 10.1126/science.1089134 [DOI] [PubMed] [Google Scholar]
- Ernst B, & Steinhauser M (2012). Feedback-related brain activity predicts learning from feedback in multiple-choice testing. Cognitive, Affective, & Behavioral Neuroscience, 12(2), 323–336. 10.3758/s13415-012-0087-9 [DOI] [PubMed] [Google Scholar]
- Foti D, & Hajcak G (2009). Depression and reduced sensitivity to non-rewards versus rewards: Evidence from event-related potentials. Biological Psychology, 81(1), 1–8. 10.1016/j.biopsycho.2008.12.004 [DOI] [PubMed] [Google Scholar]
- Friedman D, Cycowicz YM, & Gaeta H (2001). The novelty P3: An event-related brain potential (ERP) sign of the brain’s evaluation of novelty. Neuroscience & Biobehavioral Reviews, 25(4), 355–373. 10.1016/S0149-7634(01)00019-7 [DOI] [PubMed] [Google Scholar]
- Gehring WJ, Goss B, Coles MGH, Meyer DE, & Donchin E (1993). A neural system for error detection and compensation. Psychological Science, 4(6), 385–390. 10.1111/j.1467-9280.1993.tb00586.x [DOI] [Google Scholar]
- Grant H, & Dweck CS (2003). Clarifying achievement goals and their impact. Journal of Personality and Social Psychology, 85(3), 541–553. 10.1037/0022-3514.85.3.541 [DOI] [PubMed] [Google Scholar]
- Gu R, Huang Y, & Lou Y (2009). Anxiety and outcome evaluation: An ERP study. Neuroscience Research, 65, S229. [Google Scholar]
- Hampson E, van Anders SM, & Mullin LI (2006). A female advantage in the recognition of emotional facial expressions: Test of an evolutionary hypothesis. Evolution and Human Behavior, 27(6), 401–416. 10.1016/j.evolhumbehav.2006.05.002 [DOI] [Google Scholar]
- Hattie J, & Timperley H (2007). The power of feedback. Review of Educational Research, 77(1), 81–112. 10.3102/003465430298487 [DOI] [Google Scholar]
- Herlitz A, & Rehnman J (2008). Sex Differences in Episodic Memory. Current Directions in Psychological Science, 17(1), 52–56. 10.1111/j.1467-8721.2008.00547.x [DOI] [Google Scholar]
- Holroyd CB, & Coles MGH (2002). The neural basis of human error processing: Reinforcement learning, dopamine, and the error-related negativity. Psychological Review, 109(4), 679–709. 10.1037/0033-295X.109.4.679 [DOI] [PubMed] [Google Scholar]
- Holroyd CB, & Yeung N (2012). Motivation of extended behaviors by anterior cingulate cortex. Trends in Cognitive Sciences, 16(2), 122–128. 10.1016/j.tics.2011.12.008 [DOI] [PubMed] [Google Scholar]
- Huang WJ, Chen WW, & Zhang X (2015). The neurophysiology of the P300: An integrated review. European Review for Medical and Pharmacological Sciences, 19, 1480–1488. [PubMed] [Google Scholar]
- Inzlicht M, & Ben-Zeev T (2000). A threatening intellectual environment: Why females are susceptible to experiencing problem-solving deficits in the presence of males. Psychological Science, 11(5), 365–371. [DOI] [PubMed] [Google Scholar]
- Kawamoto T, Nittono H, & Ura M (2015). Trait rejection sensitivity is associated with vigilance and defensive response rather than detection of social rejection cues. Frontiers in Psychology, 6, 1–14. 10.3389/fpsyg.2015.01516 [DOI] [PMC free article] [PubMed] [Google Scholar]
- Kluger AN, & DeNisi A (1996). The effects of feedback interventions on performance: A historical review, a meta-analysis, and a preliminary feedback intervention theory. Psychological Bulletin, 119(2), 254–284. 10.1037/0033-2909.119.2.254 [DOI] [Google Scholar]
- Knight RT (1984). Decreased response to novel stimuli after prefrontal lesions in man. Electroencephalography and Clinical Neurophysiology/Evoked Potentials Section, 59(1), 9–20. 10.1016/0168-5597(84)90016-9 [DOI] [PubMed] [Google Scholar]
- Knight RT (1996). Contribution of human hippocampal region to novelty detection. Nature, 383(6597), 256–259. [DOI] [PubMed] [Google Scholar]
- London B, Downey G, Romero-Canyas R, Rattan A, & Tyson D (2012). Gender-based rejection sensitivity and academic self-silencing in women. Journal of Personality and Social Psychology, 102(5), 961–979. 10.1037/a0026615 [DOI] [PubMed] [Google Scholar]
- Luck SJ, & Gaspelin N (2017). How to get statistically significant effects in any ERP experiment (and why you shouldn’t). Psychophysiology, 54(1), 146–157. 10.1111/psyp.12639 [DOI] [PMC free article] [PubMed] [Google Scholar]
- Luft CD (2014). Learning from feedback: The neural mechanisms of feedback processing facilitating better performance. Behavioral Brain Research, 261, 356–368. 10.1016/j.bbr.2013.12.043 [DOI] [PubMed] [Google Scholar]
- Mangels JA, Butterfield B, Lamb J, Good C, & Dweck CS (2006). Why do beliefs about intelligence influence learning success? A social cognitive neuroscience model. Social Cognitive and Affective Neuroscience, 1(2), 75–86. 10.1093/scan/nsl013 [DOI] [PMC free article] [PubMed] [Google Scholar]
- Mangels JA, Good C, Whiteman RC, Maniscalco B, & Dweck CS (2012). Emotion blocks the path to learning under stereotype threat. Social Cognitive and Affective Neuroscience, 7(2), 230–241. 10.1093/scan/nsq100 [DOI] [PMC free article] [PubMed] [Google Scholar]
- Mangels JA, Picton TW, & Craik FIM (2001). Attention and successful episodic encoding: An event-related potential study. Cognitive Brain Research, 11(1), 77–95. 10.1016/S0926-6410(00)00066-5 [DOI] [PubMed] [Google Scholar]
- Mendoza-Denton R, Downey G, Purdie VJ, Davis A, & Pietrzak J (2002). Sensitivity to status-based rejection: Implications for African American students’ college experience. Journal of Personality and Social Psychology, 83(4), 896–918. 10.1037/0022-3514.83.4.896 [DOI] [PubMed] [Google Scholar]
- Morrison EW, & Bies RJ (1991). Impression management in the feedback-seeking process: A literature review and research agenda. The Academy of Management Review, 16(3), 522–541. 10.2307/258916 [DOI] [Google Scholar]
- Muthén LK, & Muthén BO (2012). Mplus user’s guide (7th ed.). Los Angeles, CA: Muthén & Muthén. [Google Scholar]
- Olsson A, Carmona S, Downey G, Bolger N, & Ochsner KN (2013). Learning biases underlying individual differences in sensitivity to social rejection. Emotion, 13(4), 616–621. 10.1037/a0033150 [DOI] [PMC free article] [PubMed] [Google Scholar]
- Paller KA, & Wagner AD (2002). Observing the transformation of experience into memory. Trends in Cognitive Sciences, 6(2), 93–102. 10.1016/S1364-6613(00)01845-3 [DOI] [PubMed] [Google Scholar]
- Polich J (2007). Updating P300: An integrative theory of P3a and P3b. Clinical Neurophysiology, 118(10), 2128–2148. 10.1016/j.clinph.2007.04.019 [DOI] [PMC free article] [PubMed] [Google Scholar]
- Romero-Canyas R, & Downey G (2013). What I see when I think it’s about me: People low in rejection-sensitivity downplay cues of rejection in self-relevant interpersonal situations. Emotion, 13(1), 104–117. 10.1037/a0029786 [DOI] [PubMed] [Google Scholar]
- Romero-Canyas R, Downey G, Berenson K, Ayduk O, & Kang NJ (2010a). Rejection Sensitivity and the Rejection–Hostility Link in Romantic Relationships. Journal of Personality, 78(1), 119–148. 10.1111/j.1467-6494.2009.00611.x [DOI] [PubMed] [Google Scholar]
- Romero-Canyas R, Downey G, Reddy KS, Rodriguez S, Cavanaugh TJ, & Pelayo R (2010b). Paying to belong: When does rejection trigger ingratiation? Journal of Personality and Social Psychology, 99(5), 802–823. 10.1037/a0020013 [DOI] [PMC free article] [PubMed] [Google Scholar]
- Shrout PE, & Bolger N (2002). Mediation in experimental and nonexperimental studies: New procedures and recommendations. Psychological Methods, 7(4), 422–445. 10.1037/1082-989X.7.4.422 [DOI] [PubMed] [Google Scholar]
- Shute VJ (2008). Focus on formative feedback. Review of Educational Research, 78(1), 153–189. 10.3102/0034654307313795 [DOI] [Google Scholar]
- Simons RF (2010). The way of our errors: Theme and variations. Psychophysiology, 47(1), 1–14. 10.1111/j.1469-8986.2009.00929.x [DOI] [PubMed] [Google Scholar]
- Spielberger CD, Gorsuch RL, Lushene R, Vagg PR, & Jacobs GA (1983). Manual for the state-trait anxiety inventory. Palo Alto, CA: Consulting Psychologists Press. [Google Scholar]
- Steele CM, & Aronson J (1995). Stereotype threat and the intellectual test performance of African Americans. Journal of Personality and Social Psychology, 69(5), 797–811. 10.1037/0022-3514.69.5.797 [DOI] [PubMed] [Google Scholar]
- Taras M (2003). To feedback or not to feedback in student self-assessment. Assessment & Evaluation in Higher Education, 28(5), 549–565. [Google Scholar]
- Tottenham N, Borscheid A, Ellertsen K, Marcus D, & Nelson CA (2002). The NimStim face set. Retrieved from http://www.macbrain.org/faces/index.htm [Google Scholar]
- Vallerand RJ, Pelletier LG, Blais MR, Briere NM, Senecal C, & Vallieres EF (1992). The academic motivation scale: A measure of intrinsic, extrinsic, and amotivation in education. Educational and Psychological Measurement, 52(4), 1003–1017. 10.1177/0013164492052004025 [DOI] [Google Scholar]
- van der Helden J, Boksem MAS, & Blom JHG (2010). The importance of failure: Feedback-related negativity predicts motor learning efficiency. Cerebral Cortex, 20(7), 1596–1603. 10.1093/cercor/bhp224 [DOI] [PubMed] [Google Scholar]
- Warren CM, Hyman JM, Seamans JK, & Holroyd CB (2015). Feedback-related negativity observed in rodent anterior cingulate cortex. Journal of Physiology-Paris, 109(1–3), 87–94. 10.1016/j.jphysparis.2014.08.008 [DOI] [PubMed] [Google Scholar]
- Westphal M, Bonanno GA, & Mancini AD (2014). Attachment and attentional biases for facial expressions of disgust. Journal of Social and Clinical Psychology, 33(2), 169–186. https://doi.org/http://dx.doi.org/101521jscp2014332169 [Google Scholar]
- Whiteman RC, & Mangels JA (2016). Rumination and rebound from failure as a function of gender and time on task. Brain Sciences, 6(1), 7 10.3390/brainsci6010007 [DOI] [PMC free article] [PubMed] [Google Scholar]
- Yeager DS, Purdie-Vaughns V, Garcia J, Apfel N, Brzustoski P, Master A, … Cohen GL (2014). Breaking the cycle of mistrust: Wise interventions to provide critical feedback across the racial divide. Journal of Experimental Psychology: General, 143(2), 804–824. 10.1037/a0033906 [DOI] [PubMed] [Google Scholar]
- Zayas V, Shoda Y, Mischel W, Osterhout L, & Takahashi M (2009). Neural responses to partner rejection cues. Psychological Science, 20(7), 813–821. 10.1111/j.1467-9280.2009.02373.x [DOI] [PMC free article] [PubMed] [Google Scholar]
Associated Data
This section collects any data citations, data availability statements, or supplementary materials included in this article.