Abstract
Although salt formation is the most ubiquitous and effective method of increasing the solubility and dissolution rates of acidic and basic drugs, it consumes large quantities of organic solvents and is a batch process. Herein, we show that the dissolution rate of indomethacin (a poorly water-soluble drug) can be increased by using hot melt extrusion of a 1:1 (mol/mol) indomethacin:tromethamine mixture to form a highly crystalline salt, the physicochemical properties of which are investigated in detail. Specifically, pH–solubility studies demonstrated that this salt exhibited a maximal solubility of 19.34 mg/mL (>1000 times that of pure indomethacin) at pH 8.19. A solvent evaporation technique was also used for salt formation. Spectroscopic analyses (infrared, nuclear magnetic resonance) of both; demonstrated, in situ salt formation with proton transfer. Powder X-ray diffraction and differential scanning calorimetry confirmed the crystalline nature of salts formed by both methods. Even though a number of amorphous salts of acidic drugs have been reported, the formation of a crystalline salt of an acidic drug by hot melt extrusion is completely unprecedented, which makes this study an important benchmark for the pharmaceutical production industry.
Keywords: crystalline salt, indomethacin, tromethamine, hot melt extrusion, solution-phase NMR
1. Introduction
Molecular modeling and high-throughput screening have enabled the discovery of numerous pharmaceutically active small molecules, the development and commercialization of which, however, are often hindered by poor solubility in aqueous media, low bioavailability, and high toxicity [1]. Therefore, a number of techniques (e.g., amorphous solid dispersion, amorphous solid solution, salt formation, co-crystal formation, surface modification, cyclodextrin complexation, and the use of self-emulsifying systems) have been developed to improve the dissolution and thus increase the bioavailability of poorly water-soluble drugs [2].
Since many drugs are weak acids or weak bases thus they can easily form salts with suitable counter ions, the biopharmaceutical properties of new drug candidates are most commonly improved by salt formation [3,4]. More than 50% of marketed drugs are available in salt form, making salt formation the preferred solubilization technique. In view of the fact that salt formation is an acid-base reaction involving a neutralization reaction or proton transfer from the acidic moiety to the basic group and usually requires low activation energy, it is theoretically applicable to all compounds with acidic or basic properties. The relative strength of the acid or base is particularly important, determining whether or not salt formation occurs and being a measure of the stability of the resulting salt [5]. In the pharmaceutical industry, salts are typically produced in solution by batch processing, which leads to the consumption of large amounts of solvents [6]. Although the above approach allows one to control the process rate and yield, the use of solvents can harm the environment, jeopardize patient health, and incur additional costs due to variability issues and batch processes will delay its commercialization [7]. Moreover, the need to remove solvents at the end of the reaction results in the exposure of the salt to stimuli such as heat, which may cause other problems [8]. Therefore, salt formation is often performed as a multistep process [9].
A cleaner, greener, and more productive approach corresponds to salt formation facilitated by an input of mechanical and/or thermal energy. Although HME has been extensively used in the plastics industry since the 1930s, research and development within the pharmaceutical manufacturing industry over the past two decades has propelled this technique as an alternative “platform technology” for solid dosage form development. HME offers distinct advantages over traditional pharmaceutical formulation techniques, i.e., it is a solvent-free technique, allows continuous operation and thus requires fewer processing steps, does not require major downstream processing such as compression, and is known to improve bioavailability [10,11]. Literature presents salt formation, but in their amorphous forms [12,13], which are characterized by unpredictable behavior due to their thermodynamic instability and increased molecular mobility. Consequently, this unpredictability leads to elevated chemical degradation rates and the occurrence of spontaneous recrystallization. Therefore, crystalline salt formation offers the advantages of kinetic/thermodynamic stability and decreased susceptibility to chemical degradation [14–17].
Herein, we report a solvent-free and continuous one-step HME-based process for the formation of a crystalline salt of an acidic drug (indomethacin (Indo)), demonstrating that the obtained product shows physicochemical properties similar to those of the crystalline salt prepared by solvent evaporation (SE).
According to the biopharmaceutics classification system, Indo is a Class II drug with a pKa of 4.5 and a melting point of 162 °C [18,19]. The bioavailability of Indo is rate-limited by its solubility and dissolution rate [20], which has inspired extensive research aimed at improving its dissolution behavior. In this study, tromethamine (Tro), a highly water-soluble amino sugar with a pKa of 8.07 and a melting point of 171 °C, was selected as the salt-forming base in view of the fact that it is an FDA-approved excipient commonly used as a salt former for oral and intravenous drug administration [21, 22]. It is generally accepted that salt formation occurs if the ΔpKa between the acid and the base is greater than three [23,24]. Herein, based on the pKa difference between Indo and Tro (ΔpKa = 3.6), we hypothesized that in situ proton transfer between these species could occur during melt extrusion and thus effectively enhance the dissolution performance and physical stability of Indo. The thermally induced in situ acid−base reaction between Indo and Tro was investigated by differential scanning calorimetry (DSC) and hot-stage polarized light microscopy (HSPLM). Additionally, Fourier transform infrared spectroscopy (FTIR) and solution-phase 1H/13C nuclear magnetic resonance (NMR) and distortionless enhancement by polarization transfer (DEPT 135) was applied to confirm the occurrence of the above proton transfer. The morphology of as-prepared salts was investigated using scanning electron microscopy (SEM), and the dissolution properties of salts prepared by SE and HME under non-sink conditions at pH 7 were determined using simulated intestinal fluid as the dissolution medium. Finally, powder X-ray diffraction (PXRD) and DSC were used to confirm the crystalline nature of the prepared salt.
2. Materials and Methods
2.1. Materials
Indomethacin (C19H16ClNO4, ≥98% purity, MW = 357.69 g/mol, melting point = 162 °C, pKa = 4.5) was purchased from Combi-Blocks, Inc. (San Diego, California). Tromethamine (C4H11NO3, ≥99% purity, MW = 121.14g/mol, melting point = 142 °C (metastable polymorph) and 171 °C (stable polymorph), pKa = 8.07) was obtained from AK Scientific, Inc. (Union City, California). All organic solvents and other chemicals were sourced from Fisher Scientific (Waltham, Massachusetts) and were of analytical reagent grade.
2.2. Methods
2.2.1. Salt preparation by SE
The solubility of Indo and Tro in anhydrous 200 proof ethanol equal 6.5 mg/mL and 14.6 mg/mL, respectively. To prepare the Indo-Tro salt, the above constituents (1 mmol each) were dissolved at room temperature in 200 proof ethyl alcohol (64 mL) in a 250-mL beaker upon stirring, and the resulting solution was heated to 80 °C to ensure the complete dissolution of all solids or nuclei. The above temperature was maintained until ethanol evaporation–induced supersaturation was reached, and the solution was subsequently cooled to room temperature [25]. The precipitated Indo-Tro salt was filtered, dried, and stored in a desiccator for the duration of the study. Subsequently, the dried product was characterized by HSPLM, PXRD, DSC, thermogravimetric analysis (TGA), solution-phase 1H/13C NMR, DEPT 135 and attenuated total reflectance FTIR (ATR-FTIR) spectroscopy.
2.2.2. Salt preparation by HME
Indo and Tro were passed through a US#30 mesh screen to remove aggregates. A 1:1 (mol/mol) physical mixture of Indo (35.8 g, 0.1 mol) and Tro (12.1 g, 0.1 mol) was tumble-mixed at 25 rpm for 20 min using a Maxiblend™ blender (GlobePharma, New Brunswick, NJ, USA). The blended mixture was fed into zone 1 of a 11-mm co-rotating twin screw extruder (Process 11, Thermo Fisher Scientific, Waltham, Massachusetts) using a single-screw volumetric feeder at a mass flow rate of 5% (~0.24 g/min), the extruder screws rotated at a speed of 150 rpm and the zones were heated at 135 °C. The extruder with a length-to-diameter ratio of 40:1 and eight electrically heated zones was operated utilizing a die and a 3-mm die insert, and the product was collected at the exit end of the extruder. To monitor the progress of salt formation, samples from zones 3, 5, and 8 of the extruder were taken out at the end of each experiment and analyzed by DSC.
2.2.3. pH–solubility profile
Suspensions of Indo in 25 mL of water were prepared in 100-mL conical flasks at 25 °C using a ThermoScientific orbital shaker (ThermoScientific, Waltham, Massachusetts). The pH of as-obtained suspensions (5.04) was adjusted by dropwise addition of aqueous Tro (0.1 and 0.5 M), and the pH change was monitored with a pH meter. It was ensured that excess solid phase always remained in equilibrium with the suspension. After each pH adjustment, suspensions were equilibrated by shaking for at least 2 h, and withdrawn aliquots were filtered through a 0.22-μm centrifuge tube filter (MilliporeSigma, Burlington, Massachusetts) and subjected to 5-min ultracentrifugation at 10000 rpm and 25 °C. No significant change in drug solubility was observed when equilibration was continued for up to 24 h. After appropriate dilutions, the filtered solutions were assayed for Indo by reverse-phase high-performance liquid chromatography (HPLC; Waters® e2696 Separations Module) using a Kinetex® 5-μm C18 (250 × 4.6 mm) column, Waters® 2489 UV/visible detector at 254 nm, and 1:1 (v/v) acetonitrile/phosphate buffer (pH 7.8) as the mobile phase. The above solvent mixture was also used for aliquot dilution.
2.2.4. DSC analysis
DSC analysis was performed using a Model 25 differential scanning calorimeter (TA Instruments, Newcastle, Delaware) equipped with a refrigerator cooling system 120. Nitrogen was used as the purge gas at a flow rate of 50 mL/min. Indium metal was used for instrument calibration. For sample analysis, 2−5 mg samples were accurately weighed and sealed inside standard TA Tzero aluminum pans. For thermal characterization, pure Indo and pure Tro were heated at 10 °C/min from 25 to 200 °C. To characterize the Indo-Tro interaction, their 1:1 (mol/mol) mixture was heated at 10 °C/min from 25 to 185 °C, and the above thermal program was also used to characterize salts obtained by SE and HME. All the results were analysed using Trios software (TA Instruments, Newcastle, Delaware).
2.2.5. HSPLM imaging
An Agilent Cary 620 IR optical microscope (Agilent, Santa Clara, CA, USA) equipped with an electronically controlled hot stage (T95 LinkPad and FTIR 600, Linkam, Tadworth, UK) was used, and the crystallinity of Indo and Tro were evaluated based on the corresponding images captured under crossed polarizers. During imaging, samples were heated to 200 °C at a ramp rate of 20 ± 0.1 °C/min, and the temperature was maintained until visual analysis was complete.
2.2.6. PXRD analysis
PXRD patterns were recorded on a MiniFlex 600 diffractometer (Rigaku Corporation, Tokyo, Japan) equipped with a Cu Kα radiation source (λ = 1.5406 Å). Measurements were conducted at an acceleration voltage of 40 kV and a current of 15 mA. Scanning was performed over an angle range of 2θ = 5–35° at a step size of 0.02° and a dwell time of 0.5 s. The results were analyzed using MDI Jade 8.5 software (Materials Data, Inc., Livermore, CA).
2.2.7. SEM imaging
Samples were mounted on aluminum stubs using a carbon adhesive film and were subsequently coated with gold employing a Hummer® 6.2 sputtering system (Anatech Ltd., Battlecreek, MI, USA) in a high-vacuum evaporator. The surface topography of each sample was analyzed by SEM at acceleration voltages of 1.0 kV −5.0 kV (JEOL JSM-5600, JEOL, Inc., Peabody, MA, USA).
2.2.8. ATR-FTIR spectroscopy
FTIR spectra were collected using a Cary 660 bench top spectrometer (Agilent Technologies, Santa Clara, CA, USA) with a MIRacle ATR sampling accessory (Pike Technologies, Madison, WI, USA) equipped with a single-bounce diamond-coated ZnSe internal reflection element. Samples were placed on the crystal surface and subjected to a constant torque using the built-in pressure tower to achieve uniform solid–crystal contact. Spectra were recorded at ambient temperature in the range of 4000−600 cm−1 using 32 scans at a resolution of 4 cm−1.
2.2.9. 1H and 13C solution-phase NMR
Solution-phase NMR spectra were recorded on a Bruker BioSpin Ultrashield spectrometer (400 MHz, Bruker, Rheinstetten, Germany) using dimethyl sulfoxide (DMSO) as a solvent and tetramethylsilane as an internal reference to confirm the purity of individual substances and the occurrence of salt formation.
2.2.10. TGA
A PerkinElmer Pyris 1 TGA calorimeter was used to determine the thermal stability of Indo, Tro, and their equimolar physical mixture and thus predict the thermal behavior of this mixture in the hot melt extruder. Samples were placed in an open aluminum pan and heated from 30 to 135 °C at a rate of 20 °C/min using ultra-purified nitrogen as the purge gas at a flow rate of 25 mL/min. Pyris software was utilized for data collection/analysis and for calculating percentage mass losses and/or onset temperatures.
2.2.11. In vitro release study
The drug release properties of salts prepared via SE and HME were determined using a United States Pharmacopeia (USP) basket-type dissolution apparatus I (Hanson SR8-plus™, Hanson Research, Chatsworth, CA, USA) according to USP standards. Specifically, 150 mL of pH 7.2 potassium phosphate monobasic buffer was mixed with 600 mL of deionized water to achieve a final pH of 7. All experiments were carried out in triplicate at 37 ± 0.5 °C for 2 h using 750 mL of the dissolution medium. The basket rotation speed was set to 100 rpm. Weighed salt samples with an Indo equivalent dose of 50 mg were placed into size 2 gelatin capsules, and samples were withdrawn and analyzed after 5, 15, 30, 45, 60, and 120 min. The amount of released Indo was determined by HPLC (Waters Corp., Milford, MA, USA; detection at 254 nm) using Empower software (version 2, Waters Corp.).
2.2.12. Content uniformity
Accurately weighed amounts of HME-prepared salt equivalent to an Indo dose of 50 mg were randomly taken from the sample container, dissolved in suitable amounts of the mobile phase, and sonicated. The sonicated dispersions were subjected to appropriate dilutions, filtered, and analyzed by HPLC to determine the drug content.
3. Results and Discussion
3.1. Salt formation by SE
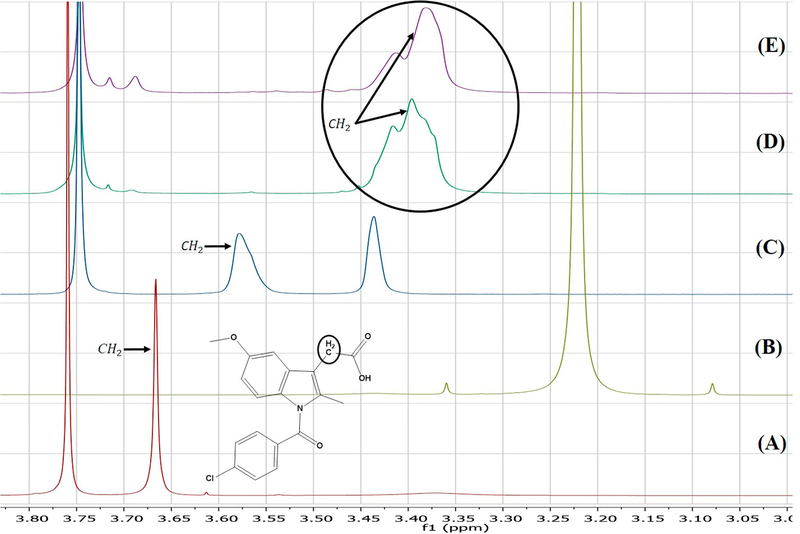
The solvent evaporation method was employed to produce a high-quality salt that was compared with the product obtained by HME. Specifically, 1:1, 2:1, 4:1, 1:2, and 1:4 (mol/mol) Indo:Tro mixtures were prepared by SE. The FTIR spectrum of the product obtained at a 1:1 molar ratio was indicative of complete salt formation, whereas spectra recorded at other ratios were not, i.e., a shoulder peak of amorphous Indo was observed for 2:1 and 4:1 ratio’s, and no Tro N–H stretch shift was observed for 1:2 and 1:4 ratios. DSC scans showed eutectic behavior at a 1:1 molar ratio, and the formed salt had a distinct melting peak and was confirmed to be crystalline by PXRD. Based on the shifts of the methylene group adjacent to the carboxylic group (3.7–3.48 ppm) observed by solution-phase 1H NMR, salt formation was concluded to be complete at the 1:1 molar ratio. The positional variability of the above shift was ascribed to the effects of proton donation by the carboxyl group, which was thought to increase the electron density on carboxyl oxygen and thus decrease its electron-withdrawing effect on the methylene hydrogen [26]. TGA results indicated that no weight loss was observed for either Indo, Tro, or their physical mixture.
3.2. Salt formation by continuous HME processing
Herein, we explored the use of HME as a continuous manufacturing process to prepare an Indo-Tro salt by co-processing Indo-Tro blends with 1:1 and 2:1 Indo:Tro molar ratios, and the morphology and dissolution profiles of the obtained samples were compared. We hypothesized that the 1:1 sample should be more stable and exhibit a better/equivalent dissolution profile than the pure drug, the salt prepared by SE, and the 2:1 sample prepared by HME. Since Tro may adopt a cage-like structure enabling numerous types of interactions, we wanted to determine if these interactions allowed 2 equiv. of Indo to be stabilized by 1 equiv. of Tro. In view of the fact that HME processing parameters (e.g., feed rate, configuration, and temperature profile) significantly affect the quality of the obtained materials, these parameters were carefully optimized. As a result, the highest crystallinity was achieved when extrusion was performed at 135 °C at a feed rate of 5% and 150 rpm using a screw configuration featuring two mixing blocks (Figure 1). The torque at 135 °C varied between 10% and 12%. Viscous dissipation was generated at the interfaces between the tacky melt, co-rotating twin screws, and the inner surface of the extruder barrel. Even though the individual melting points of Indo and Tro significantly exceeded the working temperature, the formation of a eutectic mixture decreased the melting point to much lower values. When zone 5 of the extruder was opened, it was observed that the Indo-Tro mixture was fully melted, and it was concluded that the salt crystallizes out after the interaction is complete. In view of the conversion of the Indo-Tro blend to a tacky material during extrusion, the time period between the feeding of the blend into the extruder and the exit of the product (residence time) was determined as 8 min. The thus obtained product was further used as an ideal formulation for all comparison studies and characterizations. Samples produced by SE and HME exhibited identical melting points and similar enthalpies, which indicated that essentially identical crystallinities were obtained in both cases.
Figure (1).
Illustration of ideal screw configuration used in HME.
3.3. pH–solubility studies
The role of the pH–solubility relationship in aqueous media in determining the feasibility of pharmaceutically acceptable salts of acidic and basic drugs has been extensively studied [27]. The pH–solubility profile of an acidic drug may be expressed by two independent curves, the intersection point of which is denoted as pHmax, i.e., the pH of maximum solubility. The solubility curves above and below the pHmax may, respectively, be determined by Eq. (1) and (2). At pH < pHmax, the solid phase in equilibrium with the saturated solution is the free acid, whereas at pH > pHmax, it is the salt, and both form co-exist at pH = pHmax. Thus, salt-to-acid interconversion (and vice versa) may occur if the pH shifts away i.e. lower from pHmax [3]. Equations describing the pH–solubility relationships of salt and free-acid forms of acidic compounds were first established by Kramer and Flynn [24]:
| Eq.(1) |
| Eq.(2) |
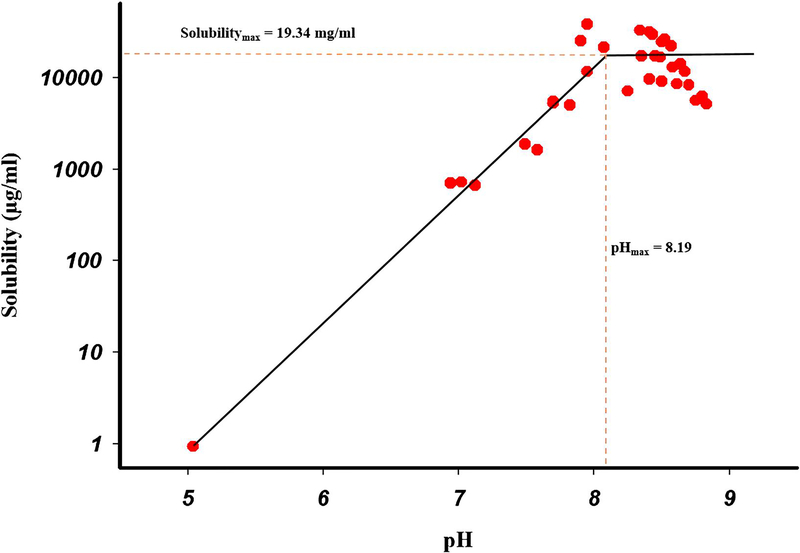
Where A− and AH are the deprotonated (salt) and free acid species of the drug, respectively, ST is the total solubility at any particular pH, Ka is the acid dissociate constant, and the subscript s denotes the equilibrium species in the solid state. Different aqueous suspensions were used in multiple experiments to obtain solubility values (Figure 2), and the solubility of Indo in water at 25 °C was determined as 0.9 μg/mL. Figure 2 also shows that the complete pH−solubility profile was indeed represented by two curves that intersected at pHmax ≈ 8.19. As mentioned above, the equilibrium species present below pHmax is the free acid. When a new solid form precipitated out of the solution, pH increased to values above 8. The solid phase in equilibrium with the solution at such pH was shown to not be the free acid and was therefore concluded to be the corresponding salt. The fact that a new solid form could be obtained by increasing pH to values above pHmax by the addition of Tro illustrated the feasibility of forming a Tro salt of Indo. The solubility of the Indo-Tro salt in the flat pH region of 8.15–8.3 was determined as 19.34 mg/mL, gradually decreasing at pH > 8.3 because of the common ion effect. The apparent Ksp of the salt was calculated as 1.63 × 10⁻³ M2 using the method of Anderson and Conradi [28]. Figure 2 also revealed that after the pH of maximum salt solubility was reached, the solubility exhibited a plateau and then decreased, in agreement with Le Chatelier’s common ion effect. As the concentration of base increased after full acid neutralization, the acid (Indo) precipitated out until the ion product became equal to the solubility product [29].
Figure (2).
pH-Solubility profile of Indo (weak acid) titrated with Tro (weak base).
3.4. Characterization of the Indo-Tro interaction and the corresponding crystalline salt by DSC
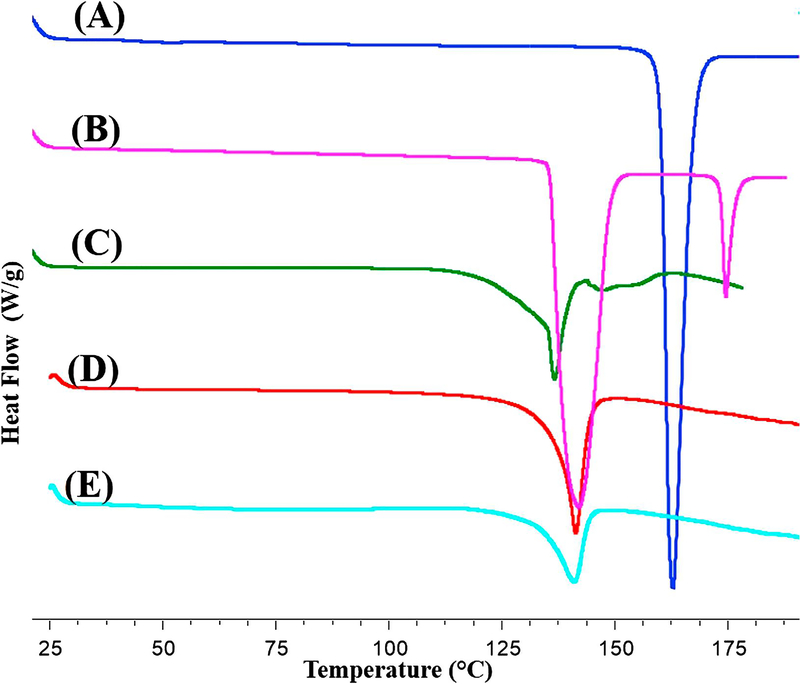
Solid-state reactions between acids and bases are likely to occur at elevated temperatures [9]. The pKa rule is generally accepted to predict salt formation. Since the pKa difference between Indo and Tro equals 3.57, these species are likely to react and form an organic salt at elevated temperature. Herein, the interaction between Indo and Tro in physical mixtures at elevated temperature was initially studied by DSC analysis with a heat−cool−heat temperature cycle. Figure 3 shows that pure Indo melted at 162 °C, whereas pure Tro melted at 143 °C (metastable polymorph) and 171 °C (stable polymorph). Notably, Indo-Tro binary mixtures demonstrated interesting thermal behaviors, e.g., “eutectic-like” endothermic events (136 °C) at temperatures below the individual melting points of both Indo and Tro were observed in the binary mixture, which was attributed to the suppression of Indo melting in the presence of Tro. The salt obtained by HME had a melting point of 142 °C, which was identical to that of the crystalline salt prepared by SE. The Melt enthalpy for the hot melt extruded salt was 66.2 J/g and for Solvent evaporation was 74.4 J/g. As shown in Figure 3, the melting peak of the newly formed crystals was almost superimposed on the first melting peak of the metastable polymorph of Tro. When Tro was cooled and reheated, its melting point was determined as 148 °C, which indicated that the salt peak did not correspond to that of the recrystallized metastable Tro polymorph. Also, heat-cool-heat cycle for the salt showed; 1st heating cycle resulted in the melting of the salt at 142 °C, no crystallization was observed in the cooling cycle (cooled up to −30 °C at 1°C/min and kept isothermal at −30 °C for 10 min), 2nd heating cycle resulted in a Tg. This clearly concluded that the crystalline peak cannot be of the polymorph of Tro, as it is an easily crystallizable compound. The salt did not convert crystalline again as Indo belongs to class III (very weak) crystal category [30]. Excess of kinetic energy was input thus rendering it in the amorphous form. The Tg of the amorphous product was found to be in the range of 45 – 55 °C, which is higher than the Indo Tg (40 °C), indicating interaction [31]. Moreover, no additional melting peaks were observed in the first heating cycle, and we therefore ascribed the new peak to the melting of the newly formed crystalline salt. A small Tg was also observed in the thermogram having a midpoint of 48 °C. 11% of the salt was in its amorphous state and 89% in its crystalline state. The higher the amorphous salt, the higher the content of the degradant. Presence of an amorphous content is the reason for the salt having low lattice energy. Generally, performing TGA analysis prior to HME is of critical importance, since the high temperature experienced by the drug and excipients during extrusion may result in the occurrence of degradation, thermally induced chemical reactions, or both [32]. Herein, the obtained TGA results revealed that Indo, Tro, and their equimolar physical mixture were chemically stable in the temperature range of HME processing (data not shown).
Figure (3).
DSC scans of (A) Indo, (B) Tro, (C) 1:1 Indo-Tro physical mixture, (D) 1:1 Indo-Tro crystalline salt prepared by SE and (E) 1:1 Indo-Tro crystalline salt prepared by HME.
3.5. Characterization of the Indo-Tro interaction by HSPLM
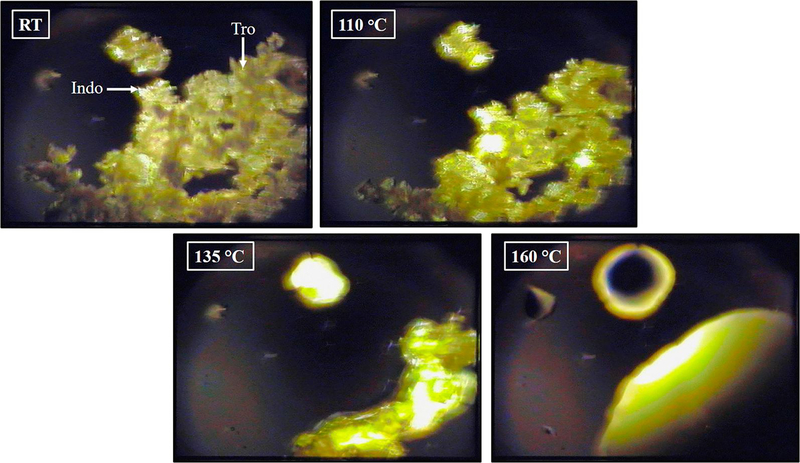
HSPLM imaging was utilized to further understand the thermal events observed in DSC analysis. Figure 4 shows a correlation between the DSC thermogram and the HSPLM photomicrographs observed for the equimolar physical mixture of Indo and Tro heated at a rate of 20 °C/min. Indo and Tro were easily distinguishable based on their irregular crystal shapes, as confirmed by the results of SEM imaging. When the above species were tested individually, no thermal event was observed by HSPLM until the respective melting temperatures (143 °C (metastable polymorph) and 171 °C (stable polymorph) for Tro and 162 °C for Indo) were reached. Conversely, Tro began to melt around 110 °C in the Indo−Tro physical mixture, whereas Indo crystals gradually dissolved in molten Tro, and complete mixing was achieved before any of the individual melting points was reached. Thus, the results of DSC and HSPLM analyses indicated that Indo and Tro could have reacted to form a salt upon thermal treatment. Eutectic melting cannot conclude salt formation, but the components should have chemical groups that can interact to form physical bonds, such as intermolecular hydrogen bonding, etc [33]. Crystallization of a molecular complex following the solubilization of one component into the melt of the other one has been achieved by other solubility enhancement techniques for substrates such as co-amorphous materials and co-crystals.
Figure (4).
Hot stage polarized light microscopy of 1:1 Indo-Tro physical mixture.
The real-time monitoring of in situ intermediate formation during mechanochemical milling is challenging [34]. Herein, the rate of melting was much faster for the lower-melting-point component (i.e., Tro metastable polymorph), and this melting therefore produced a large amount of “solvent” for the higher-melting-point component, which first dissolved in the melt and then transformed into a more stable crystalline state. Similar results have been reported for the thermally induced formation of carbamazepine–nicotinamide co-crystals [35]. In conclusion, the results of HSPLM imaging indicated that Indo and Tro formed an Indo-Tro salt in situ at elevated temperature.
3.6. Characterization of the crystalline salt by PXRD
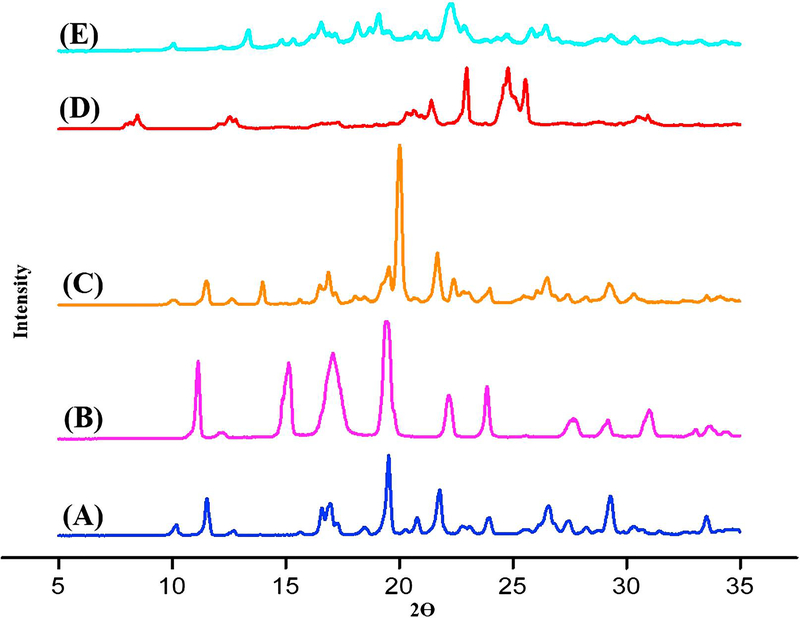
The PXRD pattern of the salt obtained by HME was compared to that of the salt obtained by solution-phase crystallization and those of individual components and their physical mixture. The PXRD pattern of Indo resembled that reported for the γ-form, in agreement with the interpretation of DSC results [36], featuring intense reflections in the 2θ = 10−35° range that were indicative of a complex crystal structure (Figure 5), namely at 2θ = 10°, 11°, 19°, 22°, 29°, and 34°. For Tro, intense signals compliant with its intricate crystal lattice arrangement were observed at 2θ = 14– 27° (Figure 5), namely at 14°, 18°, 20°, 22.5°, 25°, and 27°. Salts produced by both SE and HME exhibited a distinct peak with significant intensity at 2θ = 12.55°. Moreover, the salt produced by the latter method was shown to be crystalline by DSC analysis. The impact of process parameters was distinctly revealed by PXRD analysis, i.e., when non-optimal conditions were applied, a single dominant amorphous halo at 2θ = 21° was observed in place of the above crystalline phase peak (data not shown), in agreement with the results of DSC analysis. The diffractogram of the Indo-Tro physical mixture showed reflections belonging to individual Indo and Tro (Figure 5).
Figure (5).
XRPD scans of (A) Indo, (B) Tro, (C) 1:1 Indo-Tro physical mixture, (D) 1:1 Indo-Tro crystalline salt prepared by SE and (E) 1:1 Indo-Tro crystalline salt prepared by HME.
3.7. Characterization of surface morphology by SEM
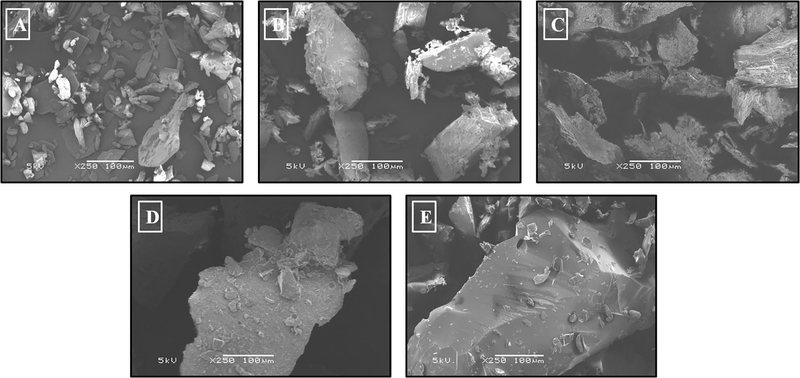
SEM was used as a technique providing direct visual evidence and capable of confirming crystalline salt formation to examine the surface morphology of the drug, co-former, and salts produced by SE and HME. Indo was shown to exist as irregularly shaped plate-like crystals, whereas Tro formed rough and thick plate-like irregular crystals. Crystalline compounds with a rough surface can be imaged by SEM [37]. Also ionic compounds are brittle in nature [38]. In agreement with this statement, the image obtained for the highly crystalline salt showed extremely rough particle surfaces, whereas the amorphous product contained particles with smooth surfaces. Moreover, the crystalline salt obtained by SE featured a surface morphology similar to that of the salt produced by HME (Figure 6). Thus, these results suggested that the formation of a crystalline salt in this case was highly probable, and the good content uniformity of HME systems confirmed that the degrees of mixing and salt formation in the hot melt extruder were acceptably high. Therefore, the results of SEM imaging were consistent with those of DSC and PXRD analyses.
Figure (6).
Scanning electron microscopy images of (A) Indo, (B) Tro, (C) 1:1 Indo-Tro crystalline salt prepared by SE, (D) 1:1 Indo-Tro crystalline salt prepared by HME and (E) 1:1 Indo-Tro amorphous product prepared by HME.
3.8. Characterization of the crystalline salt by FTIR spectroscopy
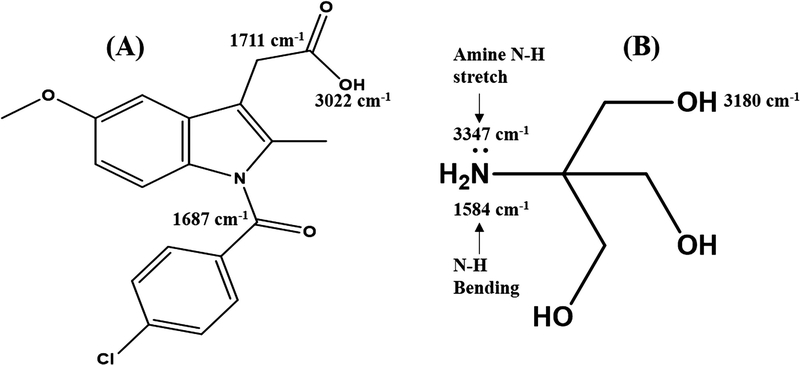
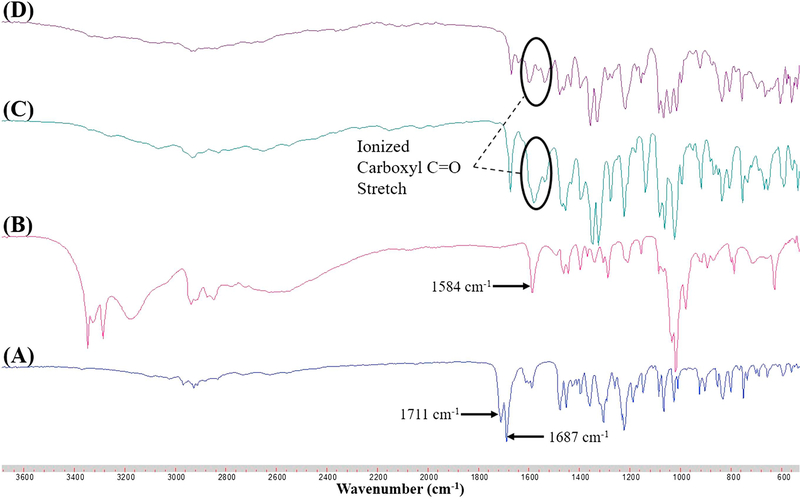
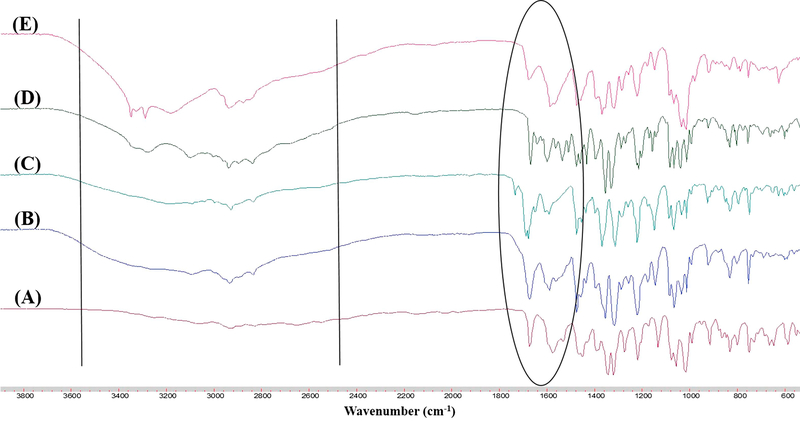
Salts can be categorized into those exhibiting ionic interaction (as result of proton transfer) or nonionic interaction with varying degrees of proton sharing via H-bonding [39], with complete proton transfer between acidic and basic components occurring for ΔpKa > 3.0 [21]. Since Indo and Tro have pKas of 4.5 and 8.07, respectively, we hypothesized that ionic interaction with full proton transfer was possible. However, proton transfer is also affected by molecular packing and processing conditions. Herein, FTIR spectroscopy and NMR were used to determine the interaction between Indo and Tro, showing the occurrence of full proton transfer. The former technique is often used to detect salt formation based on the ionization state of acidic and basic components. In this work, FTIR analysis offered crucial information on salt formation, since the variation in vibrational frequencies was correlated with changes in hydrogen bonding caused by the formation of multicomponent crystals. Figure 7 shows the wavenumbers of important Indo and Tro groups involved in salt formation. Salt was formed via proton transfer from the carboxylic acid group of Indo to the primary amine of Tro, which was the most basic site. The antisymmetric C=O stretch of the ionized carboxyl group is typically observed between 1540 and 1650 cm−1 [40]. The peak at 3327 cm−1 completely disappears, as the primary amine is no longer in its primary state and the 3370 cm−1 peak remains constant, which indicates that the primary amine group of Tro was involved in the salt formation. Moreover, a new peak (Figure 8) at 1570 cm−1 was observed for 1:1 salts obtained by SE and HME. To reveal the reason why the 1:1 molar ratio worked best, we recorded FTIR spectra of SE–processed mixtures with Indo:Tro ratios of 1:1, 2:1, 4:1, 1:2, and 1:4 (Figure 9). In the case of the 2:1 ratio, a shoulder around 1750 cm−1 was observed, which indicated the presence of amorphous Indo, and the observation of the salt-specific peak implied that 1 equiv. of Indo reacted with 1 equiv. of Tro to form a salt. In the case of the 4:1 ratio, the observation of the COOH carbonyl stretch revealed the presence of excess Indo. Finally, the NH bending peak at 1584 cm−1 detected in 1:2 and 1:4 mixtures completely overpowered Indo peaks, indicating the presence of excess Tro.
Figure (7).
FTIR ranges of (A) Indo and (B) Tro.
Figure (8).
FTIR spectra of (A) Indo, (B) Tro, (C) 1:1 Indo-Tro crystalline salt prepared by SE, (D) 1:1 Indo-Tro crystalline salt prepared by HME.
Figure (9).
FTIR spectra of different molar ratios of Indo-Tro prepared by SE (A) 1:1, (B) 2:1, (C) 4:1, (D) 1:2 and (E) 1:4.
3.9. Characterization of the crystalline salt via solution-phase NMR
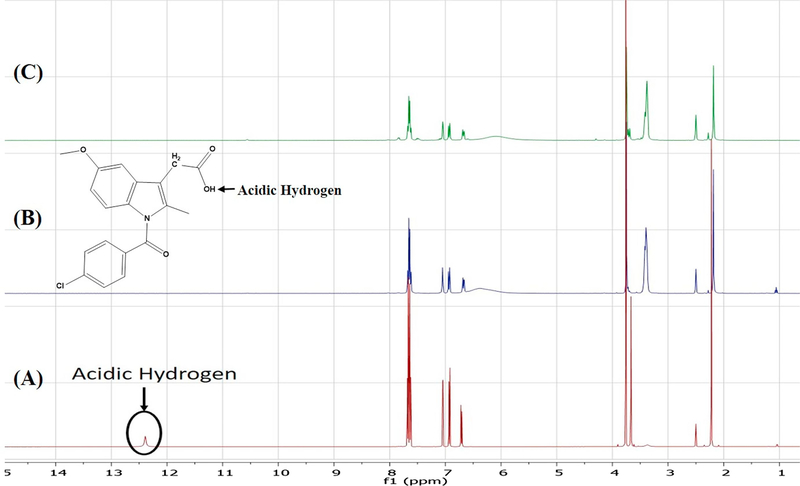
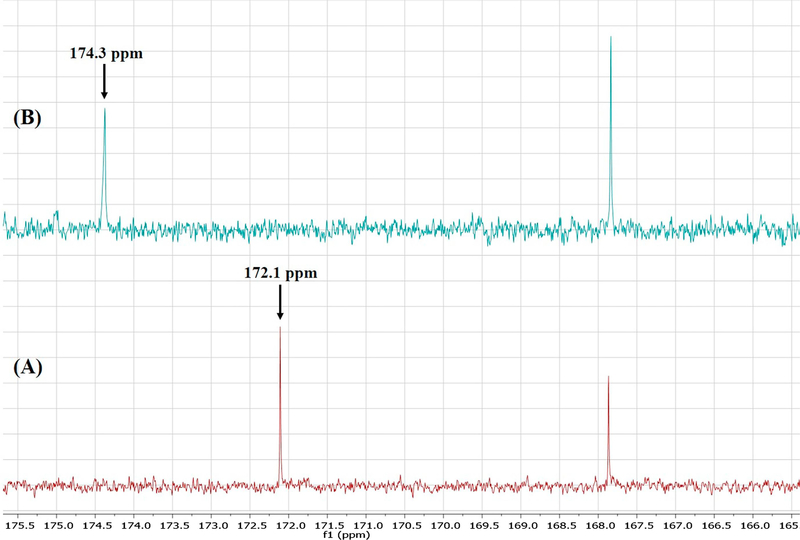
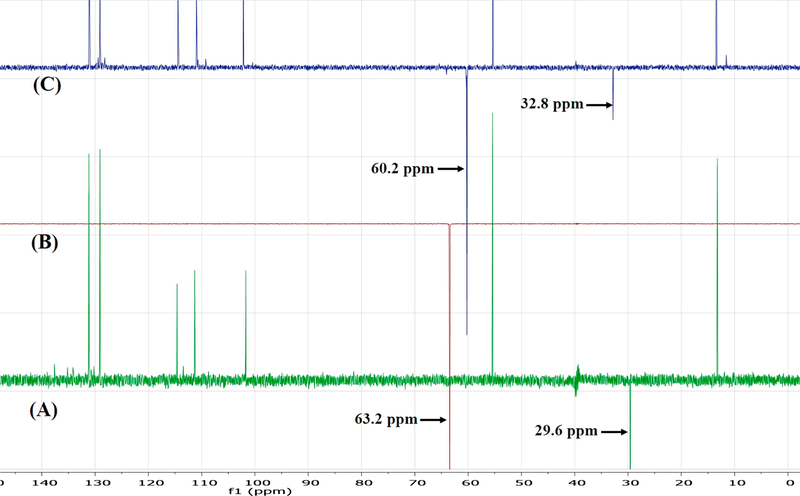
Although one can deduce which positions are protonated based on chemical reasoning and pKa value computations, FTIR does not directly indicate which carbon atoms are involved in deprotonation. Conversely, the sensitivity of NMR to subtle changes in the electronic environment of the nuclei of interest make it an excellent technique for investigating deprotonation sites [41]. Herein, the results of 1H solution-phase NMR confirmed the occurrence of salt formation, since the protons of the methylene group adjacent to the carboxyl carbon showed an upfield shift from 3.7 ppm to 3.4 ppm (Figure 10). Moreover, whereas the spectrum of pure Indo featured an acidic proton signal at 12.4 ppm, no such peak was observed for crystalline salts prepared by SE and HME, which indicated that this proton was transferred to the base (Figure 11). 13C solution-phase NMR spectra of Indo and 1:1 salt prepared by HME are shown in Figure 12. The spectra of Indo and Tro were in good agreement with those reported previously. Notably, deprotonation at the carboxylic carbon induced a downfield shift from 172.1 to 174.4 ppm, which indicated that deprotonation occurred at a specific carboxylic carbon nucleus [42]. Additionally, DEPT 135 experiments were conducted to observe the effects of protonation on the methylene group adjacent to the primary amine group of the base and on the methylene group adjacent to the carboxylic group of the acid. As a result, the methylene signal of the free base shifted upfield to 60.2 ppm from 63.2 ppm, and the signal of the methylene group of the acid shifted downfield to 32.8 ppm from 29.6 ppm (Figure 13), which was indicative of salt formation and agreed with the results of the protonation/deprotonation study of Schneider et al. [26]. The results suggest 95% salt formation was possible by hot melt extrusion and more than 99% by solvent evaporation. This was estimated by the integration value of an acidic hydrogen peak, where presence of acidic hydrogen in Indo was 100% and presence of acidic hydrogen in hot melt extrusion and solvent evaporation is <5% and <1%, respectively. To eliminate the possibility of ionization in DMSO, the physical mixture of Indo and Tro was also studied, and the shift observed for the physical mixture was shown to be very small compared to that observed for the salt.
Figure (10).
1H NMR of (A) Indo, (B) Tro, (C) 1:1 Indo-Tro physical mixture, (D) 1:1 Indo-Tro crystalline salt prepared with SE and (E) 1:1 Indo-Tro crystalline salt prepared by HME.
Figure (11).
1H NMR of (A) Indo, (B) 1:1 Indo-Tro crystalline salt prepared with SE and (C) 1:1 Indo-Tro crystalline salt prepared by HME.
Figure (12).
13C NMR of (A) Indo and (B) 1:1 Indo-Tro crystalline salt prepared by HME.
Figure (13).
DEPT 135 NMR of (A) Indo (B) Tro and (C) 1:1 Indo-Tro crystalline salt prepared with HME.
3.10. In vitro release/content uniformity
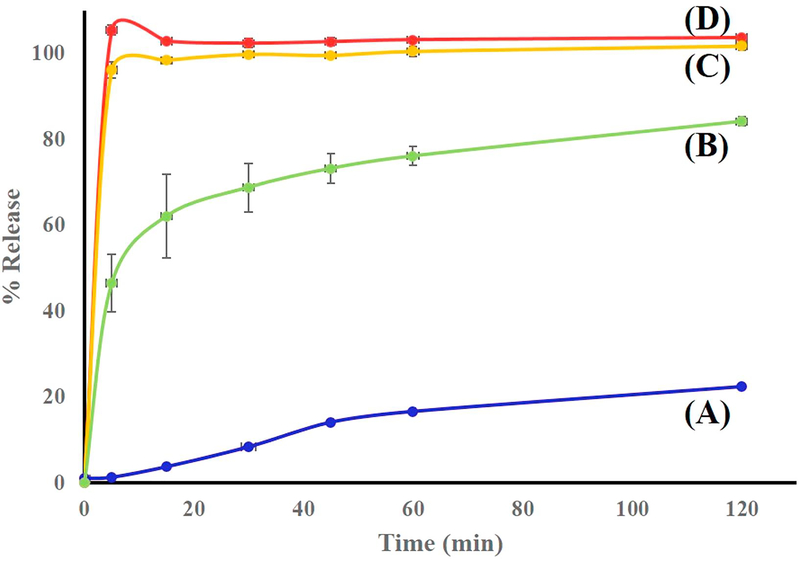
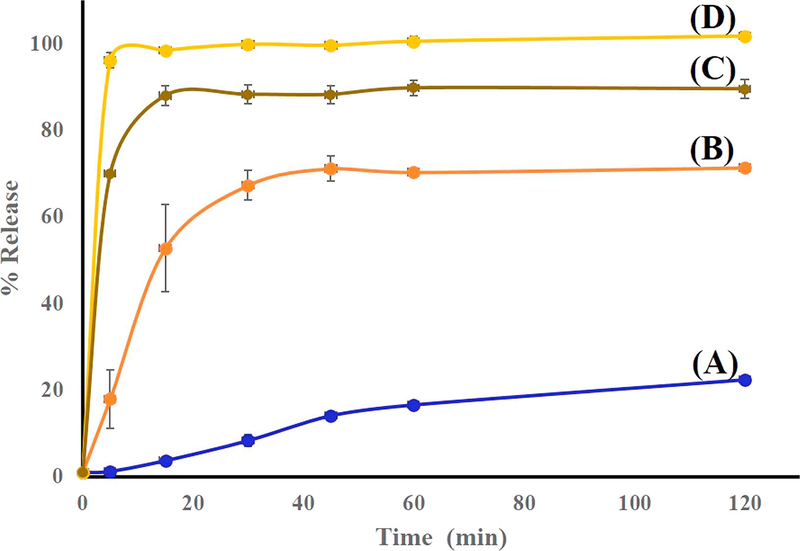
Salt formation is known to influence several physicochemical properties of the parent compound including dissolution rate, solubility, stability, and hygroscopicity. In turn, these properties affect drug availability and formulation characteristics. The dissolution rate of a pharmaceutical agent is of major importance to the formulator, since in many cases, particularly for poorly soluble drugs, it best reflects bioavailability [43]. As a rule, pharmaceutical salts exhibit higher dissolution rates than the corresponding conjugate acids or bases at identical pH, even though the equilibrium solubilities may be equal [3]. In this study, solubility enhancement via HME-induced crystalline salt formation was evaluated by in vitro dissolution testing, with the results presented in Figures 14 and 15. Specifically, we used the dissolution medium (final pH = 7) described in the USP monograph on Indo, and the equilibrium solubility of Indo in this medium at 37 °C was determined as 15.1 μg/mL. Dissolution testing was performed using salt samples prepared by HME and SE so that the nominal concentration of Indo equaled 66.6 μg/mL. The dissolution profile of pure Indo was markedly different from those of the 1:1 mixture and crystalline salts (Figure 14). Notably, 100% of the drug was released within 5 min from salts prepared by either method, and the solubility of Indo in the salt form was shown to exceed that of the free acid form by a factor of 4.6. Conversely, the 1:1 physical mixture of Indo and Tro showed a drug release of ~80% over 2 h. Indo has pH dependent solubility; Tro affects the pH environment of the dissolution media thus giving better profile than the drug. The drug release profile of the crystalline salt was also compared to those of the 2:1 mixture and the amorphous tacky mass of 1:1 composition (Figure 15). As a result, a release of only 70% over 2 h was observed in the former case, which indicated that some salt might have formed, while the remaining Indo possibly underwent slow recrystallization upon contact with the medium. The 1:1 amorphous tacky mass also exhibited poor dissolution performance compared to the 1:1 crystalline salt, which was ascribed to the occurrence of high-temperature degradation reactions in the former case, i.e., those leading to aldehyde formation instead of ionic interaction. This aldehyde formation was detected by NMR, and the corresponding HPLC profiles featured a new separate peak not attributed to Indo. Based on the obtained data, HME resulted in the uniform mixing of the drug with the co-former to achieve content uniformity, which is one of the key factors to take into consideration for formulation development. The drug content of extruded formulations was determined as 98.8 ± 1%, and the lower standard deviation obtained for the extruded salt indicated that the optimized screw configuration provided sufficient mixing and resulted in a homogenous interaction between Indo and Tro.
Figure (14).
Dissolution profiles of (A) Indo, (B) 1:1 Indo-Tro physical mixture (C) 1:1 Indo-Tro crystalline salt prepared by HME and (D) 1:1 Indo-Tro crystalline salt prepared with SE in 750 mL of pH 7 media using USP apparatus I at 100 rpm (n = 3).
Figure (15).
Dissolution profiles of (A) Indo, (B) 2:1 Indo-Tro prepared with HME, (C) 1:1 Indo-Tro tacky mass prepared with HME at 145°C and (D) 1:1 Indo-Tro crystalline salt prepared with HME in 750 mL of pH 7 media using USP apparatus I at 100 rpm (n = 3).
4. Conclusion
This research focused on increasing the solubility of a poorly water-soluble drug, Indo, by converting it into a salt form using Tro as the co-former. In view of the fact that techniques commonly used for salt formation require the use of organic solvents and are batch processes, we herein employed HME as an alternative continuous and solvent-free method. The obtained pH– solubility profiles suggested that salt formation between Indo and Tro is feasible at a 1:1 molar ratio, and the corresponding mixture was shown to exhibit eutectic melting by DSC and HSPLM. The crystalline nature of the prepared salt was confirmed by PXRD and SEM, and solution-phase NMR and FTIR spectroscopy suggested the occurrence of a strong ionic interaction accompanied by proton transfer from Indo to Tro. Salt formation increased the dissolution rate of Indo in aqueous medium, achieving a 100% drug release in less than 5 min. Crystalline salts prepared by SE and HME showed similar physicochemical characteristics, and the latter method was therefore concluded to be a promising solvent-free alternative for the preparation of crystalline salts, contributing to the elimination of batch processing while achieving comparable quality.
Acknowledgements
This project was supported by the National Institute of General Medical Sciences, National Institutes of Health (Grant No. P20GM104932). The content is solely the responsibility of the authors and does not necessarily represent the official views of the National Institutes of Health. The authors also thank the Pii Center for Pharmaceutical Technology for contributions to this project.
Abbreviations:
- HME
Hot melt extrusion
- SE
solvent evaporation
- DSC
differential scanning calorimetry
- HSPLM
hot-stage polarized light microscopy
- FTIR
Fourier transform infrared spectroscopy
- DEPT
distortionless enhancement by polarization transfer
- NMR
nuclear magnetic resonance
- SEM
scanning electron microscopy
- PXRD
powder X-ray diffraction
- TGA
thermogravimetric analysis
- ATR
attenuated total reflectance
- HPLC
high-performance liquid chromatography
- DMSO
dimethyl sulfoxide
- USP
United States Pharmacopeia
Footnotes
Publisher's Disclaimer: This is a PDF file of an unedited manuscript that has been accepted for publication. As a service to our customers we are providing this early version of the manuscript. The manuscript will undergo copyediting, typesetting, and review of the resulting proof before it is published in its final citable form. Please note that during the production process errors may be discovered which could affect the content, and all legal disclaimers that apply to the journal pertain.
References
- [1].Lipinski CA, Lombardo F, Dominy BW, Feeney PJ, Experimental and computational approaches to estimate solubility and permeability in drug discovery and development settings, Adv. Drug Delivery Rev 46 (2001) 3–26. [DOI] [PubMed] [Google Scholar]
- [2].Leuner C, Dressman J, Improving drug solubility for oral delivery using solid dispersions, Eur. J. Pharm. Biopharm 50 (2000) 47–60. [DOI] [PubMed] [Google Scholar]
- [3].Serajuddin AT, Salt formation to improve drug solubility, Adv. Drug Delivery Rev 59 (2007) 603–616. [DOI] [PubMed] [Google Scholar]
- [4].Stephenson GA, Aburub A, Woods TA, Physical stability of salts of weak bases in the solid-state, J. Pharm. Sci 100 (2011) 1607–1617. [DOI] [PubMed] [Google Scholar]
- [5].Berge SM, Bighley LD, Monkhouse DC, Pharmaceutical salts J Pharm. Sci 66 (1977) 1–19. [DOI] [PubMed] [Google Scholar]
- [6].Vasconcelos T, Sarmento B, Costa P, Solid dispersions as strategy to improve oral bioavailability of poor water soluble drugs, Drug Discovery Today 12 (2007) 1068–1075. [DOI] [PubMed] [Google Scholar]
- [7].Hernandez R, Continuous manufacturing: a changing processing paradigm, BioPharm Int. 28 (2015) 20–27. [Google Scholar]
- [8].Myerson A, Handbook of Industrial Crystallization, second ed, Butterworth-Heinemann, Boston, (2002) 231–248. [Google Scholar]
- [9].James SL, Adams CJ, Bolm C, Braga D, Collier P, Friščić T, Grepioni F, Harris KDM, Hyett G, Jones W, Krebs A, Mack J, Maini L, Orpen AG, Parkin IP, Shearouse WC, Steed JW, Waddell DC, Mechanochemistry: opportunities for new and cleaner synthesis, Chem. Soc. Rev 41 (2012) 413–447. [DOI] [PubMed] [Google Scholar]
- [10].Repka MA, Battu SK, Upadhye SB, Thumma S, Crowley MM, Zhang F, Martin C, McGinity JW, Pharmaceutical applications of hot-melt extrusion: Part II, Drug Dev. Ind. Pharm 33 (2007) 1043–1057. [DOI] [PubMed] [Google Scholar]
- [11].Repka MA, Shah S, Lu J, Maddineni S, Morott J, Patwardhan K, Mohammed NN, Melt extrusion: process to product, Expert Opin. Drug Delivery 9 (2012) 105–125. [DOI] [PubMed] [Google Scholar]
- [12].Song Y, Zemlyanov D, Chen X, Nie H, Su Z, Fang K, Yang X, Smith D, Byrn S, Lubach JW, Acid–base interactions of polystyrene sulfonic acid in amorphous solid dispersions using a combined UV/FTIR/XPS/ssNMR study, Mol. Pharmaceutics 13 (2015) 483–492. [DOI] [PubMed] [Google Scholar]
- [13].Hasa D, Perissutti B, Cepek C, Bhardwaj S, Carlino E, Grassi M, Invernizzi S, Voinovich D, Drug salt formation via mechanochemistry: the case study of vincamine, Mol. Pharmaceutics 10 (2012) 211–224. [DOI] [PubMed] [Google Scholar]
- [14].Pikal MJ, Lukes AL, Lang JE, Thermal decomposition of amorphous β-lactam antibacterials, J. Pharm. Sci 66 (1977) 1312–1316. [DOI] [PubMed] [Google Scholar]
- [15].Aso Y, Yoshioka S, Kojima S, Explanation of the crystallization rate of amorphous nifedipine and phenobarbital from their molecular mobility as measured by 13C nuclear magnetic resonance relaxation time and the relaxation time obtained from the heating rate dependence of the glass transition temperature, J. Pharm. Sci 90 (2001) 798–806. [DOI] [PubMed] [Google Scholar]
- [16].Zhou D, Zhang GG, Law D, Grant DJ, Schmitt EA, Physical stability of amorphous pharmaceuticals: importance of configurational thermodynamic quantities and molecular mobility, J. Pharm. Sci 91 (2002) 1863–1872. [DOI] [PubMed] [Google Scholar]
- [17].Lee HL, Vasoya JM, Cirqueira MDL, Yeh KL, Lee T, Serajuddin AT, Continuous preparation of 1:1 haloperidol-maleic acid salt by a novel solvent-free method using a twin screw melt extruder, Mol. Pharm 14 (2017) 1278–1291. [DOI] [PubMed] [Google Scholar]
- [18].Taylor LS, Zografi G, Spectroscopic characterization of interactions between PVP and indomethacin in amorphous molecular dispersions, Pharm. Res 14 (1997) 1691–1698. [DOI] [PubMed] [Google Scholar]
- [19].Amidon GL, Lennernäs H, Shah VP, Crison JR, A theoretical basis for a biopharmaceutic drug classification: the correlation of in vitro drug product dissolution and in vivo bioavailability, Pharm. Res 12 (1995) 413–420. [DOI] [PubMed] [Google Scholar]
- [20].Lenz E, Löbmann K, Rades T, Knop K, Kleinebudde P, Hot melt extrusion and spray drying of co-amorphous indomethacin-arginine with polymers, J. Pharm. Sci 106 (2017) 302–312. [DOI] [PubMed] [Google Scholar]
- [21].Saal C, Becker A, Pharmaceutical salts: A summary on doses of salt formers from the Orange Book, Eur. J. Pharm. Sci 49 (2013) 614–623. [DOI] [PubMed] [Google Scholar]
- [22].Thakral S, Suryanarayanan R, Salt formation during freeze-drying – an approach to enhance indomethacin dissolution, Pharm. Res 32 (2015) 3722–3731. [DOI] [PubMed] [Google Scholar]
- [23].Cruz-Cabeza AJ, Acid–base crystalline complexes and the pKa rule, CrystEngComm 14 (2012) 6362–6365. [Google Scholar]
- [24].Kramer SF, Flynn GL, Solubility of organic hydrochlorides, J. Pharm. Sci 61 (1972) 1896–1904. [DOI] [PubMed] [Google Scholar]
- [25].Chiou WL, Riegelman S, Pharmaceutical applications of solid dispersion systems, J. Pharm. Sci 60 (1971) 1281–1302. [DOI] [PubMed] [Google Scholar]
- [26].Schneider H-J, Pöhlmann J, 1H and 13C NMR spectra, protonation, deprotonation, and host-guest complexation-induced shifts of some fluorescence dyes, Bioorg. Chem 15 (1987) 183–193. [Google Scholar]
- [27].Stahl PH, Wermuth CG, Handbook of pharmaceutical salts: properties, selection and use, first ed., Wiley-VCH, Weinheim, (2002) 135–160 [Google Scholar]
- [28].Anderson BD, Conradi RA, Predictive relationships in the water solubility of salts of a nonsteroidal anti-inflammatory drug, J. Pharm. Sci 74 (1985) 815–820. [DOI] [PubMed] [Google Scholar]
- [29].Fernandez-Prini R, Le Chatelier’s principle and the prediction of the effect of temperature on solubilities, J. Chem. Educ 59 (1982) 550. [Google Scholar]
- [30].Bernard VE, Baird JA, Taylor LS, Crystallization tendency of active pharmaceutical ingredients following rapid solvent evaporation—classification and comparison with crystallization tendency from undercooled melts, J. pharm. sci 99 (2010) 3826–3838. [DOI] [PubMed] [Google Scholar]
- [31].Towler CS, Li T, Wikström H, Remick DM, Sanchez-Felix MV, Taylor LS, An investigation into the influence of counterion on the properties of some amorphous organic salts, Mol. Pharm 5 (2008) 946–955. [DOI] [PubMed] [Google Scholar]
- [32].Morott JT, Pimparade M, Park JB, Worley CP, Majumdar S, Lian Z, Pinto E, Bi Y, Durig T, Repka MA, The effects of screw configuration and polymeric carriers on hot-melt extruded taste-masked formulations incorporated into orally disintegrating tablets, J. Pharm. Sci 104 (2015) 124–134. [DOI] [PMC free article] [PubMed] [Google Scholar]
- [33].Gala U, Pham H, Chauhan H, Pharmaceutical applications of eutectic mixtures, J. Dev. Drug 2 (2013) 1–2. [Google Scholar]
- [34].Friščić T, Halasz I, Beldon PJ, Belenguer AM, Adams F, Kimber SAJ, Honkimäki V, Dinnebier RE, Real-time and in situ monitoring of mechanochemical milling reactions, Nat. Chem 5 (2013) 66–73. [DOI] [PubMed] [Google Scholar]
- [35].Seefeldt K, Miller J, Alvarez-Nunez F, Rodriguez-Hornedo N, Crystallization pathways and kinetics of carbamazepine–nicotinamide cocrystals from the amorphous state by in situ thermomicroscopy, spectroscopy, and calorimetry studies, J. Pharm. Sci 96 (2007) 1147–1158. [DOI] [PubMed] [Google Scholar]
- [36].Aceves-Hernandez JM, Nicolás-Vázquez I, Aceves FJ, Hinojosa-Torres J, Paz M, Castaño VM, Indomethacin polymorphs: Experimental and conformational analysis, J. Pharm. Sci 98 (2009) 2448–2463. [DOI] [PubMed] [Google Scholar]
- [37].Goldstein JI, Newbury DE, Michael JR, Ritchie NW, Scott JH, Joy DC, Scanning Electron Microscopy and X-Ray Microanalysis, fourth ed. Springer, New York, (2018) 491–515. [Google Scholar]
- [38].Ruoshi S, Johnson DD, Stability maps to predict anomalous ductility in B2 materials, Phy. Rev. B 87 (2013) 104–107. [Google Scholar]
- [39].Sun CC, Cocrystallization for successful drug delivery, Expert Opin. Drug Delivery 10 (2013) 201–213. [DOI] [PubMed] [Google Scholar]
- [40].Lin-Vien D, Colthup NB, Fateley WG, Grasselli JG, The Handbook of Infrared and Raman Characteristic Frequencies of Organic Molecules, first ed., Elsevier, New York, 1991. [Google Scholar]
- [41].Boonsongrit Y, Mueller BW, Mitrevej A, Characterization of drug–chitosan interaction by 1H NMR, FTIR and isothermal titration calorimetry, Eur. J. Pharm. Biopharm 69 (2008) 388–395. [DOI] [PubMed] [Google Scholar]
- [42].Merwin LH, Ross SD, Solid-State 13C and 1H NMR Study of Anomalous Acid Salts of Dibasic Carboxylic Acids, Mag. Res. Chem 30 (1992) 440–448. [Google Scholar]
- [43].Ahuja N, Katare OP, Singh B, Studies on dissolution enhancement and mathematical modeling of drug release of a poorly water-soluble drug using water-soluble carriers, Eur. J. Pharm. Biopharm 65 (2007) 26–38. [DOI] [PubMed] [Google Scholar]


