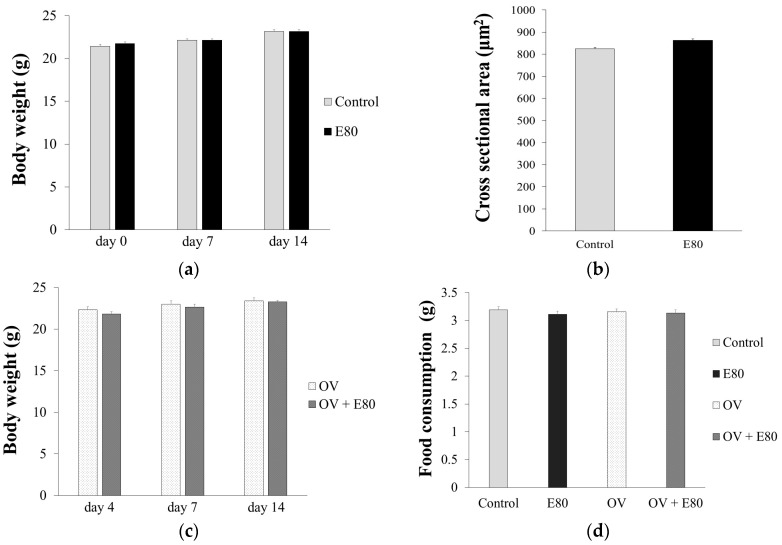
Figure 2.
E80 has no effect on food intake and growth. (a,b) Body weight change (a) and CSA (cross sectional area) of plantaris muscle (b) at day 14 in the control and E80 groups; (c) Body weight change at day 14 in the overload (OV) and OV + E80 groups; (d) Food consumption per day in the control, E80, OV, and OV + E80 groups. Values are presented as mean ± SEM (n = 8). SEM, standard error of mean.

