Abstract
Danshen, the dried root of Salvia miltiorrhiza Bge., is a widely used commercially available herbal drug, and unstable quality of different samples is a current issue. This study focused on a comprehensive and systematic method combining fingerprints and chemical identification with chemometrics for discrimination and quality assessment of Danshen samples. Twenty-five samples were analyzed by HPLC-PAD and HPLC-MSn. Forty-nine components were identified and characteristic fragmentation regularities were summarized for further interpretation of bioactive components. Chemometric analysis was employed to differentiate samples and clarify the quality differences of Danshen including hierarchical cluster analysis, principal component analysis, and partial least squares discriminant analysis. Consistent results were that the samples were divided into three categories which reflected the difference in quality of Danshen samples. By analyzing the reasons for sample classification, it was revealed that the processing method had a more obvious impact on sample classification than the geographical origin, it induced the different content of bioactive compounds and finally lead to different qualities. Cryptotanshinone, trijuganone B, and 15,16-dihydrotanshinone I were screened out as markers to distinguish samples by different processing methods. The developed strategy could provide a reference for evaluation and discrimination of other traditional herbal medicines.
Keywords: Salvia miltiorrhiza, fingerprint, chemometric, HPLC-MSn, chemical marker, quality evaluation
1. Introduction
The dried root of Salvia miltiorrhiza Bge. has been one of the most common traditional herbal medicines for a long time. It is called ‘Danshen’ in China which was first documented in the Chinese oldest pharmaceutical monograph, Shennong’s Classic of Materia Medica (Shennong Bencao Jing). As a popular medicine in clinical practice, Danshen plays an important role in the treatment of cardio-cerebrovascular diseases, chronic liver disease, cancer, and osteoporosis [1,2,3,4].
Two groups of the major representative constituents were been isolated from Danshen, which are hydrophilic phenolic acids and lipophilic diterpene quinones, containing danshensu (DSS), protocatechuic aldehyde (PAL), rosmarinic acid (RA), lithospermic acid, salvianolic acid B (SAB), dihydrotanshinone I (DI), cryptotanshinone (CT), tanshinone I (TI), and tanshinone IIA (IIA). Modern pharmacological studies have indicated that these chemicals have various biological activities, such as anti-myocardial ischemia [5], anti-cerebral ischemia [6,7], anti-atherosclerosis [8], anti-tumor [9,10,11], anti-thrombosis [12], anti-hepatocyte injury [13,14], renal protecting [15], anti-inflammatory [16,17,18], etc. The synergistic action of these various components is considered to be responsible for the therapeutic effects of Danshen.
Danshen is used extensively as a raw material in the pharmaceutical and natural product industries. However, decreasing resources and insufficient active ingredients have become more and more serious, which have a negative impact on the internal quality and clinical application of Danshen [19,20]. In this case, a reliable and comprehensive methodology should be developed to validly evaluate their quality.
As is known to all, the quality of traditional herbal medicines is closely related to the concentrations of their active ingredients. Because of multiple and synergistic components, we cannot choose only several specific components as essential criteria. Therefore, it is necessary to establish a multi-criteria quality evaluation system. Chemical fingerprint analysis method was proposed and accepted for the identification of authenticity, differentiation of origin, and evaluation of quality of herbal medicines and related products, which could display the holistic chemical profile obtained by various analytical techniques [21,22,23,24,25,26]. Recently, chemometrics have attracted increasing attention with the development of data mining methodologies, which could simplify complex data and find hidden information. Hierarchical cluster analysis (HCA), principal component analysis (PCA), and partial least squares discriminant analysis (PLS-DA) have been applied to discriminate the class and evaluate the quality of traditional Chinese medicines in existing studies [27,28,29,30]. There are some reports about fingerprint analysis of Danshen to characterize the whole chemical profile [31,32,33,34,35], but in those studies thorough chemometric analysis has not been performed on complex and rich chromatographic peak data to assess their quality, and chemical markers have not been picked as the most significant variables to distinguish Danshen samples of different quality. In addition, a few constituents were inferred and identified by LC-MS in Danshen, and the characteristic fragment information and fragmentation regularities were scattered across several studies. A more complete identification and analysis are required for further interpretation of the bioactive components and Danshen evaluation.
In this present study, 25 Danshen samples were collected. Chemical fingerprints were constructed by a high performance liquid chromatography with photodiode array detection method (HPLC-PDA) with simultaneous separation of phenolic acids and tanshinones. Then a technique, high performance liquid chromatography coupled with electrospray ionization hybrid linear ion trap-Orbitrap mass spectrometry (HPLC-ESI-LQT-Orbitrap/MS), was used for chromatographic peaks identification and mass fragment information characterization. Based on the fingerprint data, HCA, PCA and PLS-DA were undertaken to discriminate samples of different quality. The potential candidate markers were screened out which have the most influence on the quality separation among different groups of samples. This paper provided an objective and effective method of HPLC fingerprinting and component identification coupled with chemometrics for quality evaluation of Danshen.
2. Results and Discussion
2.1. Optimization of Extraction Conditions
In order to extract the co-existing water-soluble and fat-soluble ingredients from Danshen sufficiently and conveniently, the extraction conditions were optimized through single-factor tests such as solvent, extraction method, and duration. Different concentrations of methanol or ethanol were tested containing 10, 30, 50, 70, and 90% methanol; and 10, 30, 50, 70, and 90% ethanol. By comparing the number of chromatographic peaks and peak areas with the extraction of the different solvents, it was clear that, when 70% methanol was employed, the peaks and peak areas reached the highest values. Therefore, 70% methanol was selected as the extraction solvent. After extraction methods, including reflux and ultrasonication, were investigated. We found that there was no difference for the extraction of water-soluble ingredients between the two methods. However, compared with ultrasonic extraction, the concentrations of tanshinones were higher by reflux extraction. Thus, reflux extraction was regarded as the most suitable method. Finally, the different reflux times (0.5, 1, 1.5, 2 h) were performed to test their impact on the extraction efficiency. When the extraction time is equal to or greater than 1 h, the contents of two kinds of components were no longer increased. The results showed that all contents were almost extracted completely within 1 h. The above experiments suggested that samples were optimally extracted by refluxing with 20 mL of 70% methanol for 1 h.
2.2. Methodology Validation
The analytical method was validated for precision, repeatability, and stability. Peak 11 was chosen as a reference substance (SAB) to calculate relative retention times (RRTs) and relative peak areas (RPAs) of common peaks in all samples, because this peak existed in all chromatograms, which was present in the middle of the chromatogram with maximum content. In precision testing, six consecutive injections of one sample solution were analyzed on the same day. Precision of RRTs and RPAs did not exceed 0.525% and 2.17% in RSD, respectively. Six independent samples were extracted and determined in parallel for the evaluation of repeatability. The RSD of RRTs was less than 1.52% and the RSD of RPAs was less than 2.51%. The stability was assessed by measuring the one sample solution stored at 4 °C after 0, 2, 4, 8, 12, and 24 h. The RSDs of RRTs and RPAs of the common peaks were no more than 0.982% and 2.42%, respectively. These results indicated that the method established for the fingerprint analysis of Danshen is stable and reliable.
2.3. Chemical Fingerprint Establishment and SA
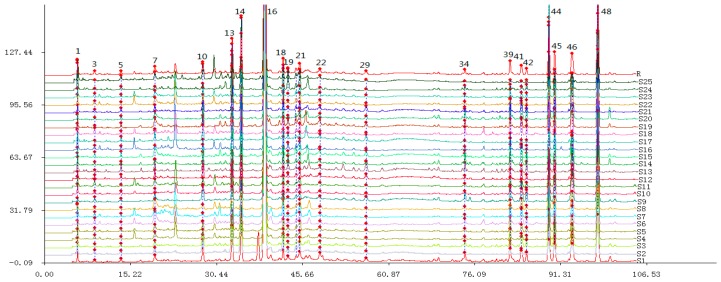
The fingerprints of Danshen samples were established under the HPLC conditions and then analyzed by Similarity Evaluation System. The simulative mean fingerprint R was generated, as well as the 21 common components that could be observed in fingerprints (Figure 1). Then, the determined common peaks were tentatively identified using HPLC-MSn technology and standard substances in the next section.
Figure 1.
HPLC fingerprints of different Danshen samples. Peak numbers are based on Table 2.
The sample HPLC fingerprints were compared with the simulative mean fingerprint R to calculate the similarity correlation coefficients, of which all values were in the range of 0.943 to 0.999 (Table 1). This showed that there were no significant differences in the type of chemical composition among various samples. According to the relevant regulations of SFDA [22], all collected samples were qualified due to their correlation coefficients being more than 0.900, and the established simulative mean fingerprint could be used as a standard fingerprint of Danshen samples. The fingerprint chromatography of different samples is different, and we could get the similarity values of each fingerprint by comparing each fingerprint with the standard fingerprint, which helps us to assess the quality of samples in the future. The peak area (PA) of each common peak could reflect the content of the corresponding active constituent and semi-quantitatively express the chemical properties of these samples. The RSDs of PAs of 21 common peaks were calculated between 23.4% and 81.4%. The total PA in each chromatographic fingerprint was also calculated and its RSD was 24.1%. These results indicated that the contents of active ingredients were quite different which might result in the quality difference, although chemotype was very similar between different samples. Then the pattern recognition methods were employed to assess the variation in quality.
Table 1.
Information summary and similarity values of tested samples.
| No. | Origins | Similarities | No. | Origins | Similarites |
|---|---|---|---|---|---|
| S1 | Shandong | 0.972 | S14 | Shanxi | 0.982 |
| S2 | Shandong | 0.997 | S15 | Shanxi | 0.994 |
| S3 | Shandong | 0.993 | S16 | Sichuan | 0.997 |
| S4 | Shandong | 0.999 | S17 | Sichuan | 0.991 |
| S5 | Shaanxi | 0.998 | S18 | Sichuan | 0.999 |
| S6 | Shaanxi | 0.999 | S19 | Jiangsu | 0.996 |
| S7 | Shaanxi | 0.997 | S20 | Jiangsu | 0.973 |
| S8 | Henan | 0.999 | S21 | Gansu | 0.997 |
| S9 | Henan | 0.943 | S22 | Hunan | 0.998 |
| S10 | Hebei | 0.999 | S23 | Hunan | 0.999 |
| S11 | Hebei | 0.999 | S24 | Yunnan | 0.998 |
| S12 | Hebei | 0.998 | S25 | Anhui | 0.994 |
| S13 | Shanxi | 0.975 |
2.4. Identification of Chemical Components in Danshen
The HPLC-MSn technique was applied for analysis and identification of the 21 common constituents from Danshen samples. In subsequent experiments, the ESI negative ion mode was more suitable for the water-soluble phenolic compounds while positive ion mode was set better for the fat-soluble tanshinones which could achieve high ionization efficiency and sensitive signal response. The deprotonated molecule [M − H] or protonated molecule [M + H]+ was selected as the precursor ion for collision-induced dissociation (CID) fragmentation to produce MS/MS product ion spectra. The most prominent product ion was then selected for further MSn analysis.
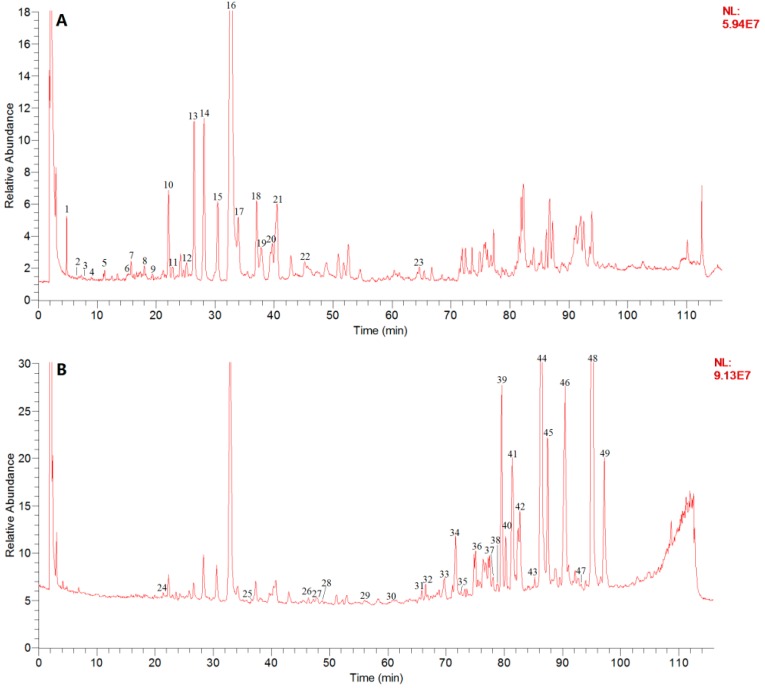
A total of 49 compounds, including 26 phenolic acids and 23 diterpenoid quinones, were deduced and identified (Table 2). Eight of the identified compounds were authenticated by comparison with reference standards including DSS, PAL, RA, SAB, DI, CT, DI, and IIA. The others were tentatively judged by interpreting their mass spectral behavior and comparing them with related literature data [36,37,38,39,40,41,42,43,44]. The total ion current (TIC) chromatograms are shown in Figure 2.
Table 2.
Identification of compounds in Danshen by HPLC-MSn.
| ID | tR (min) | Mass Ion (m/z) | Data-Dependent MSn Data (m/z) | Identification |
|---|---|---|---|---|
| 1 a | 4.79 | [M − H]⁻ 197.0452 | MS2:178.9395 MS3: 134.9681, 106.9022 | Danshensu |
| 2 | 6.19 | [M − H]⁻ 153.0191 | MS2: 109.0295 | Protocatechuic acid |
| 3 | 7.98 | [M − H]⁻ 341.1076 | MS2:178.9334, 160.8835, 112.8926 | 1-O-caffeoyl glucose |
| 4 a | 8.96 | [M − H]⁻ 137.0242 | MS2: 109.0310 | Protocatechuic aldehyde |
| 5 | 13.43 | [M − H]⁻ 179.0344 | MS2: 135.0451 | Caffeic acid |
| 6 | 15.10 | [M − H]⁻ 683.1226 | MS2: 665.2238, 621.3198, 441.1573 | 3,4-Dihydroxy-(1α,3α,4α,5β)-1-carboxy-4-hydroxy-1,3,5-cyclohexanetriyl ester-benzenepropanoic acid |
| 7 | 15.74 | [M − H]⁻ 313.0707 | MS2: 269.0386, 158.9700, 108.8062 | Salvianolic acid F |
| 8 | 17.97 | [M − H]⁻ 539.1178 | MS2: 521.1625, 495.3337, 359.1708, 341.1323, 297.1190 | Yunnaneic acid D/isomer |
| 9 | 19.34 | [M − H]⁻ 521.1287 | MS2: 498.5744, 477.9366, 359.1708, 341.1323, 297.1190 | Salviaflaside |
| 10 | 22.09 | [M − H]⁻ 339.0501 | MS2: 320.9998, 294.9889, 184.9634 | Salvianolic acid G |
| 11 | 22.76 | [M − H]⁻ 735.1541 | MS2: 716.9385, 537.1756, 519.1987, 555.0787 | Hydrosalvianolic acid B |
| 12 | 25.17 | [M − H]⁻ 717.1436 | MS2: 693.3942, 519.1561, 321.0740, 537.1210 | Iso salvianolic acid E |
| 13 a | 26.43 | [M − H]⁻ 359.0763 | MS2: 341.1426, 160.8524, 197.0617, 178.8373 MS3: 160.9093, 132.8333 |
Rosmarinic acid |
| 14 | 28.12 | [M − H]⁻ 537.1038 | MS2: 493.1133, 313.0726, 295.0606 | Lithospermic acid |
| 15 | 28.51 | [M − H]⁻ 749.1708 | MS2: 717.2390, 551.2418, 321.1771 | 8-Hydroxy-9''-methyl-salvianolate B |
| 16 a | 32.67 | [M − H]⁻ 717.1426 | MS2: 519.1459, 321.1666 MS3: 359.1635, 322.9468 |
Salvianolic acid B |
| 17 | 33.94 | [M − H]⁻ 717.1445 | MS2: 519.1002, 321.1299 | Iso salvianolic acid B |
| 18 | 37.06 | [M − H]⁻ 717.1447 | MS2: 673.0787, 519.1280, 321.0964 | Salvianolic acid L |
| 19 | 38.03 | [M − H]⁻ 493.1127 | MS2: 475.0607, 313.1490, 295.0408 | Salvianolic acid A |
| 20 | 39.86 | [M − H]⁻ 731.1599 | MS2: 713.0930, 533.1845, 335.1095 | Methyl salvianolic acid B |
| 21 | 40.50 | [M − H]⁻ 551.1185 | MS2: 519.1639, 353.0330, 321.0014 | Methyl salvianolic acid I/H |
| 22 | 45.70 | [M − H]⁻ 717.6401 | MS2: 673.2368, 617.6599, 519.1243, 321.1423 | Salvianolic acid E |
| 23 | 64.63 | [M − H]⁻ 505.1127 | MS2: 473.1639, 321.1718 | Methyl salvianolate C |
| 24 | 21.35 | [M + H]+ 315.1228 | MS2: 297.0677, 266.9693, 249.0071 | 17-Hydroxytanshindiol B |
| 25 | 37.09 | [M + H]+ 313.1072 | MS2: 294.9926, 264.9864, 247.0231 | Tanshinone A |
| 26 | 46.34 | [M + H]+ 297.1122 | MS2: 279.0668, 250.9774, 223.1107 | Tanshinone VI |
| 27 | 47.88 | [M + H]+ 297.1127 | MS2: 279.0222, 269.0689, 251.0355 | Danshenxinkun A |
| 28 | 48.81 | [M + H]+ 299.1283 | MS2: 281.0504, 263.0121 | 15,16-Dihydrotanshinol B |
| 29 | 56.29 | [M + H]+ 313.1437 | MS2: 295.0622, 277.0113, 267.0143 | Tanshindiol B |
| 30 | 60.48 | [M + H]+ 313.1440 | MS2: 295.0879, 277.0540, 267.0566, 249.0650 | Tanshindiol C |
| 31 | 65.82 | [M + H]+ 295.0967 | MS2: 276.9836, 267.0344, 252.9953,249.0193 | 3α-Hydroxymethylenetanshinquinone |
| 32 | 66.45 | [M + H]+ 297.1124 | MS2: 279.0198, 261.0336 | Tanshinol B |
| 33 | 70.11 | [M + H]+ 295.0966 | MS2: 277.0328, 267.0656 | Trijuganone A |
| 34 | 71.64 | [M + H]+ 311.1276 | MS2: 293.0745, 267.0956MS3: 275.0365, 251.0166 | Tanshinone IIB |
| 35 | 71.86 | [M + H]+ 311.1279 | MS2: 293.0213, 275.0118, 267.0738 | 3α-Hydroxytanshinone IIA |
| 36 | 74.83 | [M + H]+ 341.1381 | MS2: 281.0114, 263.0162 | Methyldihydronortanshinonate |
| 37 | 78.02 | [M + H]+ 309.1119 | MS2: 281.0635 | Tanshinaldehyde |
| 38 | 78.92 | [M + H]+ 311.1280 | MS2: 293.0916, 283.0533, 267.0832 | 17-Hydroxycryptotanshinone |
| 39 a | 79.33 | [M + H]+ 279.1015 | MS2: 260.9656, 233.0795 | 15,16-Dihydrotanshinone I |
| 40 | 80.23 | [M + H]+ 297.1483 | MS2: 269.1145, 279.0749, 251.1033 MS3: 251.0895, 241.0596 |
1-Oxomiltirone |
| 41 | 81.76 | [M + H]+ 281.1177 | MS2: 263.0103, 252.9724, 235.0020 MS3: 234.9965, 220.9875 |
Trijuganone B |
| 42 | 82.68 | [M + H]+ 339.1228 | MS2: 311.0540, 279.0392, 261.1021 MS3: 260.9993 |
Methyl tanshinonate |
| 43 | 85.19 | [M + H]+ 267.1381 | MS2: 249.0448, 224.9753 | 4-Methylenemiltirone |
| 44 a | 86.29 | [M + H]+ 297.1481 | MS2: 279.1028, 251.0883, 237.0703 MS3: 264.0307, 251.0550, 237.0704, |
Cryptotanshinone |
| 45 a | 87.42 | [M + H]+ 277.0855 | MS2: 249.0238, 231.058.9814 | Tanshinone I |
| 46 | 90.41 | [M + H]+ 279.1016 | MS2: 260.9862, 233.0613, 221.0357, 258.9814 | 1,2-Dihydrotanshinone I /3,4-dihydrotanshinone I |
| 47 | 93.18 | [M + H]+ 281.1539 | MS2: 220.9732, 253.0703, 263.1043, 239.0273 | 1,2-Didehydromiltirone |
| 48 a | 95.04 | [M + H]+ 295.1327 | MS2: 277.0313, 249.1205, 235.0146 | Tanshinone IIA |
| 49 | 97.18 | [M + H]+ 283.1689 | MS2: 265.0710, 241.0755, 237.0394, 223.0768 MS3: 250.0806,237.0400, 223.0643, 195.0449 |
Miltirone |
a Positively identified via comparison with reference standards.
Figure 2.
(A) TIC chromatogram in negative mode and (B) TIC chromatogram in positive mode of Danshen. The peak numbers are based on Table 2.
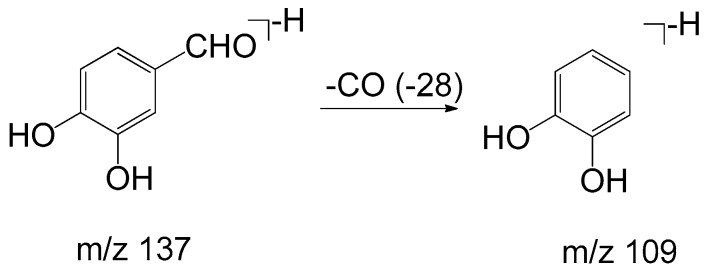
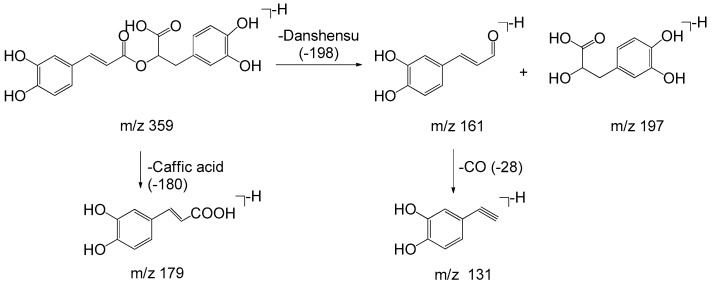
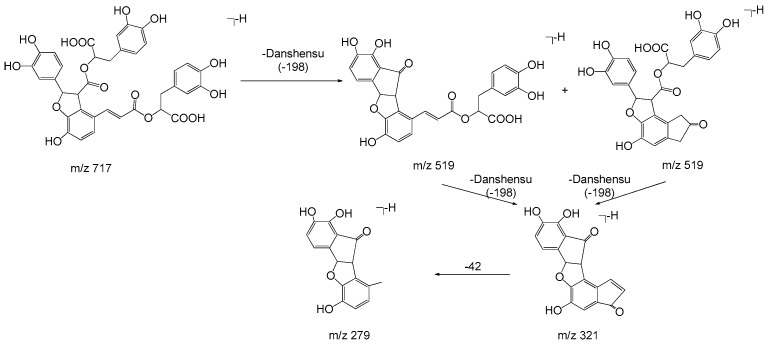
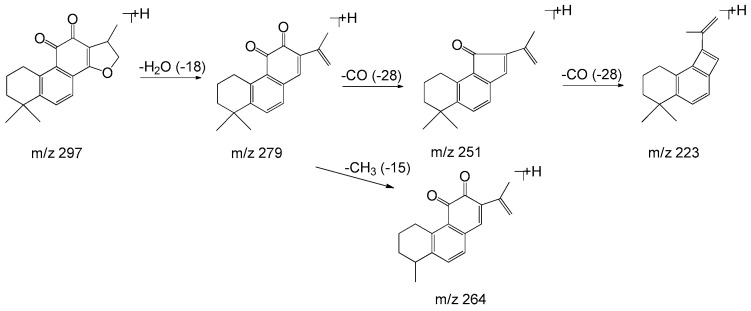
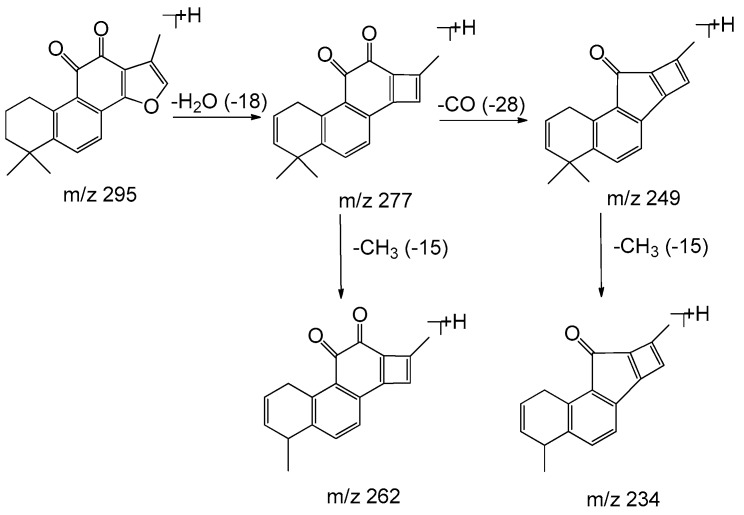
Monomers of phenolic acids include DSS, caffeic acid, protocatechuic acid, and PAL which have only phenyl group. The [M − H]⁻ ion at m/z 197 of DSS produced [M − H − H2O]⁻ (m/z 179) and [M − H − H2O − CO2]⁻ (m/z 135) due to the existence of hydroxyl and carboxyl group, and the [M − H]⁻ ion at m/z 137 of PAL produced the fragment of [M − H − CO]⁻ (m/z 109). As for dimers, trimers, and tetramers such as RA and SAB, their spectra exhibited [M − H − 198]⁻, [M − H − 198 − 180]⁻, and [M − H − 198 − 198]⁻ ions corresponding to the loss of DSS (198 Da) and caffeic acid (180 Da), respectively. The fragment ions of tanshinones are mainly involved in the loss of a molecule of H2O [M + H − 18]+ due to enolic rearrangement of a ketonic group. Further loss of CO from these fragment ions gave rise to [M + H − 28]+. Besides, the prominent ions of [M + H − 18 − 15]+ or [M + H − 28 − 15]+ were further formed by loss of a methyl group. The proposed fragmentation pathways of the typical phenolic acids and tanshinones are illustrated in Figure 3, Figure 4, Figure 5, Figure 6, Figure 7, Figure 8 and Figure 9.
Figure 3.
The proposed fragmentation pathway of Danshensu.
Figure 4.
The proposed fragmentation pathway of protocatechuic aldehyde.
Figure 5.
The proposed fragmentation pathway of rosmarinic acid.
Figure 6.
The proposed fragmentation pathway of salvianolic acid B.
Figure 7.
The proposed fragmentation pathway of cryptotanshinone.
Figure 8.
The proposed fragmentation pathway of tanshinone I.
Figure 9.
The proposed fragmentation pathway of tanshinone IIA.
2.5. Chemometric Analysis
2.5.1. HCA
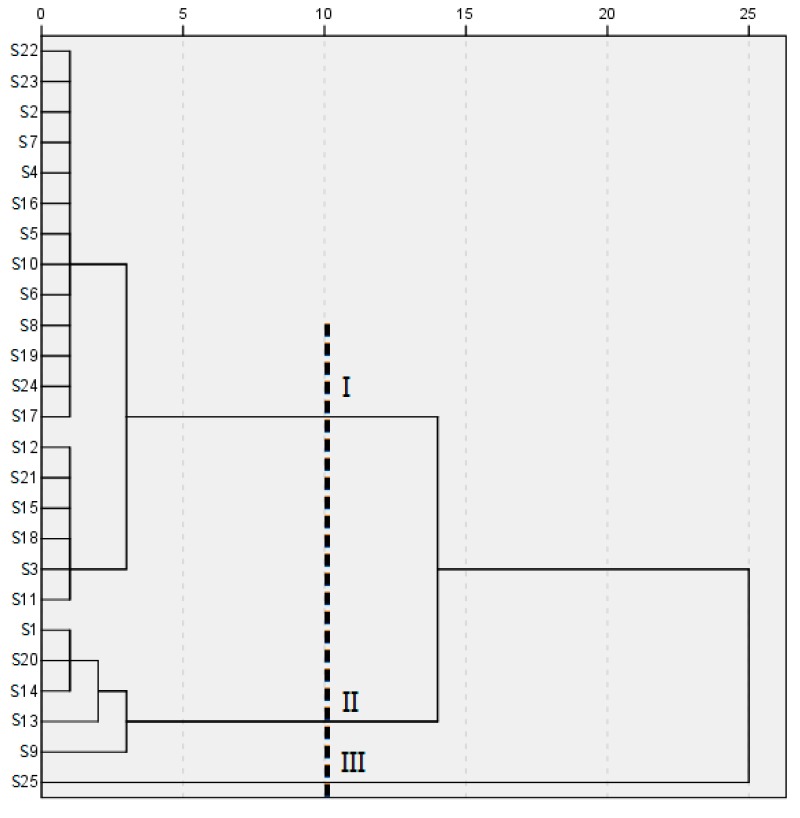
In order to evaluate resemblance and dissimilarities of Danshen samples based on the fingerprint data, HCA was performed which could divide tested samples into different categories. Individuals within the same category should have the highest possible homogeneity and the highest possible heterogeneity should exist between different categories. Figure 10 displays the dendrogram which was generated with PAs of the 21 common components from 25 fingerprints and formed a 21 × 25 matrix. These samples were sorted into three clusters, reflecting the difference in quality of Danshen samples from the viewpoint of active ingredient contents. With the purpose of investigating the reasons for sample classification, we had studied the grouped samples one by one in every detail from its marks (the collection date, cultivation methods, geographic origins, and processing methods) to total PA of common peaks in each fingerprint which could reveal the total content of active constituents. From the dendrogram, samples were mixed together and not grouped strictly on the basis of their origins. Yet samples processed by sweating or sun curing were grouped into the same class (cluster I) and most of the samples dried in the shade were in cluster II except S15 and S19. The sample dried in the oven belonged to cluster III. It was suspected that sample classification might be relevant to processing method rather than the origin. Then all samples were treated by different processing methods respectively, including sun curing, shade drying, oven drying, and sweating, to explore the impact on metabolites caused by geographical origins and processing methods. The results showed that the samples processed by the same method were similar on fingerprints and total PA of common peaks and we could rule out the influence of origin on sample quality. However, there were significant differences between samples which were from the same location but treated by different processing methods, it indicated the processing method could affect the internal chemical profile. In addition, the total content of common ingredients was the highest in cluster II, followed in decreasing orders by cluster III and cluster I. Therefore, we could come to the conclusion that the processing method had a more obvious impact on sample classification than the geographical origin, it induced the different content of bioactive compounds and finally lead to different qualities. Next, the other chemometric analysis was taken into consideration to measure the degree of the similarity among the samples in the same cluster, and pick a few key chemical markers for explaining sample variation.
Figure 10.
HCA dendrogram of different Danshen samples.
2.5.2. PCA
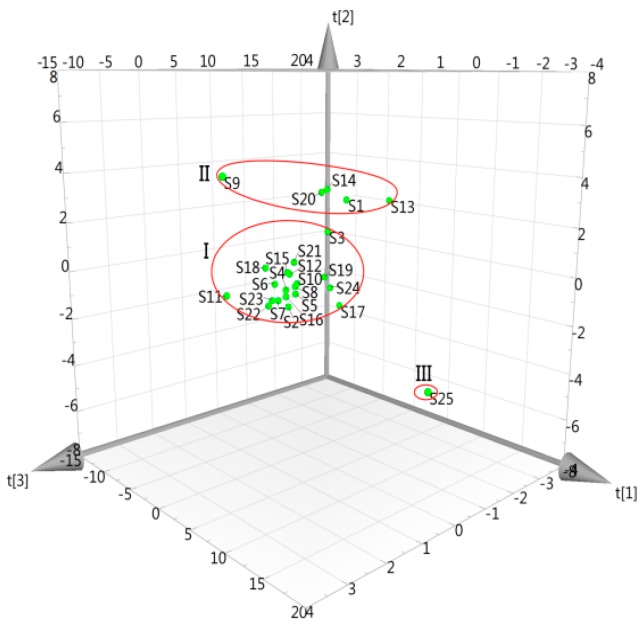
The fingerprints are usually wide data matrices, characterized by a very large number of variables. PCA is a simple non-parametric method widely used for sample categorization further by data compression and information extraction [45]. It could fit a small number of underlying factors called principal components (PCs) which were unique, mutually exclusive, and accounted for as much of the variable information as possible [28,46]. In accordance with Eigenvalue >1, the first three PCs were extracted and explained 71.0, 18.0, and 5.29% of the total variability, respectively. All three PCs could accumulate about 94.3% data variance, and the roles of other PCs were insignificant. The 3D score plot of the first three PCs is showed in Figure 11, where each axis represents a PC and all samples could be separated into three groups. S25 was outside the scope of Hotelling’s T2 ellipse, which meant notable differences with others due to the different processing methods. The dissimilarities of Danshen samples were observed intuitively, indicating that the contents of common ingredients were different in spite of similar chemotypes. Moreover, the samples in cluster I were scattered in a larger region compared with those of cluster II and III. It demonstrated that the products of cluster I had a larger quality fluctuation than those by other processing methods. In our study, the PCA classification results were consistent with HCA results and this method provided a more reliable evidence for the discrimination of Danshen. However, it was still not clear which major compounds caused the classification of these samples. Therefore, a PLS-DA technique development is necessary to find out definite indexes of describing the differences.
Figure 11.
3D score plot of PCA on the first three PCs for Danshen samples.
2.5.3. PLS-DA
PLS-DA was conducted as a supervised recognition pattern technique to optimize classification and screen out the main chemical markers responsible for the sample variation. At the time of establishing the model, it is very important to select the optimal number of latent variables, which could avoid over-fitting and improve the reliability and accuracy of the modeling results. By analyzing the relationship between X variables and Y variables, samples can be also sorted into diverse groups vividly to confirm the classification results by means of the HCA. The profile of variables important for the projection (VIP) suggests the contributions of each X variable and helps to find out the main chemical markers for categories differentiation [47].
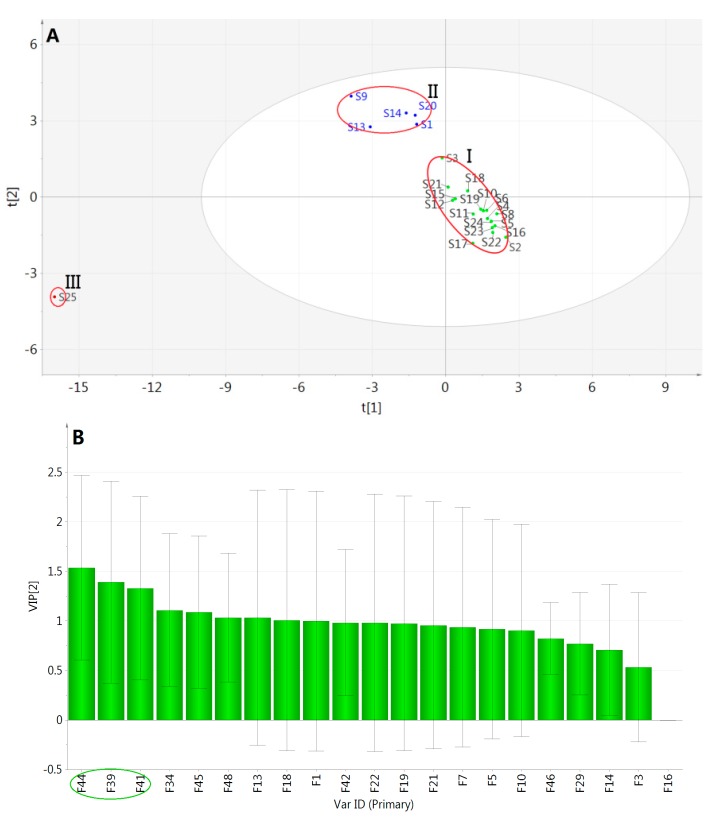
The selected optimal number of latent variables was two for building a PLS-DA model. The values of R2X, R2Y, and Q2 were 0.890, 0.886, and 0.746, respectively, which showed that this model had better fitting and predictive ability in data processing. Then, a permutation test was performed to validate the model and the result of 200 permutations was that the vertical intercept values of R2 and Q2 were −0.00537 and −0.261 respectively, indicating that the established model avoided an over-fitting problem and improved the forecasting accuracy effectively. Based on a 2D score plot of the two latent variables (Figure 12A), the test samples were excellently divided into three categories which were in agreement with HCA and PCA results. The VIP profile (Figure 12B) was constructed to measure the importance of X variables on sample discrimination, and the VIP values of many variables were greater than 1, which figured that these X variables were rather meaningful for distinguishing between Danshen samples. Among them, peaks 44, 41, and 39 might have more substantial influence which represented cryptotanshinone, trijuganone B, and 15,16-dihydrotanshinone I, respectively. Then the total PA of the above three components in each fingerprint were analyzed, which could reflect the total content of marker constituents. It was found that the values in cluster II were the highest, followed in decreasing orders by cluster III and cluster I, indicating that there were more obvious differences in the contents of these components among different clusters than others’ contents. Thus, the three components could be considered as the chemical markers to discriminate Danshen samples by different processing methods.
Figure 12.
(A) 2D score plot of the two latent variables and (B) VIP plot for Danshen samples based on PLS-DA.
3. Materials and Methods
3.1. Materials and Reagents
DSS, PAL, RA, SAB, DI, CT, TI, and IIA were purchased from Chengdu Must Biotechnology Co., Ltd. (Chengdu, China). Their purity was above 98% by HPLC analysis.
HPLC grade acetonitrile and formic acid (Fisher, Fair Lawn, NJ, USA) were used for HPLC analysis. Distilled water was supplied by Watsons Group Co., Ltd. (Beijing, China). Methanol and other reagents were all of analytical grade and obtained from Beijing Chemical Factory (Beijing, China).
The fresh roots of annual Danshen were collected in later October from different provinces in China and processed by the local and common drying methods (Table 1). S1, S9, S13–15, S19–20 were placed in the shade to dry. S16–18 from Sichuan Province were treated by sweating method, the procedure is as follows: dry the fresh roots in the sun to a semi-dry state, then pile up them for four days to make the internal moisture spillover, when the inner core of the roots becomes purplish red, intermediate products are spread out to dry totally in the sun. S25 from Anhui Province was heated in an oven at 60 °C. Others were dried by the sunlight directly. All dry Danshen samples were authenticated by Prof. Lanzhen Zhang, School of Chinese Materia Medica, Beijing University of Chinese Medicine. Then these materials were cut into small pieces and further crushed into powder, passed through a 40-mesh (0.420 mm) sieve, and stored in a brown desiccator at laboratory temperature (25 °C approx.) before analysis.
3.2. Instrumentation and Chromatographic Conditions
3.2.1. HPLC Instrumentation and Chromatographic Conditions
A Waters e2698 HPLC system (Waters, Milford, MA, USA) was equipped with a photodiode array detector, a quaternary solvent delivery pump, an online degasser, a column temperature controller, and an auto sampler. System control and data analysis were processed with Empower 3 software (Waters). The separation was performed on a DIKMA Diamonsil C18 column (250 mm × 4.6 mm, 5 µm).
The mobile phase was composed with solvent A (acetonitrile) and solvent B (0.2% aqueous formic acid) with a gradient elution program: 0–15 min, 10–18% A; 15–35 min, 18–25% A; 35–45 min, 25–30% A; 45–55 min, 30% A; 55–75 min, 30–55% A; 75–85 min, 55–67% A; 85–100 min, 67–79% A; 100–101 min, 79–90% A; 101–110 min, 90% A. The constant flow rate was 1 mL/min and the column was maintained at 30 °C. The injection volume was 20 µL and the detection wavelength was set at 270 nm.
3.2.2. HPLC-MSn Instrumentation and Chromatographic Conditions
The mass analysis was performed on an LTQ-Orbitrap mass spectrometer which was equipped with a Thermo Accela 600 HPLC system and an ESI source (Thermo Fisher Scientific, Bremen, Germany). The chromatographic condition was same as the described in Section 3.2.1. The source parameters in negative and positive ionization mode were as follows: source voltage, −3.0 kV(−)/4.0 kV (+); capillary voltage, −35 V(−)/25 V(+); tube lens voltage, −100 V(−)/100 V(+); capillary temperature, 350 °C; vaporizer temperature, 300 °C; sheath gas, 30 arbitrary units; auxiliary gas, 10 arbitrary units. The sample solution was first analyzed in full MS mode with a resolution of 30,000. The successive analyses were done in data-dependent MSn mode, in which the three most intense ions were isolated and fragmented by CID with normalized collision energy of 35% and an isolation width of 2 m/z units. The mass scan range was from m/z 100 to 1000. For avoiding repeated data collection, the dynamic exclusion was activated with exclusion duration of 60 s, and the exclusion was repeated for 30 s with the repeat count at 5. Data were processed by Xcalibur 2.1 software (Thermo Fisher Scientific). Before the analysis, the external calibration was carried out and the measured masses were within 5 ppm of the theoretical masses.
3.3. Preparation of Sample and Standard Solutions
Each powder sample (0.2 g) was weighed and extracted with 20 mL of 70% methanol in a refluxing bath for 1 h. After centrifugation at 13,000 rpm for 10 min, the supernatant was transferred into a HPLC sample vial and injection. The mixed standard solution was prepared at concentrations of 81.0 µg/mL DSS, 9.74 µg/mL PAL, 28.2 µg/mL RA, 33.2 µg/mL SAB, 7.50 µg/mL DI, 6.60 µg/mL CT, 10.8 µg/mL TI, and 5.71 µg/mL IIA in 70% methanol. These solutions were stored at 4 °C.
3.4. Data Analysis
3.4.1. Similarity Analysis (SA)
All chromatographic data of 25 different batches of samples was mined and analyzed. Similarity analysis was performed by professional software—Similarity Evaluation System for Chromatographic Fingerprint of Traditional Chinese Medicine (Version 2004A, Chinese Pharmacopoeia Committee). The simulative mean fingerprint R of Danshen was generated and the similarity values of these samples with mean fingerprint R were calculated. Then the common peaks existing in Danshen were observed and the RRT and RPA of each common peak were also calculated.
3.4.2. Chemometric Analysis
In order to find out the quality similarities and differences between various samples, chemometric analysis was performed including HCA, PCA, and PLS-DA. In HCA program, a dendrogram was drawn to characterize the classification results of the samples by Ward’s linkage as the cluster method and squared Euclidean distance as the metric using SPSS 20.0 software (SPSS, Chicago, IL, USA). PCA was carried out by SIMCA-P 13.0 software (Umetrics AB, Umea, Sweden) and SPSS 20.0. The important PCs were exacted on the condition that corresponding eigenvalues were greater than 1. The sample variation could be assessed from the score plot. PLS-DA was processed by the SIMCA-P 13.0 software which helps to screen out the main markers responsible for discrimination.
4. Conclusions
In the present research, a comprehensive method was developed combining the HPLC fingerprints and chemical identification with chemometric analysis to discriminate and assess Danshen samples. The chemical fingerprints were established and 21 common peaks were observed among the 25 samples, and these peaks were identified by HPLC-MSn technique. Their characteristic fragment information and fragmentation regularities were summarized in detail for further interpretation of bioactive components. Although there was similar chemical composition between different samples, their contents were very different which might result in the quality difference. Chemometrics were applied to evaluate quality of Danshen—including HCA, PCA, and PLS-DA—and the test samples could be divided into three categories. By analyzing the reasons for sample classification, it was revealed that the processing method had a more obvious impact on sample classification than the geographical origin, it induced the different content of bioactive compounds and finally lead to different qualities. Then three characteristic markers (cryptotanshinone, trijuganone B, and 15,16-dihydrotanshinone I) were screened out as the most significant variables to distinguish Danshen samples by different processing methods. The established approach is reliable, sensitive, and promising for accurate discrimination and quality assessment of Danshen.
Acknowledgments
This study was supported by the National Science and Technology Support Plan of China (NO. 2012BAI29B01).
Author Contributions
Lanzhen Zhang and Wenyi Liang conceived and designed the experiments; Wenyi Liang, Wenjing Chen, Qi Qi, and Shi Li performed the experiments; Wenyi Liang and Lingfang Wu analyzed the data; Yaping Cui, Linjin Liang, and Ting Ye contributed Danshen samples; Wenyi Liang wrote the paper. Lanzhen Zhang and Wenyi Liang revised the paper.
Conflicts of Interest
The authors declare no conflict of interest.
Footnotes
Sample Availability: Samples are available from the authors.
References
- 1.Su C.Y., Ming Q.L., Rahman K., Han T., Qin L.P. Salvia miltiorrhiza: Traditional medicinal uses, chemistry, and pharmacology. Chin. J. Nat. Med. 2015;13:163–182. doi: 10.1016/S1875-5364(15)30002-9. [DOI] [PubMed] [Google Scholar]
- 2.Hong M., Li S., Tan H.Y., Wang N., Tsao S.W., Feng Y.B. Current status of herbal medicines in chronic liver disease therapy: The biological effects, molecular targets and future prospects. Int. J. Mol. Sci. 2015;16:28705–28745. doi: 10.3390/ijms161226126. [DOI] [PMC free article] [PubMed] [Google Scholar]
- 3.Chen X., Guo J., Bao J., Lu J., Wang Y. The anticancer properties of Salvia miltiorrhiza Bunge (Danshen): A systematic review. Med. Res. Rev. 2014;34:768–794. doi: 10.1002/med.21304. [DOI] [PubMed] [Google Scholar]
- 4.Guo Y., Li Y., Xue L., Severino R.P., Gao S., Niu J., Qin L.P., Zhang D., Bromme D. Salvia miltiorrhiza: An ancient Chinese herbal medicine as a source for anti-osteoporotic drugs. J. Ethnopharmacol. 2014;155:1401–1416. doi: 10.1016/j.jep.2014.07.058. [DOI] [PubMed] [Google Scholar]
- 5.Yin Y., Guan Y., Duan J.L., Wei G., Zhu Y.R., Quan W., Guo C., Zhou D., Wang Y.H., Xi M.M., Wen A.D. Cardioprotective effect of Danshensu against myocardial ischemia/reperfusion injury and inhibits apoptosis of H9c2 cardiomyocytes via Akt and ERK1/2 phosphorylation. Eur. J. Pharmacol. 2013;699:219–226. doi: 10.1016/j.ejphar.2012.11.005. [DOI] [PubMed] [Google Scholar]
- 6.Lv H.D., Wang L., Shen J.C., Hao S.J., Ming A.M., Wang X.D., Su F., Zhang Z.C. Salvianolic acid B attenuates apoptosis and inflammation via SIRT1 activation in experimental stroke rats. Brain Res. Bull. 2015;115:30–36. doi: 10.1016/j.brainresbull.2015.05.002. [DOI] [PubMed] [Google Scholar]
- 7.Lee J.C., Park J.H., Park O.K., Kim I.H., Yan B.C., Ahn J.H., Kwon S.H., Choi J.H., Kim J.D., Won M.H. Neuroprotective effects of tanshinone I from Danshen extract in a mouse model of hypoxia-ischemia. Anat. Cell Biol. 2013;46:183–190. doi: 10.5115/acb.2013.46.3.183. [DOI] [PMC free article] [PubMed] [Google Scholar]
- 8.Zhao W.W., Li C.X., Gao H.W., Wu Q., Shi J.S., Chen X.P. Dihydrotanshinone I attenuates atherosclerosis in ApoE-deficient mice: Role of NOX4/NF-kappaB mediated lectin-like oxidized LDL receptor-1 (LOX-1) of the endothelium. Front. Pharmacol. 2016;7:418. doi: 10.3389/fphar.2016.00418. [DOI] [PMC free article] [PubMed] [Google Scholar]
- 9.D’Agostino V.G., Lal P., Mantelli B., Tiedje C., Zucal C., Thongon N., Gaestel M., Latorre E., Marinelli L., Seneci P., et al. Dihydrotanshinone-I interferes with the RNA-binding activity of HuR affecting its post-transcriptional function. Sci. Rep. 2015;5:16478. doi: 10.1038/srep16478. [DOI] [PMC free article] [PubMed] [Google Scholar]
- 10.Zhang L.J., Chen L., Lu Y., Wu J.M., Xu B., Sun Z.G., Zheng S.Z., Wang A.Y. Danshensu has anti-tumor activity in B16F10 melanoma by inhibiting angiogenesis and tumor cell invasion. Eur. J. Pharmacol. 2010;643:195–201. doi: 10.1016/j.ejphar.2010.06.045. [DOI] [PubMed] [Google Scholar]
- 11.Zhang Y., Won S.H., Jiang C., Lee H.J., Jeong S.J., Lee E.O., Zhang J., Ye M., Kim S.H., Lu J. Tanshinones from Chinese medicinal herb Danshen (Salvia miltiorrhiza Bunge) suppress prostate cancer growth and androgen receptor signaling. Pharm. Res. 2012;29:1595–1608. doi: 10.1007/s11095-012-0670-3. [DOI] [PubMed] [Google Scholar]
- 12.Huang Z.S., Zeng C.L., Zhu L.J., Jiang L., Li N., Hu H. Salvianolic acid A inhibits platelet activation and arterial thrombosis via inhibition of phosphoinositide 3-kinase. J. Thromb. Haemost. 2010;8:1383–1393. doi: 10.1111/j.1538-7836.2010.03859.x. [DOI] [PubMed] [Google Scholar]
- 13.Chan K.W., Ho W.S. Anti-oxidative and hepatoprotective effects of lithospermic acid against carbon tetrachloride-induced liver oxidative damage in vitro and in vivo. Oncol. Rep. 2015;34:673–680. doi: 10.3892/or.2015.4068. [DOI] [PubMed] [Google Scholar]
- 14.Park E.J., Zhao Y.Z., Kim Y.C., Sohn D.H. PF2401-SF, standardized fraction of Salvia miltiorrhiza and its constituents, tanshinone I, tanshinone IIA, and cryptotanshinone, protect primary cultured rat hepatocytes from bile acid-induced apoptosis by inhibiting JNK phosphorylation. Food Chem. Toxicol. 2007;45:1891–1898. doi: 10.1016/j.fct.2007.04.005. [DOI] [PubMed] [Google Scholar]
- 15.Yao G., Xu L.Z., Wu X.C., Xu L.L., Yang J.Y., Chen H.M. Preventive effects of salvianolic acid B on transforming growth factor-beta1-induced epithelial-to-mesenchymal transition of human kidney cells. Biol. Pharm. Bull. 2009;32:882–886. doi: 10.1248/bpb.32.882. [DOI] [PubMed] [Google Scholar]
- 16.Ding M., Ye T.X., Zhao G.R., Yuan Y.J., Guo Z.X. Aqueous extract of Salvia miltiorrhiza attenuates increased endothelial permeability induced by tumor necrosis factor-alpha. Int. Immunopharmacol. 2005;5:1641–1651. doi: 10.1016/j.intimp.2005.05.005. [DOI] [PubMed] [Google Scholar]
- 17.Tang S., Shen X.Y., Huang H.Q., Xu S.W., Yu Y., Zhou C.H., Chen S.R., Le K., Wang Y.H., Liu P.Q. Cryptotanshinone suppressed inflammatory cytokines secretion in RAW264.7 macrophages through inhibition of the NF-kappaB and MAPK signaling pathways. Inflammation. 2011;34:111–118. doi: 10.1007/s10753-010-9214-3. [DOI] [PubMed] [Google Scholar]
- 18.Li X., Yang J.H., Jin Y., Jin F., Kim D.Y., Chang J.H., Kim J.A., Son J.K., Moon T.C., Son K.H., et al. 15,16-Dihydrotanshinone I suppresses IgE-Ag stimulated mouse bone marrow-derived mast cell activation by inhibiting Syk kinase. J. Ethnopharmacol. 2015;169:138–144. doi: 10.1016/j.jep.2015.04.022. [DOI] [PubMed] [Google Scholar]
- 19.Peng L., Ru M., Wang K.R., Li B., Wang Y.C., Xia P.G., Liang Z.S. Spaceflight environment-induced variation in root yield and active constituents of Salvia miltiorrhiza. Planta Med. 2014;80:1029–1035. doi: 10.1055/s-0034-1382908. [DOI] [PubMed] [Google Scholar]
- 20.Zhang Y., Li X., Wang Z.Z. Diversity evaluation of Salvia miltiorrhiza using ISSR markers. Biochem. Genet. 2013;51:707–721. doi: 10.1007/s10528-013-9600-2. [DOI] [PubMed] [Google Scholar]
- 21.WHO . General Guidelines for Methodologies on Research and Evaluation of Traditional Medicine. World Health Organization; Geneva, Switzerland: 2000. [Google Scholar]
- 22.SFDA . Technical Requirements for the Development of Fingerprints of TCM Injections. State Food and Drug Administration of China; Beijing, China: 2000. [Google Scholar]
- 23.Ji Z.C., Sun W.Y., Sun G.X., Zhang J. Monitoring the quality consistency of Fufang Danshen Pills using micellar electrokinetic chromatography fingerprint coupled with prediction of antioxidant activity and chemometrics. J. Sep. Sci. 2016;39:3019–3027. doi: 10.1002/jssc.201600334. [DOI] [PubMed] [Google Scholar]
- 24.Lucio-Gutierrez J.R., Coello J., Maspoch S. Enhanced chromatographic fingerprinting of herb materials by multi-wavelength selection and chemometrics. Anal. Chim. Acta. 2012;710:40–49. doi: 10.1016/j.aca.2011.10.010. [DOI] [PubMed] [Google Scholar]
- 25.Wei H., Sun L.N., Tai Z.G., Gao S.H., Xu W., Chen W.S. A simple and sensitive HPLC method for the simultaneous determination of eight bioactive components and fingerprint analysis of Schisandra sphenanthera. Anal. Chim. Acta. 2010;662:97–104. doi: 10.1016/j.aca.2009.12.039. [DOI] [PubMed] [Google Scholar]
- 26.Xie Y.Y., Xiao X., Luo J.M., Fu C., Wang Q.W., Wang Y.M., Liang Q.L., Luo G.A. Integrating qualitative and quantitative characterization of traditional Chinese medicine injection by high-performance liquid chromatography with diode array detection and tandem mass spectrometry. J. Sep. Sci. 2014;37:1438–1447. doi: 10.1002/jssc.201400129. [DOI] [PubMed] [Google Scholar]
- 27.Fan G., Deng R., Zhou L., Meng X., Kuang T., Lai X., Zhang J., Zhang Y. Development of a rapid resolution liquid chromatographic method combined with chemometrics for quality control of Angelicae dahuricae radix. Phytochem. Anal. 2012;23:299–307. doi: 10.1002/pca.1358. [DOI] [PubMed] [Google Scholar]
- 28.Chen Y., Zhu S.B., Xie M.Y., Nie S.P., Liu W., Li C., Gong X.F., Wang Y.X. Quality control and original discrimination of Ganoderma lucidum based on high-performance liquid chromatographic fingerprints and combined chemometrics methods. Anal. Chim. Acta. 2008;623:146–156. doi: 10.1016/j.aca.2008.06.018. [DOI] [PubMed] [Google Scholar]
- 29.Zhou X.D., Tang L.Y., Wu H.W., Zhou G.H., Wang T., Kou Z.Z., Li S.W., Wang Z.J. Chemometric analyses for the characterization of raw and processed seeds of Descurainia sophia (L.) based on HPLC fingerprints. J. Pharm. Biomed. Anal. 2015;111:1–6. doi: 10.1016/j.jpba.2015.03.010. [DOI] [PubMed] [Google Scholar]
- 30.Wu L.F., Wang K.F., Mao X., Liang W.Y., Chen W.J., Li S., Qi Q., Cui Y.P., Zhang L.Z. Screening and analysis of the potential bioactive components of Poria cocos (Schw.) wolf by HPLC and HPLC-MS(n) with the aid of chemometrics. Molecules. 2016;21:227. doi: 10.3390/molecules21020227. [DOI] [PMC free article] [PubMed] [Google Scholar]
- 31.Chen T.L., Bi C.Q., Xiao X., Ma X.P., Ge F.H. Fingerprint and simultaneous determination of multi-components in water-soluble components of Salvia miltiorrhiza in miao autonomous county of Songtao, Guizhou. Zhong Yao Cai. 2015;38:536–539. [PubMed] [Google Scholar]
- 32.Liu A.H., Lin Y.H., Yang M., Guo H., Guan S.H., Sun J.H., Guo D.A. Development of the fingerprints for the quality of the roots of Salvia miltiorrhiza and its related preparations by HPLC-DAD and LC-MS(n) J. Chromatogr. B. 2007;846:32–41. doi: 10.1016/j.jchromb.2006.08.002. [DOI] [PubMed] [Google Scholar]
- 33.Zhang L.L., Liu Y.Y., Liu Z.L., Wang C., Song Z.Q., Liu Y., Dong Y.Z., Ning Z.C., Lu A.P. Comparison of the roots of Salvia miltiorrhiza Bunge (Danshen) and its variety S. miltiorrhiza Bge f. Alba (Baihua Danshen) based on multi-wavelength HPLC-fingerprinting and contents of nine active components. Anal. Methods. 2016;8:3171–3182. doi: 10.1039/C6AY00185H. [DOI] [Google Scholar]
- 34.Luo H.L., Kong W.J., Hu Y.C., Chen P., Wu X.R., Wan L., Yang M.H. Quality evaluation of Salvia miltiorrhiza Bge. by ultra high performance liquid chromatography with photodiode array detection and chemical fingerprinting coupled with chemometric analysis. J. Sep. Sci. 2015;38:1544–1551. doi: 10.1002/jssc.201401430. [DOI] [PubMed] [Google Scholar]
- 35.Liu M., Li Y.G., Zhang F., Chou G.X., Cheng X.M., Zhang M., Wang Z.T. Extraction and ultra-performance liquid chromatography of hydrophilic and lipophilic bioactive components in a Chinese herb Radix Salviae Miltiorrhizae. J. Chromatogr. A. 2007;1157:51–55. doi: 10.1016/j.chroma.2007.05.018. [DOI] [PubMed] [Google Scholar]
- 36.Ruan M., Li Y., Li X., Luo J.G., Kong L.Y. Qualitative and quantitative analysis of the major constituents in Chinese medicinal preparation Guan-Xin-Ning injection by HPLC–DAD–ESI-MSn. J. Pharm. Biomed. Anal. 2012;59:184–189. doi: 10.1016/j.jpba.2011.10.007. [DOI] [PubMed] [Google Scholar]
- 37.Hu P., Liang Q.L., Luo D.A., Zhao Z.Z., Jiang Z.H. Multi-component HPLC fingerprinting of Radix Salviae Miltiorrhiza and its LC-MS-MS identification. Chem. Pharm. Bull. 2005;53:677–683. doi: 10.1248/cpb.53.677. [DOI] [PubMed] [Google Scholar]
- 38.Liu A.H., Guo H., Ye M., Lin Y.H., Sun J.H., Xu M., Guo D.A. Detection, characterization and identification of phenolic acids in Danshen using high-performance liquid chromatography with diode array detection and electrospray ionization mass spectrometry. J. Chromatogr. A. 2007;1161:170–182. doi: 10.1016/j.chroma.2007.05.081. [DOI] [PubMed] [Google Scholar]
- 39.Liu M., Li Y.G., Zhang F., Yang L., Chou G.X., Wang Z.T., Hu Z.B. Chromatographic fingerprinting analysis of Danshen root (Salvia miltiorrhiza Radix et Rhizoma) and its preparations using high performance liquid chromatography with diode array detection and electrospray mass spectrometry (HPLC-DAD-ESI/MS) J. Sep. Sci. 2007;30:2256–2267. doi: 10.1002/jssc.200700149. [DOI] [PubMed] [Google Scholar]
- 40.Ma Z.J., Zhang M., Song Z.H. Characterization of tanshinones with quinone reductase induction activity from Radix Salvia miltiorrhiza by liquid chromatography/tandem mass spectrometry. Rapid Commun. Mass Spectrom. 2009;23:2857–2866. doi: 10.1002/rcm.4195. [DOI] [PubMed] [Google Scholar]
- 41.Sun J.H., Yang M., Wang X.M., Xu M., Liu A.H., Guo D.A. Identification of tanshinones and their metabolites in rat bile after oral administration of TTE-50, a standardized extract of Salvia miltiorrhiza by HPLC-ESI-DAD-MSn. J. Pharm. Biomed. Anal. 2007;44:564–574. doi: 10.1016/j.jpba.2006.11.003. [DOI] [PubMed] [Google Scholar]
- 42.Zhu Z.Y., Zhang H., Zhao L., Dong X., Li X., Chai Y.F., Zhang G.Q. Rapid separation and identification of phenolic and diterpenoid constituents from Radix Salvia miltiorrhizae by high-performance liquid chromatography diode-array detection, electrospray ionization time-of-flight mass spectrometry and electrospray ionization quadrupole ion trap mass spectrometry. Rapid Commun. Mass Spectrom. 2007;21:1855–1865. doi: 10.1002/rcm.3023. [DOI] [PubMed] [Google Scholar]
- 43.Chen H., Zhang Q., Wang X.M., Yang J., Wang Q. Qualitative analysis and simultaneous quantification of phenolic compounds in the aerial parts of Salvia miltiorrhiza by HPLC-DAD and ESI/MS(n) Phytochem. Anal. 2011;22:247–257. doi: 10.1002/pca.1272. [DOI] [PubMed] [Google Scholar]
- 44.Zhao X., Yang D.H., Xu F., Huang S., Zhang L., Liu G.X., Cai S.Q. The in vivo absorbed constituents and metabolites of Danshen decoction in rats identified by HPLC with electrospray ionization tandem ion trap and time-of-flight mass spectrometry. Biomed. Chromatogr. 2015;29:285–304. doi: 10.1002/bmc.3275. [DOI] [PubMed] [Google Scholar]
- 45.Zhang D.L., Duan X.J., Deng S.H., Nie L., Zang H.C. Fingerprint analysis, multi-component quantitation, and antioxidant activity for the quality evaluation of Salvia miltiorrhiza var. alba by high-performance liquid chromatography and chemometrics. J. Sep. Sci. 2015;38:3337–3344. doi: 10.1002/jssc.201500451. [DOI] [PubMed] [Google Scholar]
- 46.Liu X.J., Hu J., Li Z.Y., Qin X.M., Zhang L.Z., Guo X.Q. Species classification and quality assessment of Chaihu (Radix Bupleuri) based on high-performance liquid chromatographic fingerprint and combined chemometrics methods. Arch. Pharm. Res. 2011;34:961–969. doi: 10.1007/s12272-011-0613-2. [DOI] [PubMed] [Google Scholar]
- 47.Liu Q.T., Kong D.D., Luo J.Y., Kong W.J., Guo W.Y., Yang M.H. Quantitative and fingerprinting analysis of Atractylodes rhizome based on gas chromatography with flame ionization detection combined with chemometrics. J. Sep. Sci. 2016;39:2517–2526. doi: 10.1002/jssc.201501275. [DOI] [PubMed] [Google Scholar]


