Abstract
Enhancing future global food security by increasing cereal Green Revolution Variety (GRV) productivity risks escalating collateral environmental damage from inorganic nitrogen (N) fertilizers. Whilst crop N use-efficiency (NUE) improvements are therefore essential, they require in-depth understanding of unknown co-regulatory mechanisms integrating growth, N assimilation and carbon (C) fixation. Here we show that the balanced opposing activities and physical interactions of the rice GROWTH-REGULATING FACTOR 4 (OsGRF4) transcription factor and the DELLA growth-inhibitor confer homeostatic co-regulation of growth, C and N metabolism. OsGRF4 promotes and integrates N assimilation, C fixation and growth, whilst DELLA inhibits them. In consequence, the DELLA accumulation characteristic of GRVs confers yield-enhancing dwarfism, but also reduces NUE. However, GRV NUE and grain yield are increased by tipping the OsGRF4-DELLA balance towards increased OsGRF4 abundance. Modulation of plant growth and metabolic co-regulation thus enables novel breeding strategies for future sustainable food security and a new Green Revolution.
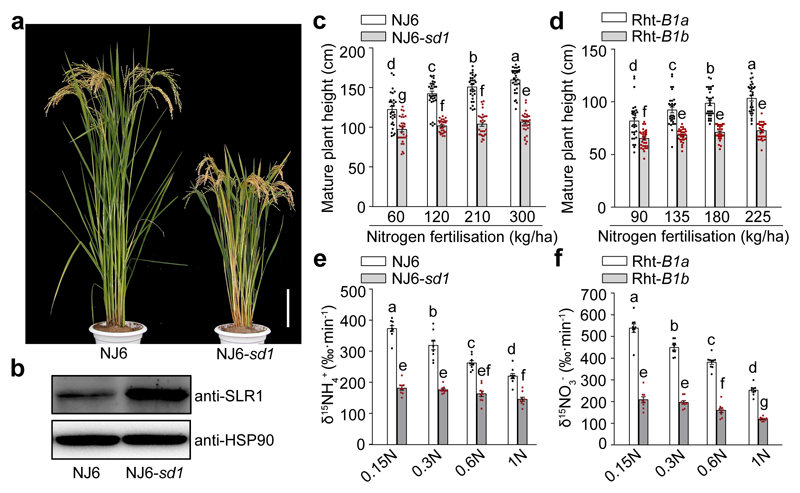
The 1960’s green revolution boosted crop yields, was partly driven by widespread adoption of semi-dwarf GRVs1–4. GRV semi-dwarfism is due to the accumulation of growth-repressing DELLA proteins (DELLAs) conferred by mutant alleles at the Rht (wheat)5,6 and SD1 (rice)7,8 loci. In normal plants, gibberellin (GA) promotes growth by stimulating the destruction of DELLAs9,10. Whilst mutant wheat GRV DELLAs5 are resistant to GA-stimulated destruction, the rice GRV mutant sd1 allele reduces bioactive GA abundance11,12, thus increasing accumulation of the DELLA protein SLR1 (Fig. 1a, b). The resultant conferred semi-dwarfism causes GRV resistance to yield-reducing ‘lodging’ (flattening of plants by wind and rain)4.
Figure 1. DELLA accumulation inhibits growth, N-response and N-uptake of rice and wheat GRVs.
a, Indica rice variety Nanjing6 (NJ6) and near- isogenic NJ6-sd1 plants. Scale bar, 15 cm. b, Accumulation of SLR1. Heat shock protein 90 (HSP90) serves as loading control. The pictures of western blots represent one of the three experiments performed independently with similar results. c, d, Heights of (c) rice and (d) wheat plants. Data shown as mean ± s.e.m. (n = 30). e, 15NH4+ uptake rates in varying N supply (0.15N, 0.1875 mM NH4NO3; 0.3N, 0.375 mM NH4NO3; 0.6N, 0.75 mM NH4NO3; 1N, 1.25 mM NH4NO3). f, 15NO3- uptake rates in varying N supply (0.15N, 0.1875 mM Ca(NO3)2; 0.3N, 0.375 mM Ca(NO3)2; 0.6N, 0.75 mM Ca(NO3)2; 1N, 1.25 mM Ca(NO3)2). Data (e, f) shown as mean ± s.e.m. (n = 9). Different letters denote significant differences (P < 0.05; panels c-f; Duncan's multiple range test).
GRV lodging resistance is enhanced by relative insensitivity to N. For example, the N-induced increase in NJ6 plant height is reduced in NJ6-sd1 (Fig. 1c), and the Rht-B1b GRV allele confers similar properties on wheat (Fig. 1d). Whilst DELLA accumulation inhibits GRV growth N-response, N-allocation to grain continues, thus combining enhanced harvestable yield with reduced lodging risk from increased N-supply1,4,5,7,8. These properties drove the rapid spread of GRV cultivation over the past 50 years3, and also ensured retention of semi-dwarfing alleles in current elite varieties5,6,12. However, GRVs is associated with reduced N use-efficiency (NUE)13. Accordingly, mutant sd1 and Rht alleles inhibit N uptake. For example, NH4+ is the majority N source for anaerobic paddy-field rice roots14. Whilst NJ6 15NH4+ uptake is itself N-regulated (rate reduced by increasing N supply), sd1 reduces the underlying NJ6-sd1 uptake rate, and also interferes with its N-responsive regulation (Fig. 1e). Similarly, with nitrate (NO3-) being the majority N source in aerobic soils15, mutant Rht-B1b allele affects both underlying and N-regulated wheat 15NO3- uptake (Fig. 1f). Thus, DELLA accumulation confers combined semi-dwarfism, reduced growth N-response, and reduced N uptake on GRVs. In consequence, achievement of high GRV yield requires environmentally damaging N fertiliser inputs16. Development of new GRVs that remain high-yield with reduced N supply is thus an urgent global sustainable agriculture goal2,17. We therefore analysed GRV growth-metabolism integration, reasoning that our discoveries might in turn enable development of new GRVs having improved NUE.
OsGRF4 promotes rice GRV NH4+ uptake
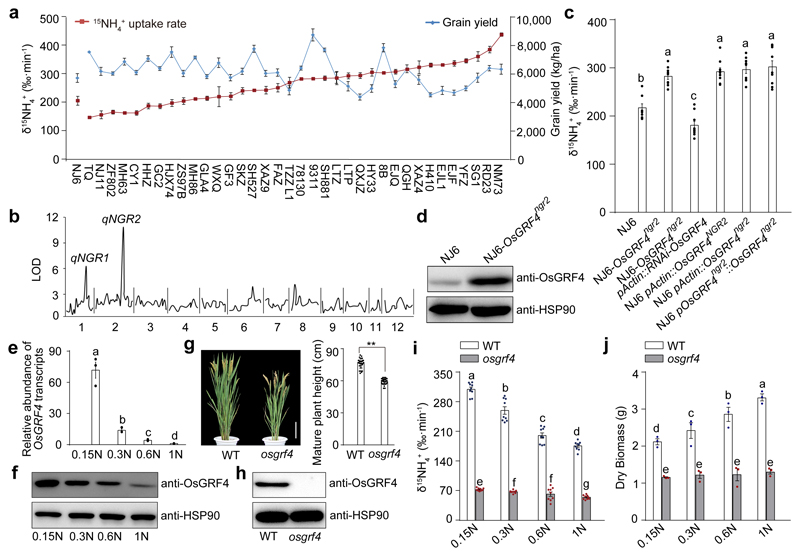
We found ~3-fold variation in the 15NH4+ uptake rates of 36 sd1-containing indica rice varieties and SD1-containing NJ6 control (Fig. 2a), then crossed NM73 (having the highest rate; Fig. 2a) with NJ6 (recurrent parent) to generate a BC1F2 population. Quantitative trait locus (QTL) analysis of 15NH4+ uptake rates revealed two LOD-score peaks (qNGR1 and qNGR2, Fig. 2b; Supplementary Information Table 1). Whilst the NM73 qngr1 allele coincides in map position with sd17,8, the molecular identity of the NM73 qngr2 allele, associated with increased 15NH4+ uptake rates, was unknown. Positional mapping next located qngr2 to OsGRF418–20 (Extended Data Fig. 1a), suggesting a previously unknown function in NH4+ uptake regulation. Because a NM73 (OsGRF4ngr2) allele heterozygote has a higher rate than a NJ6 (OsGRF4NGR2) allele homozygote (Extended Data Fig. 1b), OsGRF4ngr2 semi-dominantly increases NH4+ uptakes. An NJ6-OsGRF4ngr2 isogenic line accordingly exhibited increased NH4+ uptake rates (versus NJ6; Fig. 2c), and increased OsGRF4 mRNA and OsGRF4 protein abundances (Fig. 2d; Extended Data Fig 1c). Furthermore, anti-OsGRF4 RNAi reduced the high 15NH4+ uptake rate of NJ6-OsGRF4ngr2, whereas transgenic expression of OsGRF4ngr2 mRNA from its native promoter increased 15NH4+ uptake (Fig. 2c; Extended Data Fig 1c). Overexpression of either OsGRF4NGR2 or OsGRF4ngr2 mRNA from the constitutive rice Actin1 promoter conferred increased 15NH4+ uptake rates on NJ6 (Fig. 2c; Extended Data Fig. 1c). Thus, OsGRF4ngr2 is equivalent to qngr2, confers an increased 15NH4+ uptake rate on NM73, and counteracts the repressive effects of sd1-mediated SLR1 accumulation.
Figure 2. OsGRF4 regulates rice NH4+ uptake and growth response to N availability.
a, Variation in 15NH4+ uptake and grain yield. 4-week-old rice plants (15NH4+ uptake assays) were grown hydroponically with high N supply (1.25 mM NH4NO3). Data shown as mean ± s.e.m. (n = 6). Field-grown rice plants (yield assays) were grown with urea supply (210 kg/ha). Data shown as mean ± s.e.m. of six plots (each plot contained 220 plants) per line. b, QTL analysis. c, 15NH4+ uptake rate. d, Accumulation of OsGRF4. e, OsGRF4 transcript abundance in NJ6 roots grown in increasing N supply (0.15N, 0.1875 mM NH4NO3; 0.3N, 0.375 mM NH4NO3; 0.6N, 0.75 mM NH4NO3; 1N, 1.25 mM NH4NO3). Transcription relative to that of 1N (set to one). f, Accumulation of OsGRF4 in NJ6. g, Mature plant height of the rice osgrf4 mutant (Extended Data Fig. 1a). Scale bar, 15 cm. Data shown as mean ± s.e.m. (n = 20). ** P < 0.05 as compared to WT group by two-sided Student’s t-test. h, Accumulation of OsGRF4. HSP90 serves as loading control (panels d, f and h). i, 15NH4+ uptake rate. Data (c, i) shown as mean ± s.e.m. (n = 9). j, Dry weight of 4-week-old plants. Data (e, j) shown as mean ± s.e.m. (n = 3). Different letters denote significant differences (P < 0.05; panels c, i and j; Duncan's multiple range test). The pictures represent one of the three experiments performed independently with similar results (panels b, d, f and h).
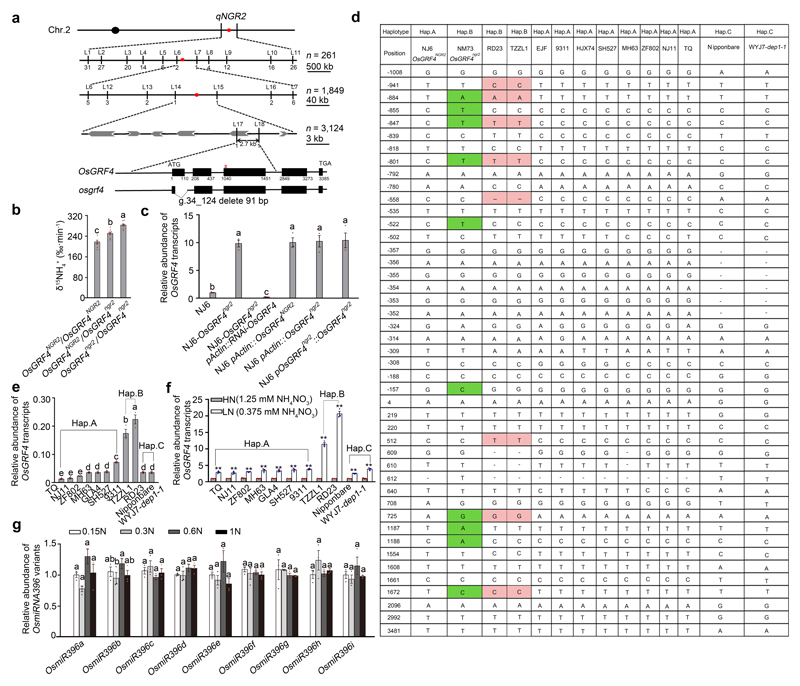
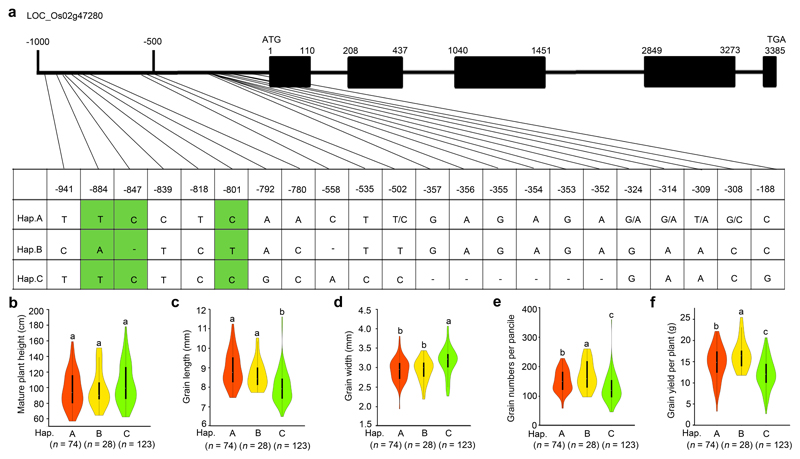
OsGRF4NGR2 (NJ6) and OsGRF4ngr2 (NM73) allelic comparisons revealed multiple SNPs (single nucleotide polymorphisms; Extended Data Fig. 1a, d), two of which (g.1187T>A and g.1188C>A in exon 3) prevent OsmiR396-mediated cleavage of OsGRF4ngr2 mRNA18–20, thus increasing OsGRF4 mRNA and OsGRF4 abundance (Fig. 2d; Extended Data Fig. 1c) and promoting NH4+ uptake. Nevertheless, variety RD23 (although lacking 1187A and 1188A) also displays a high 15NH4+ uptake rate (Fig. 2a; Extended Data Fig. 1d), and shares three OsGRF4 promoter SNPs (g.-884T>A, g.-847C>T and g.-801C>T; Extended Data Fig. 1a, d) with NM73. In all, we detected three OsGRF4 promoter haplotypes (A, as in 9311 and other indica varieties; B, with -884A, -847T and -801T, as in NM73 and RD23; and C, common in japonica germplasm; Extended Data Fig. 1d). Interestingly, OsGRF4 mRNA abundance is higher in haplotype B-containing varieties TZZL1 and RD23 (Extended Data Fig. 1d) than in elite varieties carrying haplotypes A or C (Extended Data Fig. 1e, f), presumably thus conferring their relatively high 15NH4+ uptake rates (Fig. 2a). Thus, NM73 has the highest of all assayed 15NH4+ uptake rates because it combines the effects of promoter haplotype B with the OsmiR396-resistance conferred by 1187A and 1188A18–20.
Importantly, we also found that in addition to regulating NH4+ uptake, OsGRF4 is regulated by N supply. NJ6 OsGRF4 mRNA abundance decreases with increasing N (Fig. 2e), likely due to decreased OsGRF4 transcription (OsmiR396 abundance is not detectably increased with increasing N; Extended Data Fig. 1g), thus reducing OsGRF4 abundance (Fig. 2f). Because increased OsGRF4 abundance increases 15NH4+ uptake (Fig. 2c, d), our observations suggest that promotion of OsGRF4 abundance by low N enables feedback regulation of N homeostasis. In particular, the increased OsGRF4 mRNA abundance response to low N is significantly amplified in varieties carrying haplotype B (e.g., TZZL1 and RD23; Extended Data Fig. 1f). Finally, a CRISPR/cas921-generated semi-dwarf osgrf4 mutant (Fig. 2g) lacks OsGRF4 (Fig. 2h; Extended Data Fig. 1a), and exhibits reduced 15NH4+ influx (Fig. 2i), reduced N-responsive regulation of 15NH4+ uptake (Fig. 2i) and reduced N-dependent biomass accumulation (Fig. 2j). Thus, OsGRF4 is an N-responsive transcriptional regulator promoting both NH4+ uptake and growth in response to N-supply, and counteracting the inhibitory effects of SLR1.
OsGRF4-SLR1 regulation of N metabolism
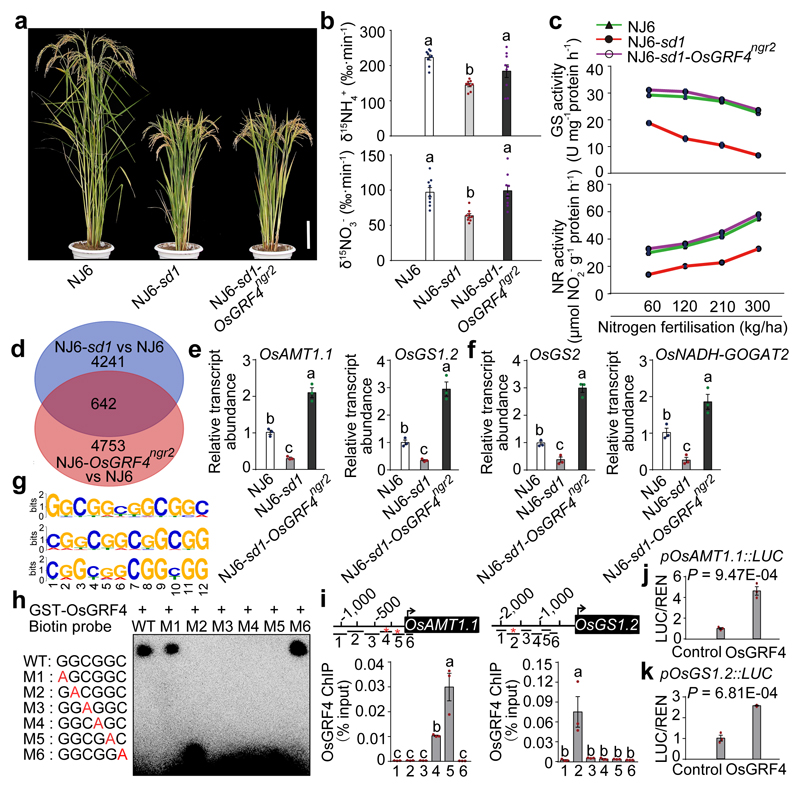
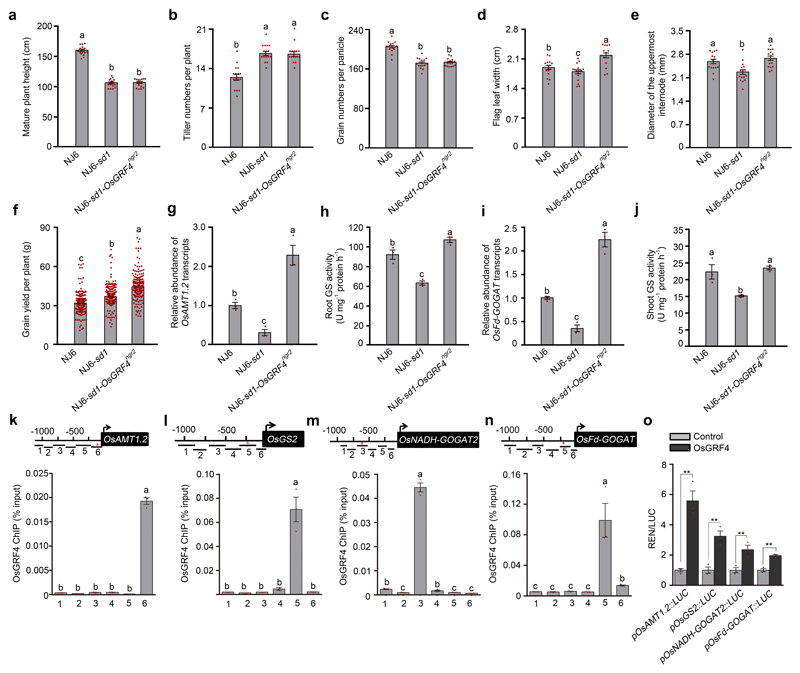
We next determined how OsGRF4 and SLR1 counteract one another to regulate NH4+ assimilation. Whilst a NJ6-sd1-OsGRF4ngr2 isogenic line retains the semi-dwarfism, tiller numbers per plant and grain numbers per panicle conferred by sd1 (Fig. 3a; Extended Data Fig. 2a-c), leaf and culm width and grain yield are increased (Extended Data Fig. 2d-f). In addition, the 15NH4+ uptake rate in NJ6-sd1-OsGRF4ngr2 is greater than in NJ6-sd1 (and similar to that of NJ6), with 15NO3- uptake being similarly affected (Fig. 3b). Furthermore, the activities of key N assimilation enzymes, such as glutamine synthase (GS; NH4+ assimilation)22 and nitrate reductase (NR; NO3- assimilation)23 are, at varying N-supply levels, consistently greater in NJ6-sd1-OsGRF4ngr2 than in NJ6-sd1, and similar to that of NJ6 (Fig. 3c). Thus, OsGRF4 promotes both N uptake and N assimilation, whilst SLR1 inhibits them.
Figure 3. OsGRF4 regulates expression of multiple N metabolism genes.
a, Mature plants. Scale bar, 15 cm. b, 15NH4+ and 15NO3- uptake rates. Data shown as mean ± s.e.m. (n = 9). c, Glutamine synthase (GS) and nitrate reductase (NR) activities in shoots of rice plants grown in paddy-field conditions with increasing urea supply. d, RNA-seq analysis. 4883 genes had transcript abundances down-regulated in NJ6-sd1 (versus NJ6; blue), 5395 genes had transcript abundances up-regulated in NJ6-OsGRF4ngr2 (versus NJ6; orange), with 642 genes common to both. e, f, Root (e) and shoot (f) mRNA abundances relative to NJ6 (set to one). g, Sequence motifs enriched in ChIP-seq with Flag-tagged OsGRF4. h, EMSA assays. The pictures (a, h) represent one of the three experiments performed independently with similar results. i, Flag-OsGRF4 mediated ChIP-PCR enrichment (relative to input) of GCGG-containing promoter fragments (marked with *) from OsAMT1.1 and OsGS1.2. Different letters denote significant differences (P < 0.05; panels b, e, f and i; Duncan's multiple range test). j, k, Transactivation assays. Data (c, e-f, i and j-k) shown as mean ± s.e.m. (n = 3). A two-sided Student’s t-test was used to generate the P values.
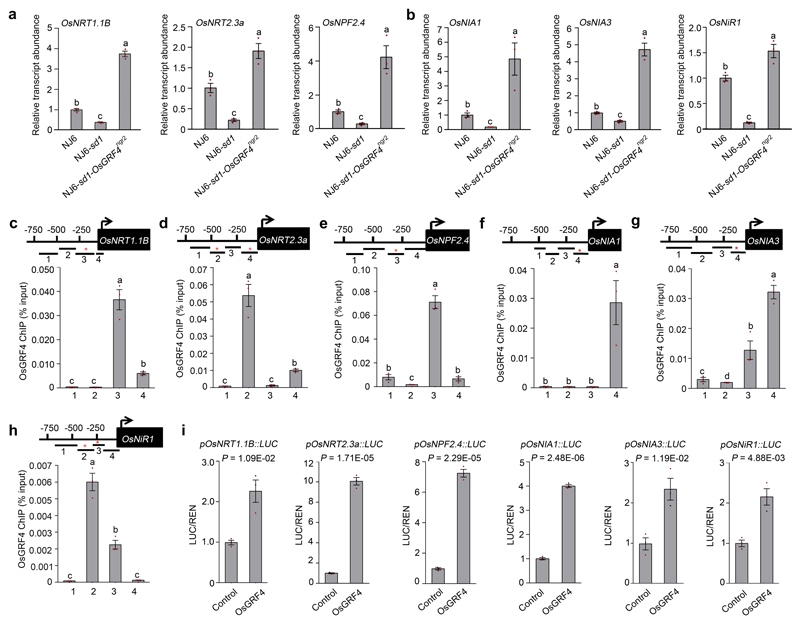
Transcriptome-wide RNA-sequencing analysis identified 642 genes having transcript abundances upregulated (by OsGRF4) in NJ6-OsGRF4ngr2 and down-regulated (by SLR1) in NJ6-sd1 (versus NJ6) (Fig. 3d; Supplementary Information Tables 2 and 3). Amongst these, qRT-PCR confirmed root abundances of mRNAs encoding NH4+ uptake transporters (e.g., OsAMT1.1 and OsAMT1.2)24 to be elevated in NJ6-sd1-OsGRF4ngr2, but reduced in NJ6-sd1 (Fig. 3e; Extended Data Fig. 2g). Similarly, abundances of mRNAs encoding NH4+ assimilation enzymes (e.g., OsGS1.223, OsGS2 and OsNADH-GOGAT2) and corresponding enzymatic activities were relatively enhanced in NJ6-sd1-OsGRF4ngr2 (Fig. 3c, e, f; Extended Data Fig. 2h-j). Next, DNA sequencing of OsGRF4 chromatin-immunoprecipitation products (ChIP-seq) revealed potential OsGRF4 target-recognition sites, with a predominant GGCGGC motif being common to multiple N metabolism gene promoters (Fig. 3g; Supplementary Information Table 4). Electrophoretic mobility shift assays (EMSA) demonstrated binding of GST-OsGRF4 to DNA fragments containing intact but not mutant GCGG core motifs (Fig. 3h), and ChIP-PCR confirmed in vivo association of OsGRF4 with GCGG-containing promoter fragments from multiple NH4+ metabolism genes, including OsAMT1.1 and OsGS1.2 (Fig. 3i; Extended Data Fig. 2k-n). Finally, OsGRF4 activates transcription from OsAMT1.1 and OsGS1.2 promoters in transactivation assays (Fig. 3j, k; Extended Data Fig. 2o). Further experiments demonstrated that OsGRF4-mediated transcriptional activation also promotes NO3- metabolism (Fig. 3b, c; Extended Data Fig. 3). Thus, OsGRF4 is an overall transcriptional activator of N metabolism, and counteracts the inhibitory effects of SLR1.
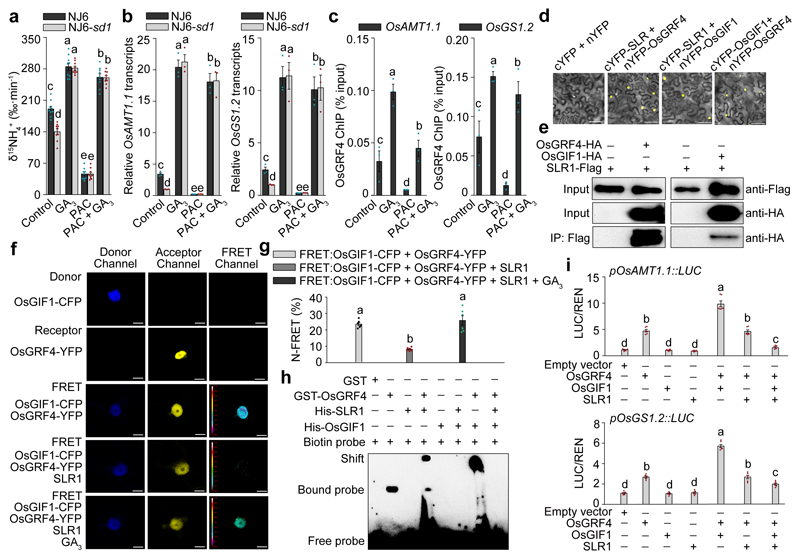
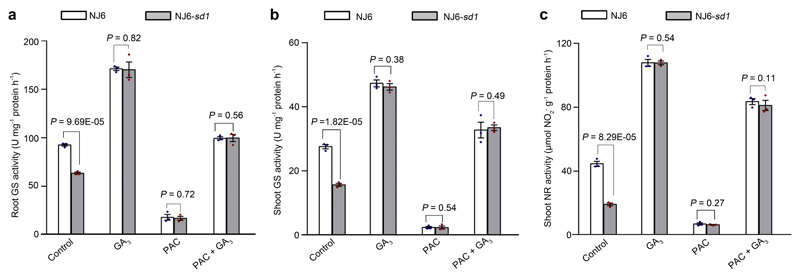
We next investigated how GA, SLR1, and OsGRF4 regulate N metabolism. GA promotes both NJ6 and NJ6-sd1 15NH4+ uptake rates to similarly high levels (Fig. 4a). Also, the GA-biosynthesis inhibitor pacolubutrazol25 (PAC) reduces NJ6 and NJ6-sd1 15NH4+ uptakes, whilst GA restores it (Fig. 4a). Thus, SLR1 accumulation (due to sd1 or PAC) reduces NH4+ uptake, whilst SLR1 reduction (due to GA) increases it. Furthermore, the GA-DELLA system differentially regulates the abundance of NH4+ metabolism mRNAs: OsAMT1.1 and OsGS1.2 mRNA abundances are increased by GA, reduced by PAC, and restored by combined GA and PAC (Fig. 4b). We next found that PAC reduces, whilst GA promotes ChIP-PCR enrichment of GCGG motif-containing fragments from the OsAMT1.1 and OsGS1.2 promoters (Fig. 4c). Thus, SLR1 accumulation inhibits, whilst SLR1 reduction promotes binding of OsGRF4 to OsAMT1.1 and OsGS1.2 promoters (Fig. 4c), thereby affecting mRNA abundance and NH4+ metabolism (Fig. 4a, b; Extended Data Fig. 4a, b). SLR1 abundance also likely affects NO3- uptake (Fig. 3b; Extended Data Fig. 3a, b) and NR activity (Fig. 3c; Extended Data Fig. 4c) via inhibition of OsGRF4 activation of NO3- metabolism genes.
Figure 4. Competitive OsGRF4-OsGIF1-SLR1 interactions coordinate NH4+ uptake and assimilation.
a, 15NH4+ uptake rates in 4-week-old plants treated with 100 μM GA3 and/or 2 μM paclobutrazol (PAC). Data shown as mean ± s.e.m. (n = 9). b, Root mRNA abundance relative to the level in NJ6-sd1 plants (set to one). c, Extent of ChIP-PCR OsGRF4-mediated enrichment (relative to input) of GCGG-containing promoter fragments from OsAMT1.1 (fragment 5) and OsGS1.2 (fragment 2) (shown in Fig. 3i). Data (b, c) shown as mean ± s.e.m. (n = 3). d, BiFC assays. Scale bar, 60 μm. e, Co-IP experiments. f, FRET images. Scale bar, 200 μm. g, Mean N-FRET data for OsGIF1-CFP and OsGRF4-YFP channels. h, EMSA assays. The pictures represent one of the three experiments performed independently with similar results (d-f, h). i, Transactivation assays. The LUC/REN activity obtained from co-transfection with an empty effector construct and indicated reporter constructs was set to one. Data (g, h) shown as mean ± s.e.m. (n = 6). Different letters denote significant differences (P < 0.05; panels a-c, g and i; Duncan's multiple range test).
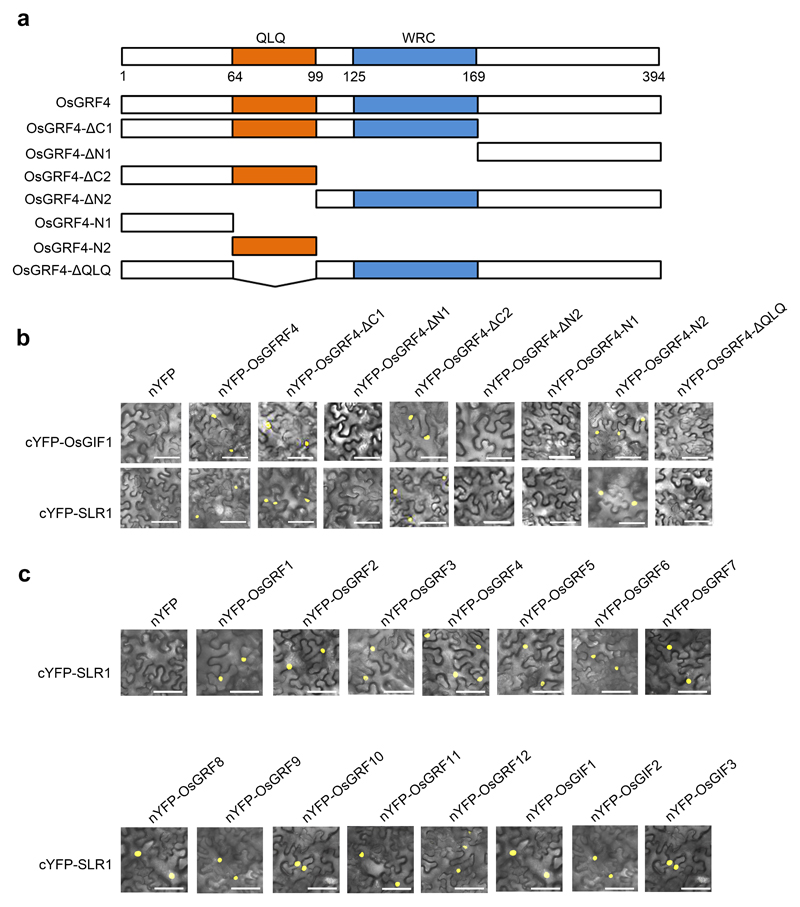
Whilst interaction of OsGRF4 with OsGIF (GRF-interacting factor) co-activators via a conserved QLQ domain (Extended Data Fig. 5a, b) promotes target gene expression18, bimolecular fluorescence complementation (BiFC) and co-immunoprecipitation (Co-IP) assays revealed that SLR1 interferes with this interaction (Fig. 4d, e; Extended Data Fig. 5c). In vivo fluorescence resonance energy transfer (FRET) assays demonstrated that SLR1 competitively inhibits the OsGRF4-OsGIF1 interaction, and that GA relieves this inhibition (Fig. 4f, g). Whilst the OsGRF4-OsGIF1 interaction promotes binding of OsGRF4 to GCGG motif-containing DNA fragments, SLR1 inhibits this promotion by inhibiting the OsGRF4-OsGIF1 interaction (but does not directly interfere with the DNA-binding of OsGRF4; Fig. 4h). Accordingly, SLR1 inhibits OsGRF4-OsGIF1-mediated transactivation from OsAMT1.1 and OsGS1.2 promoters (Fig. 4i).
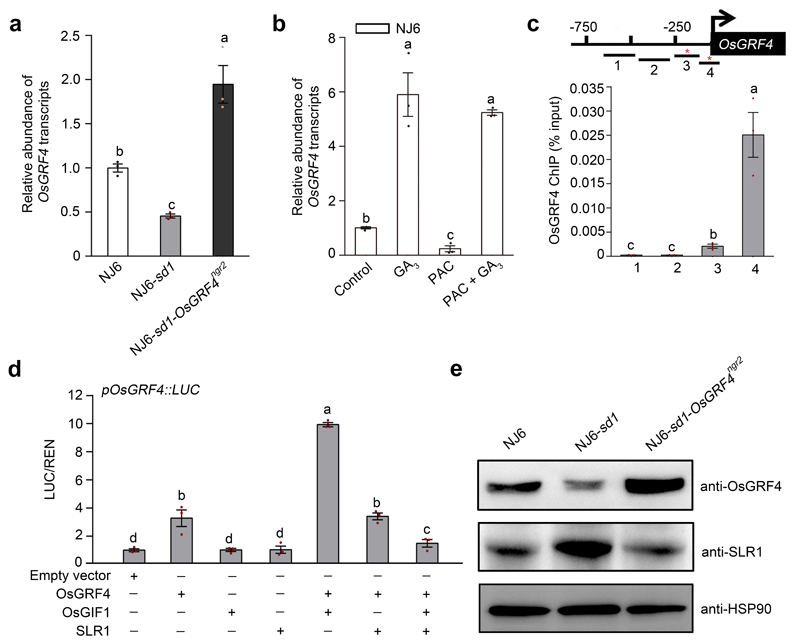
Importantly, OsGRF4 abundance is self-promoted, and SLR1 inhibits that promotion. Whilst OsGRF4 mRNA abundance is reduced in NJ6-sd1 (versus NJ6) but increased in NJ6-sd1-OsGRF4ngr2 (versus NJ6-sd1; Extended Data Fig. 6a), GA increases OsGRF4 mRNA abundance, and overcomes PAC-mediated reductions in OsGRF4 mRNA abundance (Extended Data Fig. 6b). Furthermore, OsGRF4 binds in vivo with GCGG-containing OsGRF4 promoter fragments (Extended Data Fig. 6c), and SLR1 inhibits OsGRF4-OsGIF1-mediated transcriptional activation of the OsGRF4 promoter (Extended Data Fig. 6d). In consequence, SLR1 reduces OsGRF4 abundance by interfering with the OsGRF4-OsGIF1 interaction, whilst the OsGRF4ngr2 allele restores OsGRF4 abundance (Extended Data Fig. 6e; NJ6-sd1 compared with NJ6-sd1-OsGRF4ngr2). Thus, interference of SLR1 with the OsGRF4-OsGIF1 interaction counteracts the promotive effects of OsGRF4 on N metabolism in two ways. First, SLR1 reduces OsGRF4 accumulation. Second, SLR1 reduces OsGRF4-OsGIF1 activation of N metabolism gene transcription.
OsGRF4-SLR1 links C fixation with growth
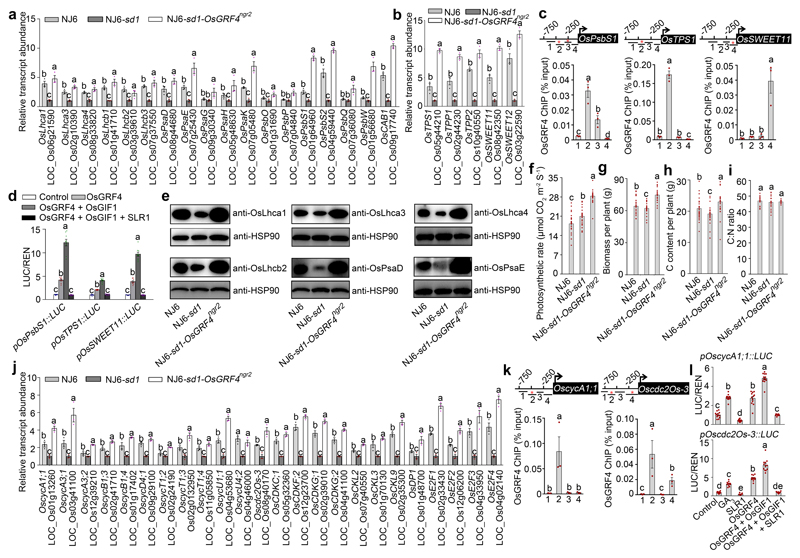
Whilst N metabolism is known to be coupled with the rate of photosynthetic carbon (C) fixation26, the molecular coupling mechanisms remain unknown. We next determined if the OsGRF4-SLR1 interaction also regulates C assimilation. Transcriptome comparisons of NJ6, NJ6-sd1 and NJ6-sd1-OsGRF4ngr2 (Fig. 3d; Supplementary Information Tables 2 and 3) indicated that OsGRF4 up-regulates, whilst SLR1 down-regulates, multiple genes encoding photosynthetic (e.g., OsLhca1 and OsCAB1), sucrose metabolism (e.g., OsTPS1 and OsTPP1) and sucrose transport (e.g., OsSWEET11 and OsSWEET12) regulatory components (Extended Data Fig. 7a, b). In addition, OsGRF4 binds in vivo to GCGG-containing promoter fragments from OsPsbS1, OsTPS1 and OsSWEET11 (Extended Data Fig. 7c), whilst SLR1 inhibits OsGRF4-OsGIF1 complex activation of transcription from pOsPsbS1, pOsTPS1 and pOsSWEET11 promoters (Extended Data Fig. 7d). For selected photosynthetic genes (OsLhca1, OsLhca3, OsLhca4, OsLhcb2, OsPsaD and OsPsaE), we confirmed that encoded protein abundances in NJ6, NJ6-sd1 and NJ6-sd1-OsGRF4ngr2 (Extended Data Fig. 7e) mirror that of respective encoding mRNAs (Extended Data Fig. 7a). Finally, we found that these effects on photosynthesis and C assimilation gene expression affect C metabolic function. First, in accord with previous reports that semi-dwarfed GRVs have increased photosynthetic rates27,28, we found the elevated photosynthetic rate of NJ6-sd1 (versus NJ6) to be still further elevated in NJ6-sd1-OsGRF4ngr2 (Extended Data Fig. 7f). Furthermore, sd1-conferred reductions in NJ6 biomass and C content are reversed and further elevated in NJ6-sd1-OsGRF4ngr2 (Extended Data Fig. 7g, h), but without effect on C:N ratio (Extended Data Fig. 7i). Thus, antagonistic OsGRF4-SLR1 interaction regulates and coordinates both N and C assimilation (hence maintaining C:N ratio).
We also found that OsGRF4 up-regulates, whilst SLR1 down-regulates, multiple genes promoting cell division, including those encoding cyclin dependent cdc2 protein kinases29,30 (e.g., OscycA1;1 and Oscdc20s-3; Extended Data Fig. 7j), consistent with the plant growth reduction in the osgrf4 mutant (Fig. 2g). In addition, OsGRF4 binds in vivo to GCGG-containing promoter fragments from OscycA1;1 and Oscdc20s-3 (Extended Data Fig. 7k), and GA promotes, whilst SLR1 inhibits OsGRF4-OsGIF1 complex activation of transcription from these same promoters (Extended Data Fig. 7l). We conclude that OsGRF4-SLR1 antagonism modulates the GA-mediated promotion of cell proliferation, and integrates growth, N, and C metabolism regulation.
OsGRF4 increases GRV NUE and grain yield
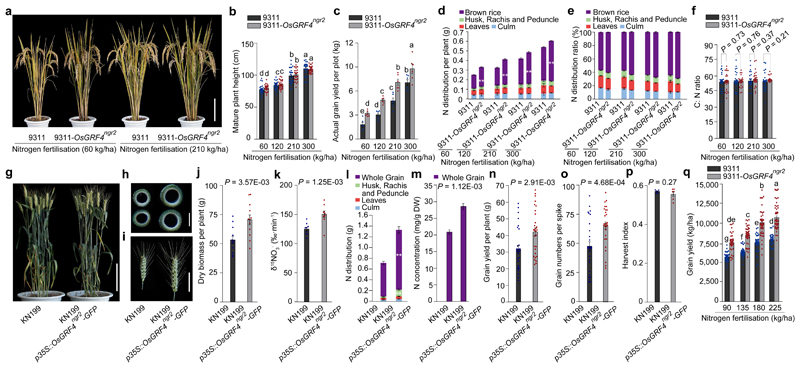
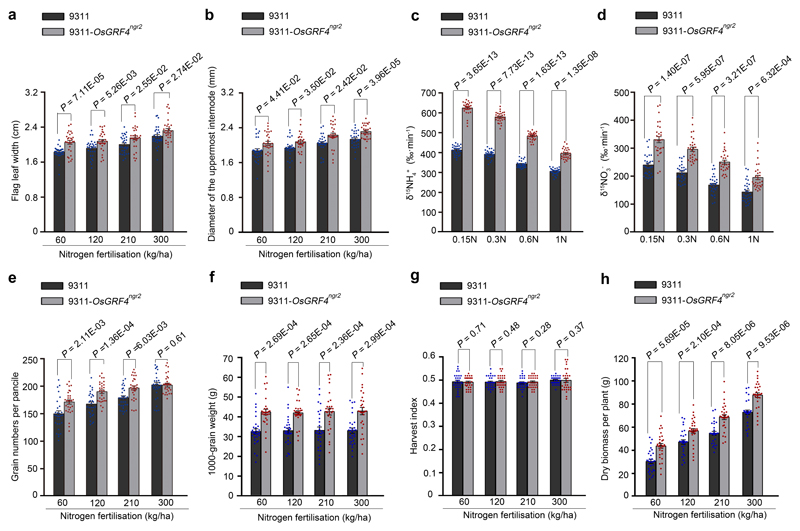
OsGRF4 promoter haplotype B (Extended Data Fig. 1d) exists in selected indica cultivars, but not in modern elite varieties. Nevertheless, amongst 225 accessions31, haplotype B is associated with relatively high yield potential (Extended Data Fig. 8). We next showed that increasing OsGRF4 abundance improves NUE and grain yield of the high-yielding sd1-containing indica variety 9311. As for NJ6-sd1-OsGRF4ngr2 (Fig. 3a), the 9311-OsGRF4ngr2 isogenic line is not detectably changed with respect to sd1-conferred semi-dwarf phenotype (Fig. 5a, b), but displays increased leaf and culm width (Extended Data Fig. 9a, b). However, the increased 15NH4+ and 15NO3- uptake conferred by OsGRF4ngr2 (Extended Data Fig. 9c, d) enhances 9311 grain yield and NUE. Grain yield per plot was increased in 9311-OsGRF4ngr2 (versus 9311) at both high and low N-supply levels (Fig. 5c), due to increases in both grain number and grain weight18–20 (Extended Data Fig. 9e, f). Harvest index was relatively unaffected (Extended Data Fig. 9g), presumably because biomass increases (Extended Data Fig. 9h) balance out increases in grain yield (Fig. 5c). Whilst total N in above-ground parts of 9311-OsGRF4ngr2 was greater than in 9311 (Fig. 5d), the distribution ratio of N allocated to grain (versus vegetative organs) was not significantly increased (Fig. 5e), and C/N ratio was not detectably affected (Fig. 5f). Thus, the increased OsGRF4 abundance conferred by OsGRF4ngr2 partially disconnects GA-regulation of stem elongation (plant height) from N metabolic regulation. OsGRF4-promoted biomass increases are reflected primarily in increased leaf and culm widths rather than height.
Figure 5. Elevated OsGRF4 abundance increases grain yield and NUE of rice and wheat GRVs without increasing mature plant height.
a, Appearance of mature plants. Scale bar, 15 cm. b, Plant height. c, Grain yield. Data shown as mean ± s.e.m. of six plots (each plot contained 220 plants) per line per N level. d, e, N distribution per plant (d) and ratio (%; e) of plants shown in b. ** P < 0.05, 9311-OsGRF4ngr2 compared with 9311 by two-sided Student’s t-test (panels d and e). f, C:N ratio of plants shown in b. Data (b, d-f) shown as mean ± s.e.m. (n = 30). g, Mature wheat plant morphology. Scale bar, 15 cm. h, Cross section of the uppermost internode of (left) KN199 and (right) KN199 p35S::OsGRF4ngr2-GFP wheat plants. Scale bar, 2 mm. i, Spike length. Scale bar, 5 cm. The pictures represent one of the three experiments performed independently with similar results (panels a, g-i). j, Biomass accumulation. Data shown as mean ± s.e.m. (n = 12). k, 15NO3- uptake rate. l, N distribution. Data (k, l) shown as mean ± s.e.m. (n = 9). ** P < 0.05, KN199 p35S::OsGRF4ngr2-GFP compared with KN199 by two-sided Student’s t-test. m, N concentrations. Data shown as mean ± s.e.m. (n = 20). n, Grain yield. o, Grain number. Data (n, o) shown as mean ± s.e.m. (n = 30). p, Harvest index. Data shown as mean ± s.e.m. (n = 6). A two-sided Student’s t-test was used to generate the P values (panels f, j-k and m-p). q, Overall grain yield. Data shown as mean ± s.e.m. (n = 60). Different letters denote significant differences (P < 0.05; panels b, c and q; Duncan's multiple range test).
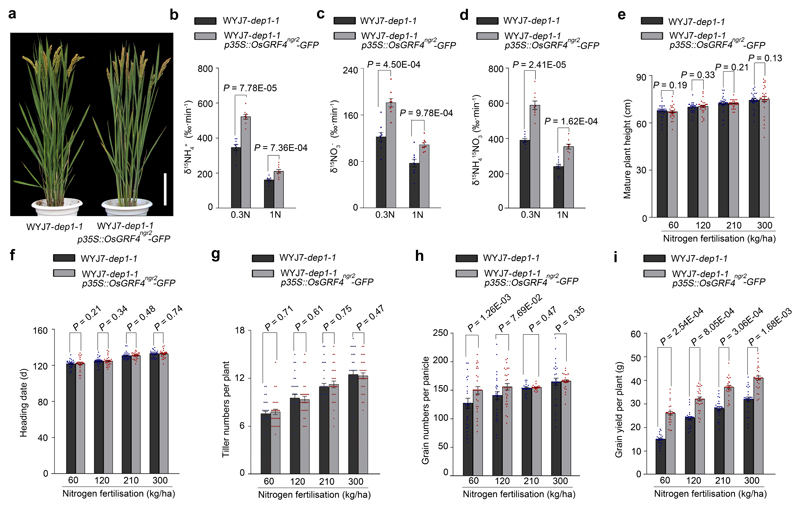
Chinese japonica rice GRV semi-dwarfism is conferred by a mutant variant (dep1-1) of Gγ subunit32 that reduces vegetative growth N-response and increases NUE22. We found that increasing OsGRF4 abundance (OsGRF4-GFP in transgenic WJY7-dep1-122 plants expressing p35S::OsGRF4ngr2-GFP) did not suppress dep1-1-conferred semi-dwarfism (Extended Data Fig. 10a), but did increase both 15NH4+ and 15NO3- uptake rates (Extended Data Fig. 10b-d). In addition, whilst plant height, heading date and tiller numbers per plant in response to different N supply rates were unaffected (Extended Data Fig. 10e-g), overexpression of OsGRF4ngr2-GFP increased both grain number (in low N; Extended Data Fig. 10h) and grain yield (Extended Data Fig. 10i) of WJY7-dep1-1. Nutrient assimilation and grain yield of rice GRVs can thus be increased by elevated OsGRF4 abundance, particularly at low N fertilization levels, without simultaneously causing yield-reducing plant height increases.
Finally, the semi-dwarfism of high-yielding Chinese wheat GRV KN199 is conferred by the mutant Rht-B1b allele5,6. As in rice, transgenic expression of p35S::OsGRF4ngr2-GFP did not increase KN199 plant height (Fig. 5g), but did increase culm diameter and wall thickness (Fig. 5h), spike length (Fig. 5i) and biomass accumulation (Fig. 5j). In addition, p35S::OsGRF4ngr2-GFP increased KN199 15NO3- uptake rate (Fig. 5k), total N in above-ground plant parts (Fig. 5l) and N concentration in de-husked grain (Fig. 5m). p35S::OsGRF4ngr2-GFP also boosted KN199 yield (Fig. 5n) by increasing grain numbers per spike (Fig. 5o), without affecting harvest index (Fig. 5p). Moreover, the improvement of grain yield conferred on KN199 by p35S::OsGRF4ngr2-GFP at low N supply shows that increased OsGRF4 abundance enhances both grain yield and NUE of wheat GRVs (Fig. 5q), without affecting the characteristic beneficial GRV semi-dwarfism. Indeed, the increased culm width and wall thickness conferred by p35S::OsGRF4ngr2-GFP (Fig. 5h) is likely to enhance the stem robustness conferred by mutant Rht alleles, thus further reducing lodging yield-loss. In conclusion, increased OsGRF4 abundance elevates grain yields of rice and wheat GRVs grown in moderate N-supply.
Discussion
We here report new advances in fundamental plant science and strategic plant breeding. First, the OsGRF4-DELLA interaction integrates plant growth and metabolic regulation. OsGRF4 is a transcriptional regulator of multiple N metabolism genes that, because it is itself N-regulated, likely confers homeostatic coordination of plant N metabolism. Importantly, N-regulated OsGRF4 also coordinates C metabolism and growth, and is thus likely to confer broader-range integrative homeostatic control. Although long thought to exist, the identities of such broad-range growth and metabolic integrators were previously unknown. Furthermore, OsGRF4 activity is balanced by an antagonistic regulatory relationship with the DELLA growth repressor. Essentially, physical DELLA-OsGRF4-OsGIF1 interactions enable DELLA to inhibit OsGRF4-OsGIF1 activation of target gene promoters, and the balance between opposing OsGRF4 and DELLA activities thus enhances coordinated regulation of plant growth and metabolism.
Second, increasing the abundance of OsGRF4 in GRVs tips the OsGRF4-DELLA balance to favour OsGRF4, conferring increases in C and N assimilation, biomass, leaf and stem width, but having little effect on plant height33. The practical plant breeding consequence of this is that it enables enhanced GRV nutrient assimilation without loss of the beneficial semi-dwarfism conferred by DELLA accumulation. GRV NUE can thus be improved, without the yield-loss penalties of increased lodging. Genetic variation of OsGRF4 (and orthologues) should now become a major target for breeders in enhancing crop yield and nutrient use-efficiency. Such enhancements will enable future green revolutions, sustainably increasing yield, yet reducing environmentally degrading agricultural N use.
Methods
Plant materials and field growth conditions
Details of rice germplasm used for positional cloning and haplotype analysis have been described elsewhere22,31,34. QTL analysis and map-based cloning were performed using BC1F2, BC2F2 and BC3F2 populations derived from a cross between selected variety NM73 and indica variety NJ6 (the recurrent parent). Near Isogenic Line (NIL) plants carrying differing combinations of the qngr2 and sd1 alleles were bred by crossing NM73 × NJ6 and NM73 × 9311 F1 six times with NJ6, NJ6-sd1 and 9311 as recurrent parents, respectively. Field-grown NILs and transgenic rice plants were raised in standard paddy conditions with an interplant spacing of 20 cm at Institute of Genetics and Developmental Biology experimental station sites located in Lingshui (Hainan Province), Hefei (Anhui Province) and Beijing as previously described22,32. Field-grown wheat plants (Chinese wheat GRV KN199 and transgenic derivatives) were planted during the winter planting season at the Experimental Station of the Institute of Cereal and Oil Crops, Hebei Academy of Agriculture and Forestry Sciences (Shijiazhuang, Hebei province).
Hydroponic culture conditions
Hydroponic culture conditions were modified from those of Liu (2004)35. Seeds were disinfected in 20% sodium hypochlorite solution for 30 min, thoroughly washed with deionized water, and then germinated in moist Perlite. 7-day-old seedlings were then selected and transplanted to PVC pots containing 40 L + N nutrient solution (1.25 mM NH4NO3, 0.5 mM NaH2PO4·2H2O, 0.75 mM K2SO4, 1 mM CaCl2, 1.667 mM MgSO4·7H2O, 40 μM Fe-EDTA (Na), 19 μM H3BO3, 9.1 μM MnSO4·H2O, 0.15 μM ZnSO4·7H2O, 0.16 μM CuSO4, and 0.52 μM (NH4)3Mo7O24·4H2O, pH 5.5). The compositions of nutrient solutions containing different levels of supplied N were as follows: 1N, 1.25 mM NH4NO3; 0.6N, 0.75 mM NH4NO3; 0.3N, 0.375 mM NH4NO3; 0.15N, 0.1875 mM NH4NO3. All nutrient solutions were changed twice per week, pH was adjusted to 5.5 every day. The temperature was maintained at 30 °C day and 22 °C night, and the relative humidity was 70%.
Positional cloning of qNGR2
The map-based cloning of qngr2 was based on 1,849 BC2F2 and 3,124 BC3F2 populations derived from the backcross between the selected variety NM73 and the indica rice variety NJ6 (with NJ6 as the recurrent parent). Primer sequences used for map-based cloning and genotyping assays are given in Supplementary Information Table 5.
Transgene constructs
The OsGRF4NGR2 mRNA-encoding sequence (together with intron sequences) was amplified from NJ6. The OsGRF4ngr2 mRNA-coding sequence (together with introns and/or promoter regions lying ~3-kbp upstream of the transcription start site) were amplified from NM73. These amplified genomic DNA fragments were then inserted into the pActin::nos36 and pCAMBIA2300 (CAMBIA, www.cambia.org) vectors to respectively generate the pActin::OsGRF4NGR2 and pOsGRF4ngr2::OsGRF4ngr2 constructs. A full-length OsGRF4ngr2 cDNA was introduced into the p35S::GFP-nos22 and p35S::Flag-nos34 vectors to respectively generate the p35S::OsGRF4ngr2-GFP and p35S::Flag-OsGRF4ngr2 constructs. A 300-bp OsGRF4ngr2 cDNA fragment was amplified and used to construct the pActin::RNAi-OsGRF4 transgene, as described elsewhere32. gRNA constructs required for construction of the CRISPR/Cas9-generated OsGRF4 loss of function allele (osgrf4) in the WYJ7 genetic background were made as described elsewhere21,34. Transgenic rice and wheat plants were generated by Agrobacterium-mediated transformation as described elsewhere32. Relevant primer sequences are given in Supplementary Information Table 6.
Quantitative real time PCR (qRT-PCR)
Total RNAs were extracted from different organs of 3-week-old rice plants under hydroponic conditions using the TRIzol reagent (Invitrogen), and then treated with RNase-free DNase I (Invitrogen) according to the manufacturer’s protocol. Full-length cDNA was then reverse-transcribed using a cDNA synthesis kit (TRANSGEN, AE311). Subsequent qRT-PCR was performed according to the manufacturer’s instructions (TRANSGEN, AQ101), using three independent RNA preparations as biological replicates. Rice Actin2 gene transcripts were used as a reference. The relevant primer sequences are given in Supplementary Information Table 7.
Bimolecular fluorescence complementation (BiFC) assays
The full-length cDNAs corresponding to the SLR1, OsGIF1, OsGIF2, OsGIF3, OsGRF1, OsGRF2, OsGRF3, OsGRF4, OsGRF5, OsGRF6, OsGFR7, OsGRF8, OsGRF9, OsGRF10, OsGRF11 and OsGRF12 genes, along with both deleted and non-deleted versions of an OsGRF4 cDNA were amplified from NJ6. The resultant amplicons were inserted into the pSY-735-35S-cYFP-HA or pSY-736-35S-nYFP-EE vectors37 to generate fusion constructs. Co-transfection of constructs (e.g., those encoding nYFP-OsGRF4 and cYFP-SLR1) into tobacco leaf epidermal cells by Agrobacterium-mediated infiltration enabled testing for protein-protein interaction. Following 48h incubation in the dark, the YFP signal was examined and photographed using a confocal microscope (Zeiss LSM710). Each BiFC assay was repeated at least three times. Relevant primer sequences are given in Supplementary Information Table 6.
Co-immunoprecipitation (Co-IP) and western blotting
Full-length OsGRF4, OsGIF1 and SLR1 cDNAs were amplified, and then inserted into either the pUC-35S-HA-RBS or the pUC-35S-Flag-RBS vector as previously described38. A. thaliana protoplasts were transfected with 100 μg of plasmid and then incubated overnight in low light intensity conditions. Total protein was then extracted from harvested protoplasts by treating with 50 mM HEPES (pH7.5), 150 mM KCl, 1 mM EDTA (pH8), 0.3% Trition-X 100, 1 mM DTT with added proteinase inhibitor cocktail (Roche LifeScience). Lysates were incubated with magnetic beads conjugated with an anti-DDDDK-tag antibody (MBL, M185-11) at 4°C for at least 4 hours. The magnetic beads were then rinsed 6 times with the extraction buffer and eluted with 3×Flag peptide (Sigma-Aldrich, F4709). Immunoprecipitates were electrophoretically separated by SDS-PAGE and transferred to a nitrocellulose membrane (GE Healthcare). Proteins were detected by immunoblot using the antibodies anti-Flag (Sigma, F1804) and anti-HA (MBL, M180-7). In addition, the OsGRF4, SLR1, OsLhca1, OsLhca3, OsLhca4, OsLhcb2, OsPsaD and OsPsaE proteins were detected by probing the membrane with anti-OsGRF4 antibodies (Abmart), anti-SLR1 antibodies (ABclonal Technology), anti-OsLhca1 antibodies (Agrisera, AS01005), anti-OsLhca3 antibodies (Agrisera, AS01007), anti-OsLhca4 antibodies (Agrisera, AS01008), anti-OsLhcb2 antibodies (Agrisera, AS01003), anti-OsPsaD antibodies (Agrisera, AS09461) and anti-OsPsaE antibodies (Agrisera, AS08324A), respectively. Uncropped blots were shown in Supplementary Information Figure. 1. Relevant primer sequences are given in Supplementary Information Table 6.
EMSA assays
EMSA was performed as previously described with minor modifications39. Full-length OsGIF1 and SLR1 cDNAs were amplified and cloned into the pCold-TF vector (Takara). His-OsGIF1 and His-SLR1 recombinant proteins were purified using Ni-NTA agarose (QIAGEN, 30210), following the manufacturer’s instructions. GST (Glutathione S-transferase) and GST-OsGRF4 recombinant protein were expressed in the Escherichia coli BL21 (DE3) strain and then purified using Glutathione Sepharose 4B beads (GE Healthcare, 17-0756-01). 42 bp DNA probes were artificially amplified and labelled using a biotin label kit (Biosune). DNA gel shift assays were performed using the LightShift Chemiluminescent EMSA kit (Thermo Fisher Scientific, 20148). Relevant primer sequences are given in Supplementary Information Table 8.
RNA-seq analysis
Total RNAs were extracted from 3-week-old rice plants grown under high N conditions (1.25 mM NH4NO3) using the QIAGEN RNeasy plant mini kit (QIAGEN, 74904) following the manufacturer’s instructions. Three replicate RNA-seq libraries were prepared from NJ6, NJ6-sd1 and NJ6-OsGRF4ngr2 plants, respectively. A total of the nine libraries were sequenced separately using the BGISEQ-500 sequencer. For each RNA sample, the NIL plants were collected from three replicates and pooled together following RNA extraction. Raw sequencing reads were cleaned by removing adaptor sequences, reads containing poly-N sequences, and low-quality reads. The approximately 24,006,405 clean reads were mapped to the Nipponbare reference genome using HISAT40/Bowtie241 tools. After data were mapped, normalization was performed and then FPKM (fragments per kilobase per million mapped reads) was calculated using RESM software42. As previously described43, the FDR (false discovery rate) < 0.01 and the absolute value of log2 Ratio ≥ 2 were used to identify differentially expressed genes (DEGs) in NJ6-sd1 versus NJ6 and NJ6-OsGRF4ngr2 versus NJ6 samples. Comparisons of the three individual replicate FPKM values of the genes involved in the coordinated regulation of plant growth, N, and C metabolism are given in Supplementary Information Table 3.
ChIP-seq and ChIP-qPCR assays
ChIP assays were performed as previously described with minor modifications44. ~2 g of 2-week-old seedlings of transgenic p35S::Flag-OsGRF4ngr2 rice plants grown under the high N (1.25 mM NH4NO3) conditions were fixed with 1% (v/v) formaldehyde under vacuum for 15 min at 20-25°C, and then homogenized in liquid nitrogen. Following isolation and lysing of nuclei, the chromatin complexes were isolated and ultrasonically fragmented into fragments of average size of ~500 bp. Immunoprecipitations were performed with anti-Flag antibodies (Sigma, F1804) overnight at 4 °C. The precipitated DNA was recovered and dissolved in water and stored at -80 °C. Illumina sequencing libraries were constructed according to the manufacturer’s instructions, and then sequenced on the BGISEQ-500 platform. Sequencing reads were mapped to the Nipponbare reference genome using SOAP aligner/soap245. The peak summits were used to define the peak location types on the genome, and motif search and classification were performed as previously described46. In addition, the precipitated DNA samples served as template for quantitative RT-PCR. Relevant primer sequences are given in Supplementary Information Table 9.
FRET (Förster resonance energy transfer) assay
Cauliflower mosaic virus 35S promoter-driven fusion constructs with C-terminal tagging CFP or YFP were created to generate the donor vector p35S::OsGIF1-CFP and the acceptor vector p35S::OsGRF4-YFP. Donor and acceptor vectors, with or without a p35S::SLR1 vector and/or GA (GA3), were co-transformed into tobacco leaf epidermis cells by Agrobacterium-mediated infiltration to provide the FRET channel. Transformation with p35S::OsGIF1-CFP vector only provided the Donor channel, and with p35S::OsGRF4-YFP vector only the Accepter channel. The FRET signal was detected and photographed using a confocal microscope (Zeiss LSM710). Relevant primer sequences are given in Supplementary Information Table 6.
In vitro transient transactivation assays
~2-kb DNA promoter fragments from each of OsAMT1.1, OsAMT1.2, OsNRT1.1B, OsNRT2.3a, OsNPF2.4, OsGS1.2, OsGS2, OsNADH-GOGAT2, OsFd-GOGAT, OsNIA1, OsNIA3, OsNiR1, OsCAB1, OsTPS1, OsSWEET11, OscycA1;1, Oscdc2Os-3, or OsGRF4 were amplified from NJ6, and then subcloned into a pUC19 vector containing the firefly LUC reporter gene driven by the 35S minimal TATA box and 5×GAL4 binding elements, thus generating reporter plasmids containing specific promoters fused to LUC. The full-length OsGRF4 cDNA was amplified and fused to sequence encoding GAL4BD, thus generating the effector plasmid pRTBD-OsGRF4. Transient transactivation assays were performed using rice protoplasts as described elsewhere47. The Dual-Luciferase Reporter Assay System (Promega, E1960) was used to perform the luciferase activity assay, with the Renilla LUC gene as an internal control. Relevant primer sequences are given in Supplementary Information Table 6.
Determination of plant C and N concentration
Samples from various plant organs were dried in an oven at 80 °C for 72 hours. Following tissue homogenisation, C and N concentrations were determined using an elemental analyser (IsoPrime100; Elementar). All experiments were conducted with at least three replicates.
15N uptake analysis
Following growth in hydroponic culture for 4 weeks, rice root 15NO3− and 15NH4+ influx measurements were as described elesewhere48,49. Roots and shoots were separated and stored at −70°C before freeze drying. Roots and shoots were dried overnight at 80°C, and the 15N content was measured using the Isoprime 100 (Elementar, Germany).
Determination of glutamine synthase and nitrate reductase activities
Glutamine synthase and nitrate reductase activities were respectively determined with the Glutamine Synthetase Kit (Solarbio LIFE SCIENCES, BC0910) and the Nitrate Reductase Kit (Solarbio LIFE SCIENCES, BC0080) following the manufacturer’s instructions.
Extended Data
Extended Data Figure 1. Allelic variation at the OsGRF4 locus affects OsGRF4 mRNA abundance and root 15NH4+ uptake.
a, Positional cloning indicates the equivalence of OsGRF4 with qNGR2 (N-mediated growth response 2). Successive maps show progressive narrowing of focus of qNGR2 (red dot, using recombination break points and linked DNA markers) to an ~2.7-kbp region on chromosome 2 flanked by molecular markers L17 and L18 and overlapping candidate gene LOC_Os02g47280 (also known as OsGRF4). The start ATG (nucleotide 1) and close TGA (nucleotide 3385) of OsGRF4 are shown, together with protein-encoding DNA sequence (CDS, thick black bars). The target site for OsmiR396 is indicated by an *. The structure of a CRISPR/Cas9 generated osgrf4 mutant 91-bp deletion allele spanning parts of exon 1 and intron 1 is shown. b, 15NH4+ uptake rates of roots of BC2F2 progeny (derived from a NJ6 × NM73 cross) homozygous or heterozygous for OsGRF4NGR2 or OsGRF4ngr2 grown in high N supply (1.25 mM NH4NO3). Data shown as mean ± s.e.m. (n = 9). Different letters denote significant differences (P < 0.05, Duncan's multiple range test). c, OsGRF4 mRNA abundance in plants (genotypes as shown) relative to the abundance in NJ6 (set to one). Data shown as mean ± s.e.m. (n = 3). Different letters denote significant differences (P < 0.05, Duncan's multiple range test). d, Natural varietal OsGRF4 allelic variation. Nucleotide position relative to the OsGRF4 start ATG is shown in a. SNPs shared between varieties NM73, RD23, and TZZL1 are highlighted. Sequences representative of OsGRF4 promoter haplotypes A, B and C (see main text) are shown. e, OsGRF4 mRNA abundance in various rice varieties under the high N conditions (1.25 mM NH4NO3), OsGRF4 promoter haplotypes as indicated. Abundance data is all relative to the abundance of rice Actin2 mRNA. Data shown as mean ± s.e.m. (n = 3). Different letters denote significant differences (P < 0.05, Duncan's multiple range test). f, Comparisons of OsGRF4 mRNA abundance in selected rice varieties grown in between high (HN, 1.25 mM NH4NO3) and low (LN, 0.375 mM NH4NO3) N conditions. Data shown as mean ± s.e.m. (n = 3). Abundance data is all relative to that in HN (set to one). ** P < 0.05 as compared to HN by two-sided Student’s t-test. g, Relative abundances of rice OsmiR396 family members in NJ6 plants grown at different levels of N supply (0.15N, 0.1875 mM NH4NO3; 0.3N, 0.375 mM NH4NO3; 0.6N, 0.75 mM NH4NO3; 1N, 1.25 mM NH4NO3), shown relative to abundance in plants grown in 1N conditions (set to one). Data shown as mean ± s.e.m. (n = 3). Different letters denote significant differences (P < 0.05, Duncan's multiple range test).
Extended Data Figure 2. Comparisons NJ6, NJ6-sd1 and NJ6-sd1-OsGRF4ngr2 isogenic line traits reveals that OsGRF4 regulates expression of NH4+ metabolism genes.
a, Mature plant height. Data shown as mean ± s.e.m. (n = 16). Different letters denote significant differences (P < 0.05, Duncan's multiple range test). b, The number of tillers per plant. c, The number of grains per panicle. Data shown as mean ± s.e.m. (n = 16). Different letters denote significant differences (P < 0.05, Duncan's multiple range test). d, Flag-leaf width. Data shown as mean ± s.e.m. (n = 16). Different letters denote significant differences (P < 0.05, Duncan's multiple range test). e, Culm (stem) width expressed as diameter of the uppermost internode. Data shown as mean ± s.e.m. (n = 16). Different letters denote significant differences (P < 0.05, Duncan's multiple range test). f, Grain yield per plant. Data shown as mean ± s.e.m. (n = 220). Different letters denote significant differences (P < 0.05, Duncan's multiple range test). g, Relative root abundance of OsAMT1.2 mRNA in NILs, genotypes as indicated. Abundance shown relative to that in NJ6 plants (=1). Data shown as mean ± s.e.m. (n = 3). Different letters denote significant differences (P < 0.05, Duncan's multiple range test). h, Root glutamine synthase (GS) activities. Data shown as mean ± s.e.m. (n = 3). Different letters denote significant differences (P < 0.05, Duncan's multiple range test). i, Relative shoot abundance of OsFd-GOGAT mRNA. Abundance shown relative to that in NJ6 plants (=1). Data shown as mean ± s.e.m. (n = 3). Different letters denote significant differences (P < 0.05, Duncan's multiple range test). j, Shoot glutamine synthase (GS) activities. Data shown as mean ± s.e.m. (n = 3). Different letters denote significant differences (P < 0.05, Duncan's multiple range test). k-n, Flag-OsGRF4 mediated ChIP-PCR enrichment (relative to input) of GCGG-containing promoter fragments (marked with *) from OsAMT1.2, OsGS2, OsNADH-GOGAT2 and OsFd-GOGAT promoters. Diagrams depict putative OsAMT1.2, OsGS2, OsNADH-GOGAT2 and OsFd-GOGAT promoters and fragments (1-6). Data shown as mean ± s.e.m. (n = 3; panels k-n). Different letters denote significant differences (P < 0.05, Duncan's multiple range test). o, OsGRF4 activates pOsAMT1.2, pOsGS2, pOsNADH-GOGAT2 and pOsFd-GOGAT promoter::Luciferase fusion constructs in transient transactivation assays. Data shown as mean ± s.e.m. (n = 3). ** P < 0.05 as compared to control group by two-sided Student’s t-tests.
Extended Data Figure 3. OsGRF4 regulates expression of multiple NO3- metabolism genes.
a, Relative abundance of NO3- uptake transporter-encoding OsNRT1.1B, OsNRT2.3a and OsNPF2.4 mRNAs. Abundance shown relative to that in NJ6 (=1). Data shown as mean ± s.e.m. (n = 3). Different letters denote significant differences (P < 0.05, Duncan's multiple range test). b, Relative abundances of OsNIA1, OsNIA3 and OsNiR1 mRNAs encoding NO3- assimilation enzymes. Abundance shown relative to that in NJ6 (=1). Data shown as mean ± s.e.m. (n = 3). Different letters denote significant differences (P < 0.05, Duncan's multiple range test). c-h, Flag-OsGRF4 mediated ChIP-PCR enrichment (relative to input) of GCGG-containing fragments (marked with *) from NO3- uptake transporter-encoding (c) OsNRT1.1B, (d) OsNRT2.3a and (e) OsNPF2.4 gene promoters; NO3- assimilation enzyme-encoding (f) OsNIA1, (g) OsNIA3 and (h) OsNiR1 gene promoters. Data shown as mean ± s.e.m. (n = 3). Different letters denote significant differences (P < 0.05, Duncan's multiple range test). i, OsGRF4 activates pOsNRT1.1B, pOsNRT2.3a, pOsNPF2.4, pOsNIA1, pOsNIA3 and pOsNiR1 promoter::Luciferase fusion constructs in transient transactivation assays. Data shown as mean ± s.e.m. (n = 3) in all panels. A two-sided Student’s t-test was used to generate the P values.
Extended Data Figure 4. GA promotes GS and NR activities.
a, GS activities in roots of 2-week-old rice plants treated with 100 μM GA (GA3) and/or 2 μM paclobutrazol (PAC), genotypes as indicated. Data shown as mean ± s.e.m. (n = 3). A two-sided Student’s t-test was used to generate the P values. b, GS activities in shoots of plants treated with GA and/or PAC, genotypes and treatments as indicated in a. Data shown as mean ± s.e.m. (n = 3). A two-sided Student’s t-test was used to generate the P values. c, NR activities in shoots of plants treated with GA and/or PAC, genotypes and treatments as indicated in a. Data shown as mean ± s.e.m. (n = 3). A two-sided Student’s t-test was used to generate the P values.
Extended Data Figure 5. BiFC visualisation of SLR1-OsGIF1-OsGRF4 interactions.
a, Details of constructs expressing OsGRF4 and variants deleted for specific domains. OsGRF4 contains the QLQ (Gln, Leu, Gln) and WRC (Trp, Arg, Cys) domains, positions as indicated. b, BiFC assays. Constructs expressing OsGRF4 or deletion variants (shown as in a) tagged with the N-terminus of YFP were co-transformed into tobacco leaf epidermal cells, together with constructs expressing OsGIF1 or SLR1 tagged with the C-terminus of YFP, respectively. Scale bar, 60 μm. c, BiFC assays. Constructs expressing OsGRF1 or related OsGRFs and OsGIFs family protein tagged with the N-terminus of YFP-tagged were co-transformed into tobacco leaf epidermal cells together with a construct expressing SLR1 tagged with the C-terminus of YFP. Scale bar, 60 μm. The pictures of BiFC assays represent one of the three experiments performed independently with similar results (panels b and c).
Extended Data Figure 6. SLR1 inhibits OsGRF4-OsGIF1 self-promotion of OsGRF4 mRNA and OsGRF4 protein abundance.
a, OsGFR4 mRNA abundance, plant genotypes as indicated. Abundance shown relative to that in NJ6 (=1). Data shown as mean ± s.e.m. (n = 3). Different letters denote significant differences (P < 0.05, Duncan's multiple range test). b, The effects of GA and PAC on OsGRF4 mRNA abundance in 2-week-old NJ6 plants. Abundance shown relative to that in water treatment control (=1). Data shown as mean ± s.e.m. (n = 3). Different letters denote significant differences (P < 0.05, Duncan's multiple range test). c, ChIP-PCR OsGRF4-mediated enrichment (relative to input) of GCGG-containing OsGRF4 promoter fragments (marked with *). Data shown as mean ± s.e.m. (n = 3). Different letters denote significant differences (P < 0.05, Duncan's multiple range test). d, OsGRF4-activated promotion of transcription from the OsGRF4 gene promoter-luciferase reporter construct is enhanced by OsGIF1 and inhibited by SLR1. Abundance of LUC/REN shown relative to that in empty vector control (=1). Data shown as mean ± s.e.m. (n = 3). Different letters denote significant differences (P < 0.05, Duncan's multiple range test). e, OsGRF4 abundance (as detected by an anti-OsGRF4 antibody), plant genotypes as indicated. HSP90 serves as loading control. The pictures of western blots represent one of the three experiments performed independently with similar results.
Extended Data Figure 7. The OsGRF4-SLR1 antagonism regulates carbon assimilation and plant growth.
a, b, Relative shoot abundances of C-fixation gene mRNAs. Abundances of transcripts of genes regulating photosynthesis (a), sucrose metabolism and transport/phloem loading (b) in NJ6, NJ6-sd1 and NJ6-sd1-OsGRF4ngr2 plants. Data shown as mean ± s.e.m. (n = 3). Abundances in NJ6 and NJ6-sd1-OsGRF4ngr2 expressed relative to NJ6-sd1 (= 1). Different letters denote significant differences (P < 0.05, Duncan's multiple range test). c, ChIP-PCR assays. Diagram depicts the OsPsbS1, OsTPS1 and OsSWEET11 promoters and regions used for ChIP-PCR, and GCGG-containing promoter fragment (marked with *) enrichment (relative to input). Data shown as mean ± s.e.m. (n = 3). Different letters denote significant differences (P < 0.05, Duncan's multiple range test). d, Transactivation assays. The LUC/REN activity obtained from a co-transfection with an empty effector construct and indicated reporter constructs was set to be one. Data shown as mean ± s.e.m. (n = 9). Different letters denote significant differences (P < 0.05, Duncan's multiple range test). e, Immunoblot detection of OsLhca1, OsLhca3, OsLhca4, OsLhcb2, OsPsaD and OsPsaE using antibodies as shown in genotypes as indicated. HSP90 serves as loading control. The pictures of western blots represent one of the three experiments performed independently with similar results. f-i, Comparisons of photosynthetic rates (f), biomass (g), C content (h) and C:N ratio (i) among NJ6, NJ6-sd1 and NJ6-sd1-OsGRF4ngr2 plants. Data shown as mean ± s.e.m. (n = 30). Different letters denote significant differences (P < 0.05, Duncan's multiple range test). j, Relative shoot abundances of mRNAs transcribed from cell-cycle regulatory genes in NJ6, NJ6-sd1 and NJ6-sd1-OsGFR4ngr2 plants. Transcription relative to the level in NJ6-sd1 plants (set to one). Data shown as mean ± s.e.m. (n = 3). Different letters denote significant differences (P < 0.05, Duncan's multiple range test). k, ChIP-PCR assays. Diagram depicts the OscycA1.1 and Oscdc2Os-3 promoters and regions (GCGG-containing fragment marked with *) used for ChIP-PCR. Data shown as mean ± s.e.m. (n = 3). Different letters denote significant differences (P < 0.05, Duncan's multiple range test).l, Transactivation assays from the OscycA1.1 and Oscdc2Os-3 promoters. Data shown as mean ± s.e.m. (n = 12). Different letters denote significant differences (P < 0.05, Duncan's multiple range test).
Extended Data Figure 8. Natural allelic variation at OsGRF4 is associated with variation in plant and grain morphology and grain yield performance.
a, DNA polymorphisms in the promoter region of OsGRF4. Green-shaded regions indicate the three unique SNP variations associated with phenotypic variation in NM73 and RD23. b-f, Boxplots for plant height (b), grain length (c), grain width (d), the number of grains per panicle (e), and grain yield performance (f) of rice varieties carrying different OsGRF4 promoter haplotypes (Hap.; A, B or C). All data from plants grown in normal paddy-field fertilization conditions22. Data shown as mean ± s.e.m. (Hap. A, n = 74; Hap. B, n = 28; Hap. C, n = 123). The violin map was constructed in R. Different letters above columns indicate statistically significant differences between groups (Tukey’s honestly significant difference (HSD) test, P < 0.05; panels b-f).
Extended Data Figure 9. Agronomic traits displayed by 9311 and 9311-OsGRF4ngr2 plants grown at varying N fertilisation levels.
a, Flag leaf width. Data shown as mean ± s.e.m. (n = 30). A two-sided Student’s t-test was used to generate the P values. b, Culm width of the uppermost internode. Data shown as mean ± s.e.m. (n = 30). A two-sided Student’s t-test was used to generate the P values. c, 15NH4+ uptake. d, 15NO3- uptake. Data shown as mean ± s.e.m. (n = 30). A two-sided Student’s t-test was used to generate the P values. Rice root 15NH4+ (c) and 15NO3- (d) uptake rates of 4-week old plants grown in varying N supply (0.15N, 0.1875 mM NH4NO3; 0.3N, 0.375 mM NH4NO3; 0.6N, 0.75 mM NH4NO3; 1N, 1.25 mM NH4NO3). e, The number of grains per panicle. Data shown as mean ± s.e.m. (n = 30). A two-sided Student’s t-test was used to generate the P values. f, 1,000-grain weight. Data shown as mean ± s.e.m. (n = 30). A two-sided Student’s t-test was used to generate the P values. g, Harvest index. Data shown as mean ± s.e.m. (n = 30). A two-sided Student’s t-test was used to generate the P values. h, Dry biomass per plant. Data shown as mean ± s.e.m. (n = 30). A two-sided Student’s t-test was used to generate the P values.
Extended Data Figure 10. Growth, N uptake and grain yield performance of WYJ7-dep1-1 and transgenic WYJ7-dep1-1 plants carrying the p35S::OsGRF4ngr2-GFP construct at varying levels of N fertilization.
a, Mature plant heights. Scale bar, 15 cm. The picture represents one of the three experiments performed independently with similar results. b-d, Root uptake rates for (b) 15NH4+, (c) 15NO3- and (d) 15NH4+ and 15NO3- combined. The 4-week-old rice plants grown in low N (0.3N, 0.375 mM NH4NO3) and high N (1N, 1.25 mM NH4NO3) conditions, respectively. Data shown as mean ± s.e.m. (n = 9; panels b-d). A two-sided Student’s t-test was used to generate the P values. e, Mature plant height. Data shown as mean ± s.e.m. (n = 30). A two-sided Student’s t-test was used to generate the P values. f, Heading date. Data shown as mean ± s.e.m. (n = 30). A two-sided Student’s t-test was used to generate the P values. g, The number of tillers per plant. Data shown as mean ± s.e.m. (n = 30). A two-sided Student’s t-test was used to generate the P values. h, The number of grains per panicle. Data shown as mean ± s.e.m. (n = 30). A two-sided Student’s t-test was used to generate the P values. i, Grain yield per plant. Data shown as mean ± s.e.m. (n = 30). A two-sided Student’s t-test was used to generate the P values.
Supplementary Material
Acknowledgements
We thank Prof. M. Matsuoka and Prof. Jian Feng Ma for critical comments on this manuscript. This research was supported by grants from the National Key Research and Development Program of China (2016YFD0100401, 2016YFD0100706 and 2016YFD0100901), National Natural Science Foundation of China (91635302), Chinese Academy of Sciences (XDA08010101), and by the Biological and Biotechnological Sciences Research Council (UK) ‘Newton Fund’ Rice Research Initiative grant BB/M011224/1.
Footnotes
Data availability
Sequencing data that support the findings of this study have been deposited in the Gene Expression Omnibus (GEO) with the accession code GSE114287. Source Data (e.g. uncropped Western blots, RNA-seq data, specific SI tables etc.) generated and/or analysed in the current study are provided with the online version of the paper. All other data are available from the corresponding author upon reasonable request.
Author Contributions
S.L. performed most of the experiments; Y.T. and S.L. conducted QTL analysis; S.L., J.Z., and K.W. constructed NILs; S.L., Y.Y., and Q. L. performed field experiments; Y.T., M.H., and H.L. characterized the phenotypes of transgenic wheat plants; J.Y. performed haplotype analysis; N.P.H and X.F designed experiments; N.P.H. and X.F wrote the manuscript. All authors discussed the results and contributed to the manuscript.
Reprints and permissions information is available at www.nature.com/reprints
Competing interests The authors declare no competing interests.
References
- 1.Khush GS. Green revolution: preparing for the 21st century. Genome. 1999;42:646–655. [PubMed] [Google Scholar]
- 2.Pingali PL. Green Revolution: Impacts, limits, and the path ahead. Proc Natl Acad Sci USA. 2012;109:12302–12308. doi: 10.1073/pnas.0912953109. [DOI] [PMC free article] [PubMed] [Google Scholar]
- 3.Evenson RE, Gollin D. Assessing the impact of the green revolution, 1960 to 2000. Science. 2003;300:758–762. doi: 10.1126/science.1078710. [DOI] [PubMed] [Google Scholar]
- 4.Hedden P. The genes of the Green Revolution. Trends Genet. 2003;19:5–9. doi: 10.1016/s0168-9525(02)00009-4. [DOI] [PubMed] [Google Scholar]
- 5.Peng J, et al. Green revolution genes encode mutant gibberellin response modulators. Nature. 1999;400:256–261. doi: 10.1038/22307. [DOI] [PubMed] [Google Scholar]
- 6.Zhang C, Gao L, Sun J, Jia J, Ren Z. Haplotype variation of Green Revolution gene Rht-D1 during wheat domestication and improvement. J Integr Plant Biol. 2014;56:774–780. doi: 10.1111/jipb.12197. [DOI] [PubMed] [Google Scholar]
- 7.Sasaki A, et al. Green revolution: a mutant gibberellin-synthesis gene in rice – new insight into the rice variant that helped avert famine over thirty years ago. Nature. 2002;416:701–702. doi: 10.1038/416701a. [DOI] [PubMed] [Google Scholar]
- 8.Speilmeyer W, Ellis MH, Chandler PM. Semidwarf (sd-1), green revolution rice, contains a defective gibberellin 20-oxidase gene. Proc Natl Acad Sci USA. 2002;99:9043–9048. doi: 10.1073/pnas.132266399. [DOI] [PMC free article] [PubMed] [Google Scholar]
- 9.Harberd NP, Belfield E, Yasumura Y. The angiosperm gibberellin-GID1-DELLA growth regulatory mechanism: how an “inhibitor of an inhibitor” enables flexible response to fluctuating environments. Plant Cell. 2009;21:1328–1339. doi: 10.1105/tpc.109.066969. [DOI] [PMC free article] [PubMed] [Google Scholar]
- 10.Xu H, Liu Q, Yao T, Fu X. Shedding light on integrative GA signaling. Curr Opin Plant Biol. 2014;21:89–95. doi: 10.1016/j.pbi.2014.06.010. [DOI] [PubMed] [Google Scholar]
- 11.Itoh H, Ueguchi-Tanaka M, Sato Y, Ashikari M, Matsuoka M. The gibberellin signaling pathway is regulated by the appearance and disappearance of SLENDER RICE1 in nuclei. Plant Cell. 2002;14:57–70. doi: 10.1105/tpc.010319. [DOI] [PMC free article] [PubMed] [Google Scholar]
- 12.Asano K, et al. Artificial selection for a green revolution gene during japonica rice domestication. Proc Natl Acad Sci USA. 2011;108:11034–11039. doi: 10.1073/pnas.1019490108. [DOI] [PMC free article] [PubMed] [Google Scholar]
- 13.Gooding MJ, Addisu M, Uppal RK, Snape JW, Jones HE. Effect of wheat dwarfing genes on nitrogen-use efficiency. J Agric Sci. 2012;150:3–22. [Google Scholar]
- 14.Li B-Z. Molecular basis and regulation of ammonium transporter in rice. Rice Science. 2009;16:314–322. [Google Scholar]
- 15.Hawkesford MJ. Reducing the reliance on nitrogen fertilizer for wheat production. J Cereal Sci. 2014;59:276–283. doi: 10.1016/j.jcs.2013.12.001. [DOI] [PMC free article] [PubMed] [Google Scholar]
- 16.Zhao X, et al. Nitrogen runoff dominates water nitrogen pollution from rice-wheat rotation in the Taihu Lake region of China. Agr Ecosyst Environ. 2012;156:1–11. [Google Scholar]
- 17.Conway G. One Billion Hungry. Can We Feed the World? Cornell Univ. Press; USA: 2012. [Google Scholar]
- 18.Che R, et al. Control of grain size and rice yield by GL2-mediated brassinosteroid responses. Nat Plants. 2015;2 doi: 10.1038/nplants.2015.195. 15195. [DOI] [PubMed] [Google Scholar]
- 19.Duan P, et al. Regulation of OsGRF4 by OsmiR396 controls grain size and yield in rice. Nat Plants. 2015;2 doi: 10.1038/nplants.2015.203. 15203. [DOI] [PubMed] [Google Scholar]
- 20.Hu J, et al. A rare allele of GS2 enhances grain size and grain yield in rice. Mol Plant. 2015;8:1455–1465. doi: 10.1016/j.molp.2015.07.002. [DOI] [PubMed] [Google Scholar]
- 21.Ma X, et al. A robust CRISPR/Cas9 system for convenient, high-efficiency multiplex genome editing in monocot and dicot plants. Mol Plant. 2015;8:1274–1284. doi: 10.1016/j.molp.2015.04.007. [DOI] [PubMed] [Google Scholar]
- 22.Sun H, et al. Heterotrimeric G proteins regulate nitrogen-use efficiency in rice. Nat Genet. 2014;46:652–656. doi: 10.1038/ng.2958. [DOI] [PubMed] [Google Scholar]
- 23.Somers DA, Kuo T, Kleinhofs A, Warner RL, Oaks A. Synthesis and degradation of barley nitrate reductase. Plant Physiol. 1983;72:949–952. doi: 10.1104/pp.72.4.949. [DOI] [PMC free article] [PubMed] [Google Scholar]
- 24.Tabuchi M, Abiko T, Yamaya T. Assimilation of ammonium ions and reutilization of nitrogen in rice (Oryza sativa L.) J Exp Bot. 2007;58:2319–2327. doi: 10.1093/jxb/erm016. [DOI] [PubMed] [Google Scholar]
- 25.Peng J, et al. The Arabidopsis GAI gene defines a signaling pathway that negatively regulates gibberellin responses. Genes Dev. 1997;11:3194–3205. doi: 10.1101/gad.11.23.3194. [DOI] [PMC free article] [PubMed] [Google Scholar]
- 26.Nunes-Nesi A, Fernie AR, Stitt M. Metabolic signalling aspects underpinning plant carbon nitrogen interactions. Mol Plant. 2010;3:973–996. doi: 10.1093/mp/ssq049. [DOI] [PubMed] [Google Scholar]
- 27.LeCain DR, Morgan JA, Zerbi G. Leaf anatomy and gas exchange in nearly isogenic semidwarf and tall winter wheat. Crop Sci. 1989;29:1246–1251. [Google Scholar]
- 28.Morgan JA, LeCain DR, Wells R. Semidwarfing genes concentrate photosynthetic machinery and affect leaf gas exchange of wheat. Crop Sci. 1990;30:602–608. [Google Scholar]
- 29.Fabian T, Lorbiecke R, Umeda M, Sauter M. The cell cycle genes cycA1;1 and cdc2Os-3 are coordinately regulated by gibberellin in planta. Planta. 2000;211:376–383. doi: 10.1007/s004250000295. [DOI] [PubMed] [Google Scholar]
- 30.Sauter M. Differential expression of a CAK (cdc2-activating kinase)-like protein kinase, cyclins and cdc2 genes from rice during the cell cycle and in response to gibberellin. Plant J. 1997;11:181–190. doi: 10.1046/j.1365-313x.1997.11020181.x. [DOI] [PubMed] [Google Scholar]
- 31.Yu J, et al. OsLG3 contributing to rice grain length and yield was mined by Ho-LAMap. BMC Biol. 2017;15:28. doi: 10.1186/s12915-017-0365-7. [DOI] [PMC free article] [PubMed] [Google Scholar]
- 32.Huang X, et al. Natural variation at the DEP1 locus enhances grain yield in rice. Nat Genet. 2009;41:494–497. doi: 10.1038/ng.352. [DOI] [PubMed] [Google Scholar]
- 33.Serrano-Mislata A, et al. DELLA genes restrict inflorescence meristem function independently of plant height. Nat Plants. 2017;3:749–754. doi: 10.1038/s41477-017-0003-y. [DOI] [PMC free article] [PubMed] [Google Scholar]
- 34.Wang S, et al. Non-canonical regulation of SPL transcription factors by a human OTUB1-like deubiquitinase defines a new plant type rice associated with higher grain yield. Cell Res. 2017;27:1142–1156. doi: 10.1038/cr.2017.98. [DOI] [PMC free article] [PubMed] [Google Scholar]
- 35.Liu W-J, Zhu Y-G, Smith FA, Smith SE. Do phosphorus nutrition and iron plaque alter arsenate (As) uptake by rice seedlings in hydroponic culture? New Phytol. 2004;162:481–488. [Google Scholar]
- 36.Wang S, et al. Control of grain size, shape and quality by OsSPL16 in rice. Nat Genet. 2012;44:950–954. doi: 10.1038/ng.2327. [DOI] [PubMed] [Google Scholar]
- 37.Bracha-Drori K, et al. Detection of protein-protein interactions in plants using bimolecular fluorescence complementation. Plant J. 2004;40:419–427. doi: 10.1111/j.1365-313X.2004.02206.x. [DOI] [PubMed] [Google Scholar]
- 38.Chen H, et al. Firefly luciferase complementation imaging assay for protein-protein interactions in plants. Plant Physiol. 2008;146:368–376. doi: 10.1104/pp.107.111740. [DOI] [PMC free article] [PubMed] [Google Scholar]
- 39.Chen L, et al. OsMADS57 together with OsTB1 coordinates transcription of its target OsWRKY94 and D14 to switch its organogenesis to defense for cold adaptation in rice. New Phytol. 2018;218:219–231. doi: 10.1111/nph.14977. [DOI] [PMC free article] [PubMed] [Google Scholar]
- 40.Kim D, Langmead B, Salzberg SL. HISAT: a fast spliced aligner with low memory requirements. Nat Methods. 2015;12:357–360. doi: 10.1038/nmeth.3317. [DOI] [PMC free article] [PubMed] [Google Scholar]
- 41.Langmead B, Trapnell C, Pop M, Salzberg SL. Ultrafast and memory-efficient alignment of short DNA sequences to the human genome. Genome Biol. 2009;10:25–34. doi: 10.1186/gb-2009-10-3-r25. [DOI] [PMC free article] [PubMed] [Google Scholar]
- 42.Li B, Dewey CN. RSEM: accurate transcript quantification from RNA-Seq data with or without a reference genome. BMC bioinformatics. 2011;12:323. doi: 10.1186/1471-2105-12-323. [DOI] [PMC free article] [PubMed] [Google Scholar]
- 43.Benjamini Y, Drai D, Elmer G, Kafkafi N, Golani I. Controlling the false discovery rate in behavior genetics research. Behav Brain Res. 2001;125:279–284. doi: 10.1016/s0166-4328(01)00297-2. [DOI] [PubMed] [Google Scholar]
- 44.O'Geen H, Frietze S, Farnham PJ. Using ChIP-seq technology to identify targets of zinc finger transcription factors. Methods Mol Biol. 2010;649:437–455. doi: 10.1007/978-1-60761-753-2_27. [DOI] [PMC free article] [PubMed] [Google Scholar]
- 45.Li R, et al. SOAP2: an improved ultrafast tool for short read alignment. Bioinformatics. 2009;25:1966–1967. doi: 10.1093/bioinformatics/btp336. [DOI] [PubMed] [Google Scholar]
- 46.Lu Z, et al. Genome-wide binding analysis of the transcription activator ideal plant architecture1 reveals a complex network regulating rice plant architecture. Plant Cell. 2013;25:3743–3759. doi: 10.1105/tpc.113.113639. [DOI] [PMC free article] [PubMed] [Google Scholar]
- 47.Wang S, et al. The OsSPL16-GW7 regulatory module determines grain shape and simultaneously improves rice yield and grain quality. Nat Genet. 2015;47:949–954. doi: 10.1038/ng.3352. [DOI] [PubMed] [Google Scholar]
- 48.Ho CH, Lin SH, Hu HC, Tsay YF. CHL1 functions as a nitrate sensor in plants. Cell. 2009;138:1184–1194. doi: 10.1016/j.cell.2009.07.004. [DOI] [PubMed] [Google Scholar]
- 49.Loqué D, et al. Additive contribution of AMT1;1 and AMT1;3 to high-affinity ammonium uptake across the plasma membrane of nitrogen-deficient Arabidopsis roots. Plant J. 2006;48:522–534. doi: 10.1111/j.1365-313X.2006.02887.x. [DOI] [PubMed] [Google Scholar]
Associated Data
This section collects any data citations, data availability statements, or supplementary materials included in this article.


