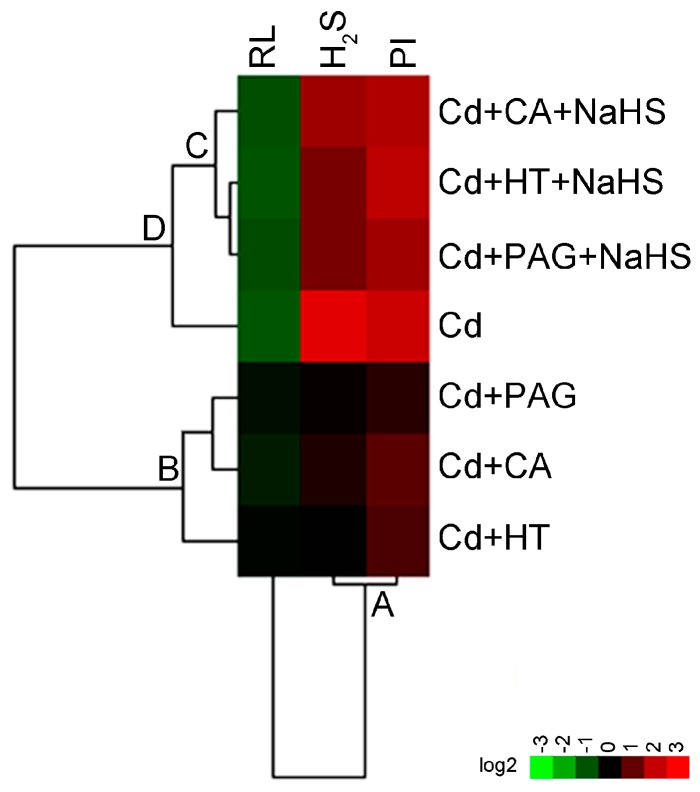
Figure 9.
Hierarchical cluster analysis of interaction between CA and H2S on physiological responses of tobacco seedling roots under Cd stress. The relative data of RL (root length), H2S content (indicated by WSP-1 fluorescent density), and cell death (indicated by PI fluorescent density) in roots with different treatment, were selected for cluster analysis. All of the data were presented as relative fold changes with respect to control. The cluster color bar was shown as a log2 fold change. Red indicates an increase while green indicates a decrease.

