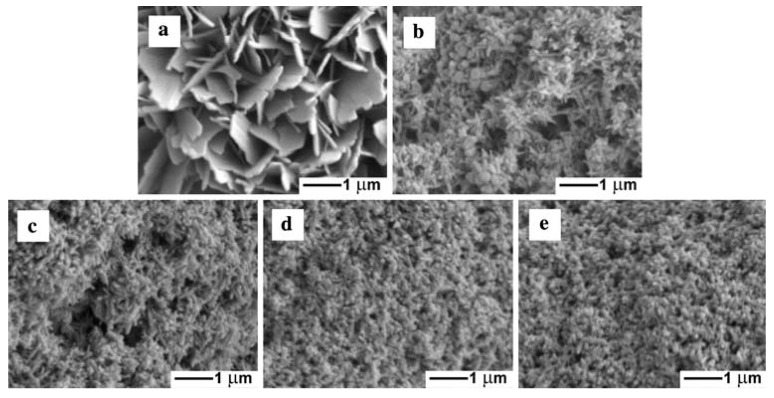
Figure 6.
Scanning electron microscopy (SEM) micrographs of the samples prepared by sonoelectrodeposition under different current densities. (a) 5 mA/cm2; (b) 8 mA/cm2; (c) 13 mA/cm2; (d) 20 mA/cm2; and (e) 34 mA/cm2. Reprinted from [31] with permission of Springer.

