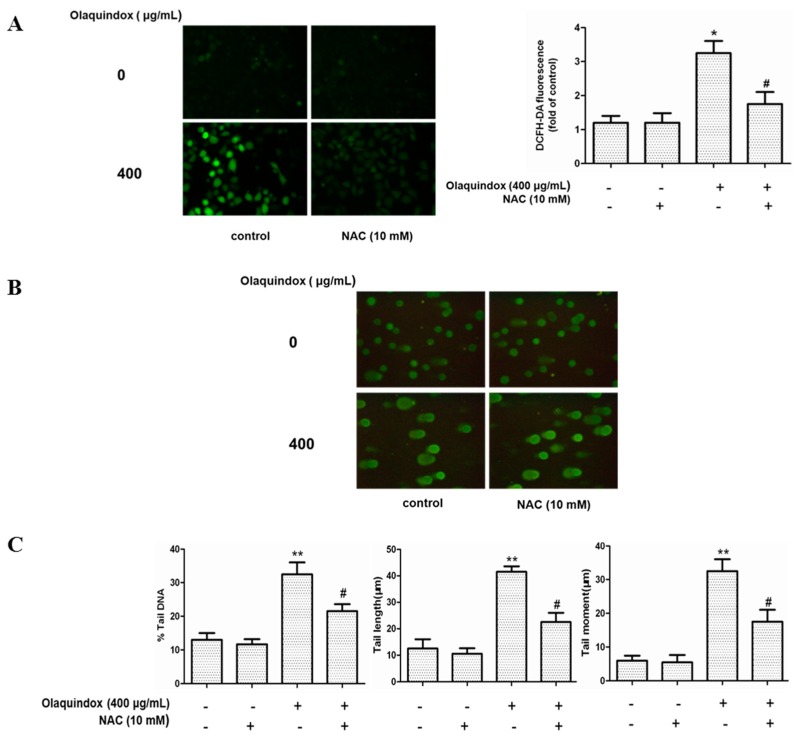
Figure 5.
The role of ROS in olaquindox-induced DNA damage. Cells were pre-treated with NAC (10 mM) for 2 h and then co-treated with olaquindox for 24 h and then incubated with 10 μM DCFH-DA for 30 min at 37 °C. (A) The fluorescence intensity was visualized with a fluorescent microscope, and the images (400×) presented are representative of the fluorescence levels observed three times. The analysis of fluorescent intensity used Image Pro Plus 5.0 software; (B) DNA strand break was measured by the comet assay and cells were observed under a Leica inverted fluorescence microscope (400×); (C) The data analysis of % tail DNA, tail length and tail moment. All results were presented as mean ± SD, from three independent experiments. (* p < 0.05, ** p < 0.01, compared with the control group; # p < 0.05, compared to the olaquindox alone groups).

