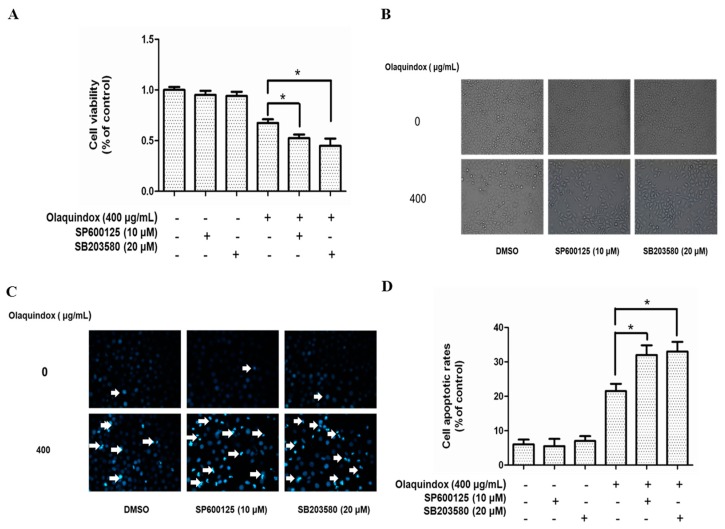
Figure 9.
Effects of JNK/p38 pathways on olaquindox-induced cell death. HepG2 cells were pretreated with SP600125 or SB203580 for 1 h, followed to replace with or without olaquindox at the final concentration of 400 µg/mL for additional 24 h. (A) Cell viability was measured by MTT method; (B) Morphologic observation (400×); (C) Cell apoptosis was measured by staining with Hoechst 33342 (400×); (D) Quantification of apoptosis in HepG2 cells. Bright blue cells were counted as apoptotic cells from five independent microscopic fields. Results were presented as mean ± SD, from three independent experiments. (* p < 0.05, compared to the olaquindox alone group).

