

Abstract
Previous studies have demonstrated that low skeletal muscle mass is related to decreased lung function in patients with chronic obstructive pulmonary disease. However, there is little information about the relationship between skeletal muscle mass and lung function in asymptomatic adults without clinically apparent lung disease.
This was a cross-sectional study of 240,562 Korean adults without known lung disease. All subjects underwent both pulmonary function test (PFT) and bioelectrical impedance analysis in the health checkup program at Kangbuk Samsung Hospital. Skeletal muscle mass index (SMI) was estimated as skeletal muscle mass/weight×100. We analyzed the relationship between SMI and PFT using multivariate logistic regression models.
Of the 240,562 study subjects, values for forced vital capacity (FVC), forced expiratory volume in 1 second (FEV1), and peak expiratory flow (PEF) were decreased across quartiles (Qs) of decreasing SMI. After adjustments for various confounders including demographic and health behavior-related factors, odds ratios (ORs; 95% confidence interval) for subjects with FVC% <80% for Q1–Q3 compared with Q4 (reference) were 2.97 (2.74–3.17), 2.11 (1.99–2.27), and 1.66 (1.52–1.83), respectively. ORs for subjects with FEV1% <80% for Q1–Q3 compared with Q4 were 2.64 (2.43–2.83), 1.96 (1.83–2.09), and 1.51 (1.43–1.62), respectively. Lastly, OR for subjects with PEF% <80% for Q1–Q3 compared with Q4 were 1.73 (1.58–1.89), 1.35 (1.26–1.45), and 1.23 (1.15–1.30), individually. Subgroup analyses for gender and all age groups showed the associations of decreasing SMI Qs with lower FVC%, FEV1%, and PEF% remained significant.
Decreased SMI was independently associated with decline in lung function in apparently healthy adults. This association was sustained in subgroup analyses by gender and all age groups.
Keywords: adult population, pulmonary function test, skeletal muscle mass index
1. Introduction
Sarcopenia, characterized by the generalized loss of skeletal muscle mass, is a growing health problem in an aging society.[1,2] Sarcopenia has been known to be related to several conditions such as cardiovascular diseases, diabetes, chronic kidney disease, infections, fatty liver diseases, and metabolic disorders.[3,4] Furthermore, the relationships between low skeletal muscle mass and the chronic diseases have been reported not only in the elderly, but in the general population, including young adults, because various risk factors contribute to progressive loss of skeletal muscle mass such as aging, poor nutritional status, lack of physical activity, and chronic inflammatory diseases (e.g., rheumatoid arthritis).[5,6]
Previous studies reported that decreased skeletal muscle mass was associated with decreased lung function in patients with chronic obstructive pulmonary disease (COPD).[7,8] Moreover, COPD prognosis was also related to low skeletal muscle mass in patients with COPD.[9,10] Recently, in a study of male nursing home residents, Bahat et al[11] demonstrated that peripheral muscle strength, including hand grip strength, was positively associated with maximal inspiratory and expiratory muscle strength. However, at present, there is a lack of information about how alterations in skeletal muscle mass are related to pulmonary function in asymptomatic adults without known lung disease. To the best of our knowledge, this is the first study to report the associations between skeletal muscle mass and pulmonary function in a large sample from a general population without clinically apparent lung disease.
Therefore, we aimed to investigate whether skeletal muscle mass is associated with lung function in Korean adults without clinically apparent lung disease. Additionally, we evaluated the relationship between skeletal muscle mass and lung function by gender and all age subgroups.
2. Methods
2.1. Study participants
This cross-sectional study was conducted to investigate the relationship between skeletal muscle mass and pulmonary function in Korean health screening subjects without clinically apparent lung disease. Study subjects had undergone a medical health check-up program at 2 Health Promotion Centers of Kangbuk Samsung Hospital of Seoul and Suwon in South Korea.
Between January 2012 and December 2015, a total of 317,588 men and women (18–89 years old) participated in this medical check-up program for whom pulmonary function tests (PFT) and skeletal muscle mass (kg) were examined. Among them, 77,026 participants were excluded based on the following exclusion criteria: 60,283 had abnormal chest radiographs; 7573 had history of malignancy; 5649 had history of chronic lung disease (asthma or COPD); and 3521 had clinical symptoms of dyspnea (Fig. 1). This exclusion resulted in a final study population of 240,562 participants. This study protocol was approved by the Sungkyunkwan University Institutional Review Board, which exempted the requirement for informed consent because the researchers retrospectively assessed deidentified data only for analytical purposes.
Figure 1.
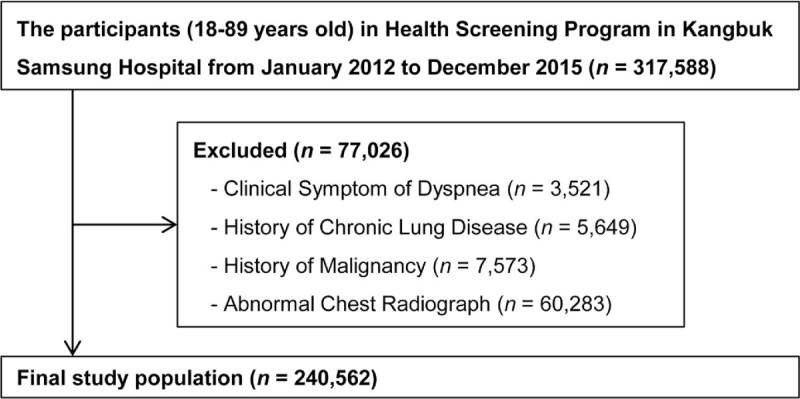
Selection of the study population.
2.2. Laboratory data and anthropometric measurements
Study subjects completed self-administered questionnaires including medical history review, alcohol consumption (g/d), smoking status, physical activity, and total nutrient intake. Any clinical symptoms of dyspnea, drug prescription, and past medical history were evaluated by the examining physicians. Participants with alcohol consumption over 20 g/d were grouped into a heavy drinking group.[12] Smoking status was assessed by self-reported questionnaire and categorized into never, former, or current smoking. Physical activity was evaluated by the International Physical Activity Questionnaire Short Form (IPAQ-SF).[13] Regular physical exercise was defined as vigorous exercise >3 times/wk for over 20 minutes/session or moderate exercise >5 times/wk for over 30 minutes/session.[13,14] Total nutrient intake (kcal/d) was evaluated by a 103-item, self-administered food frequency questionnaire validated for use in Korea, and was calculated using a food composition table developed by the Korean Nutrition Society.[15,16]
Serum biochemical parameters and anthropometric measurements were collected by trained staff during the health examination. Blood samples were collected in the morning from the antecubital vein of study subjects who had fasted for at least 12 hours. Serum biochemical parameters included fasting glucose, fasting insulin, glycated hemoglobin (HbA1c), homeostasis model assessment of insulin resistance (HOMA-IR), total cholesterol, low-density lipoprotein cholesterol (LDL-C), high-density lipoprotein cholesterol (HDL-C), triglycerides, serum creatinine, alanine aminotransferase (ALT), albumin, and total vitamin D. Insulin resistance was estimated using the following formula: HOMA-IR = fasting serum insulin (uU/mL) X fasting serum glucose (mg/dL)/405.[17]
Anthropometric measurements including body weight, height, and skeletal muscle mass were assessed by trained nurses. Skeletal muscle mass (kg) was estimated using a bioelectric impedance analyzer (BIA) with eight-point tactile electrodes (InBody 720, Biospace Co, Seoul, Korea). The BIA was calibrated every morning before the examination and was validated for reproducibility and accuracy of body composition.[18] For adjusting the effect of body weight, skeletal muscle mass index (SMI) was calculated with the following formula: SMI (%) = skeletal muscle mass (kg)/body weight (kg) × 100, based on the previously established method by Janssen et al.[19] Study subjects were divided into 4 groups according to SMI quartiles: 1st quartile (Q1): 14.4% to 38.0%, 2nd quartile (Q2): 38.1% to 40.9%, 3rd quartile (Q3): 41.0% to 43.4%, and 4th quartile: 43.5% to 63.4%.
2.3. Measurement of lung function
Spirometry was performed according to recommendations from the American Thoracic Society guidelines.[20] Measurements were made using a Vmax22 system (Sensor-Medics, Yorba Linda, CA) with the study subjects in a seated position using a nose clip. Each subject performed tests 3 times with satisfactory curves, the largest forced vital capacity (FVC), forced expiratory volume in the first second (FEV1), and peak expiratory flow (PEF) values were recorded. Subsequently, FVC%, FEV1%, PEF% of the predicted values and FEV1/FVC ratio were calculated. The percentage predicted values (% predicted) for FEV1, FVC, and PEF were referred to previously established methods derived from the Korean population.[21,22] The following cut-off levels were used to determine the low levels of PFT parameters, commonly used to represent pulmonary dysfunction: FVC% <80% of the predicted value, FEV1 <80% of the predicted value, FEV1/FVC <70%, and PEF% <80% of the predicted value.[23] All measurements were corrected for body temperature, water saturation, and air pressure.
2.4. Statistical analysis
All data are presented as means ± SD or number with percentage. Demographic characteristics and PFT parameters of the study subjects were examined by SMI quartiles. Demographic characteristics and PFT results were compared using the χ2 test or one-way analysis of variance (ANOVA) among the 4 groups. To analyze linear trends, quartile values were used as continuous variables in the regression analyses.
Univariate and multivariate logistic regression analyses were conducted to determine the association between SMI and PFT parameters in study participants. Odds ratios (ORs) were calculated as the risk for subjects with low PFT values being in Q1, Q2, and Q3 compared with Q4 (the reference for SMI quartiles). We performed 2 different models with multivariate adjustments for confounding variables. The first model (model 1) adjusted for age, sex, hypertension, fasting glucose, HOMA-IR, LDL-C, serum creatinine, and ALT. The second model (model 2) additionally adjusted for health behavior-related parameters including current smoker, heavy alcohol drinking, total vitamin D, total calorie intake, regular physical exercise, and fat mass. Additionally, SMI was introduced as a continuous variable, and crude and adjusted ORs were estimated as risk for proportions of subjects with low PFT values per 1-SD (3.8) decrease in SMI. Furthermore, we repeated the logistic regression models for subgroup analyses in study subjects stratified by gender (male and female) and age (<30, 30–39, 40–49, 50–59, and ≥60). All ORs were calculated with 95% confidence intervals (CIs). The level of statistical significance was set at P < .05. All analyses were conducted using SPSS version 18.0 (IBM Co, Armonk, NY).
3. Results
3.1. Baseline demographic characteristics of study subjects according to SMI quartiles
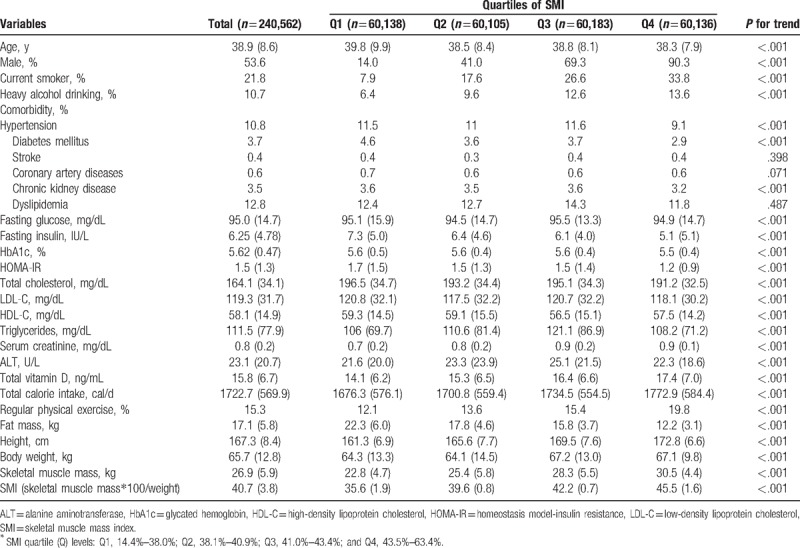
The baseline characteristics of the eligible 240,562 subjects according to quartiles of SMI are reported in Table 1. The mean age, and SMI of all subjects were 38.9 (SD, 8.6) years and 40.7 (3.8) %, respectively. Among these, the proportion of male subjects was 53.6%. The variables with negative trends relative to SMI were age, hypertension, diabetes mellitus, chronic kidney disease, fasting insulin, HbA1c, HOMA-IR, total cholesterol, LDL-C, HDL-C, and fat mass. Contrarily, the variables with positive trends relative to SMI were being male, current smoker, heavy alcohol drinking, fasting glucose, triglycerides, serum creatinine, ALT, total vitamin D, total calorie intake, regular physical exercise, height and body weight.
Table 1.
Baseline demographics of study subjects according to SMI Quartiles∗ (n = 240,562).
3.2. Comparison of PFT parameters according to SMI quartiles in study subjects
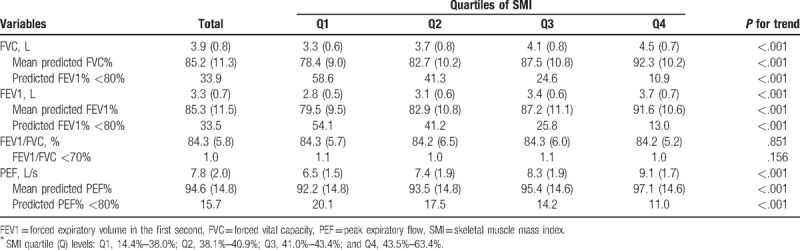
Mean values for PFT parameters and proportions of subjects with low PFT values are presented according to SMI quartile in Table 2. Mean values of FVC (L), predicted FVC%, FEV1 (L), predicted FEV1%, PEF (L/s), and predicted PEF% were significantly decreased across decreasing quartiles of SMI, respectively. The proportions of subjects with below 80% of predicted FVC%, predicted FEV1%, and predicted PEF% significantly increased as SMI quartiles decreased, respectively (all P for trend < .01). There was no significant linear trend in FEV1/FVC (%) and the proportion of subjects with FEV1/FVC<70% according to decreasing SMI quartile.
Table 2.
Pulmonary function test of study subjects by SMI Quartiles∗ (n = 240,562).
3.3. Relationship between skeletal muscle mass and pulmonary function in study subjects
Table 3 presents results of univariate and multivariate logistic regression analyses between SMI quartiles and subjects with low levels of PFT parameters. In the first model (model 1) adjusted for possible confounding factors (age, sex, hypertension, fasting glucose, HOMA-IR, LDL-C, serum creatinine, and ALT), adjusted ORs (95% CI) for subjects with FVC% <80% for Q1, Q2, and Q3 compared with Q4 (reference) were 3.54 (3.37–3.72), 2.27 (2.18–2.37), and 1.62 (1.51–1.74), respectively (P for trend < .01). Moreover, adjusted ORs for subjects with FEV1% <80% for Q1, Q2, and Q3 compared with Q4 were 2.87 (2.74–3.02), 1.97 (1.89–2.08), and 1.58 (1.39–1.80), respectively (P for trend < .01). Lastly, adjusted ORs for subjects with PEF% <80% for Q1, Q2, and Q3 compared with Q4 were 1.77 (1.68–1.88), 1.46 (1.40–1.54), and 1.26 (1.21–1.31), individually (P for trend < .01).
Table 3.
Crude and multivariate-adjusted ORs (95% CI) for decreased pulmonary function test according to SMI Quartiles∗.
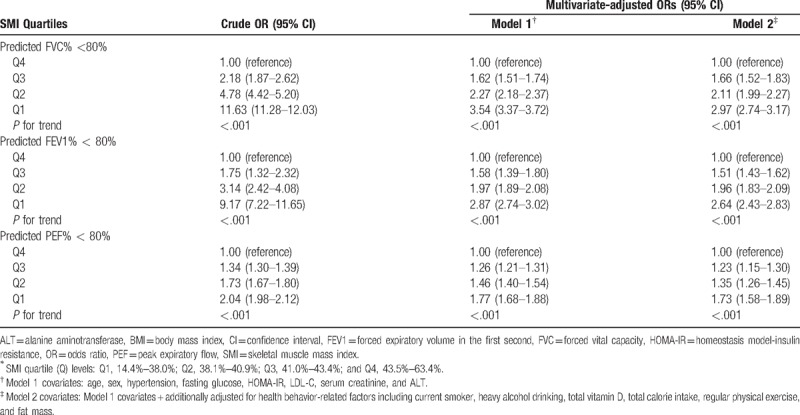
Subsequently, the second model (model 2) was additionally adjusted for health behavior-related factors including current smoker, heavy alcohol drinking, total vitamin D, total calorie intake, regular physical exercise, and fat mass. In the model 2 analyses, lower SMI quartile levels remained significantly associated with increasing prevalence of subjects with <80% of FVC%, FEV1%, and PEF%, respectively (all P for trend < .01). Adjusted ORs for subjects with FVC% <80% for Q1–Q3 compared with Q4 were 2.97 (2.74–3.17), 2.11 (1.99–2.27), and 1.66 (1.52–1.83), respectively. Adjusted ORs for subjects with FEV1% <80% for Q1–Q3 compared with Q4 were 2.64 (2.43–2.83), 1.96 (1.83–2.09), and 1.51 (1.43–1.62), respectively. Lastly, adjusted OR with PEF% <80% for Q1–Q3 referenced to Q4 were 1.73 (1.58–1.89), 1.35 (1.26–1.45), and 1.23 (1.15–1.30), individually (Table 3).
When using SMI as a continuous variable in crude and multivariate models (Fig. 2), adjusted ORs (model 2 multivariate analysis) for subjects with FVC% <80% per 1 SD (3.8) decrease of SMI was 1.70 (1.57–1.83). Adjusted ORs (model 2) for FEV1% <80% and PEF% <80% per 1 SD decrease of SMI were 1.65 (1.50–1.81) and 1.29 (1.22–1.36), individually.
Figure 2.
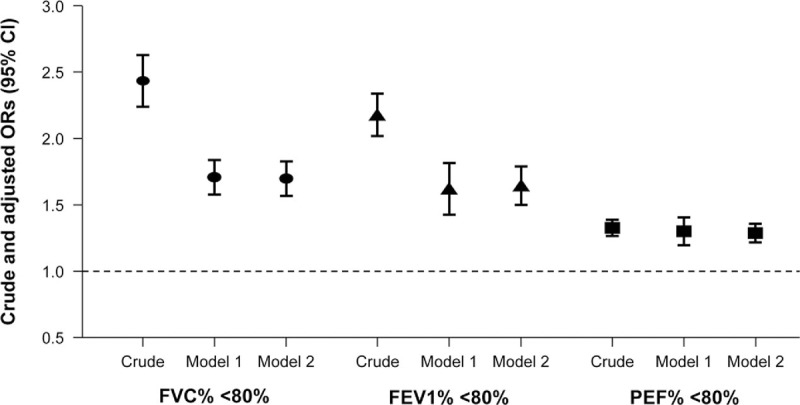
Crude and multivariate-adjusted ORs (95% CI) for subjects with <80% of PFT parameters (%FVC, %FEV1, and %PEF) per 1 SD decrease of SMI in study subjects. CI = confidence interval, FEV1 = forced expiratory volume in 1 s, FVC = forced vital capacity, OR = odds ratio, PEF = peak expiratory flow, PFT = pulmonary function test, SD = standard deviation, SMI = skeletal muscle mass index. 1 SD of SMI = 3.8.
3.4. Subgroup analyses (gender and age) for relationship between skeletal muscle mass and pulmonary function
The associations between pulmonary function and SMI for different gender and age subgroups are presented in Table 4. In both male and female groups, lower quartile levels of SMI sustained significantly associated with increasing prevalence of subjects with <80% of FVC%, FEV1%, and PEF%, respectively (all P for trend < .01; model 2 multivariate analyses). Figure 3 demonstrates multivariate-adjusted ORs (95% CI; model 2) for proportions of subjects with <80% of PFT parameters per 1 SD decrease of SMI in male and female groups. All adjusted ORs (model 2) for subjects with <80% of FVC%, FEV1%, and PEF% showed positive associations with 1 SD decrease of SMI in both male and female groups. Moreover, adjusted ORs for subjects with <80% in FVC%, FEV1%, and PEF% in male groups demonstrated higher adjusted ORs (FVC%, 1.73 [1.66–1.81]; FEV1%, 1.72 [1.59–1.85]; PEF% 1.40 [1.28–1.52]) than those in female groups (FVC%, 1.54 [1.49–1.60]; FEV1%, 1.52 [1.45–1.60]; PEF% 1.20 [1.15–1.26]), respectively (Fig. 3).
Table 4.
Subgroup analyses of multivariate-adjusted ORs (model 2†; 95% CI) for decreased pulmonary function test according to SMI Quartiles∗.
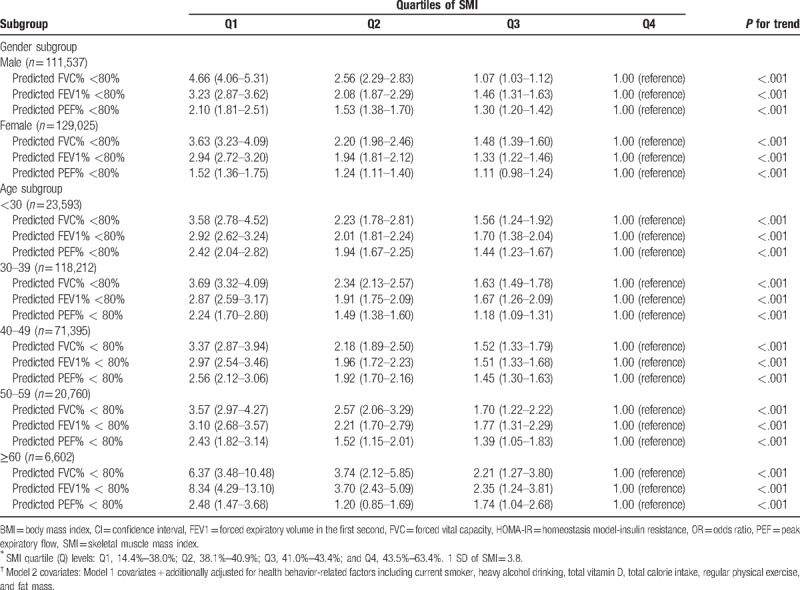
Figure 3.
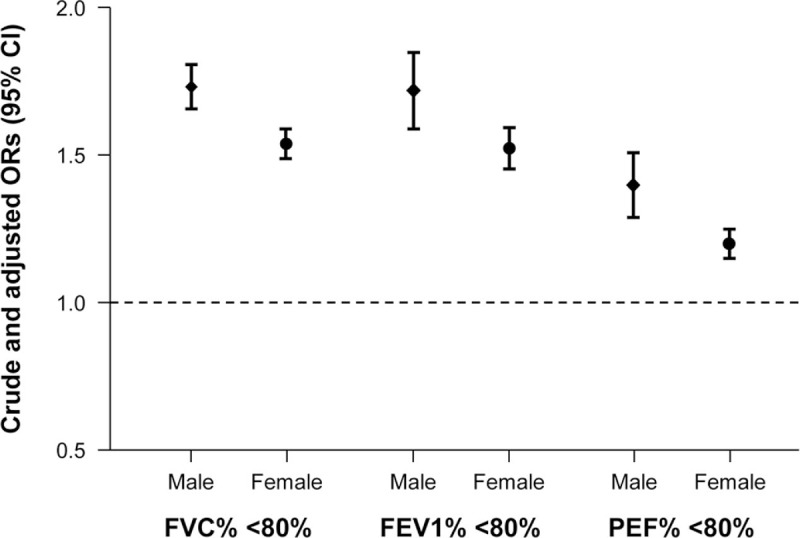
+Multivariate-adjusted ORs (95% CI) for subjects with <80% of PFT parameters (%FVC, %FEV1, and %PEF) per 1 SD decrease of SMI in male and female groups. +Estimated from multivariate logistic regression model (model 2) adjusted for age, sex, hypertension, fasting glucose, HOMA-IR, LDL-C, serum creatinine, ALT and health behavior-related factors. ALT = alanine aminotransferase, CI = confidence interval, FEV1 = forced expiratory volume in 1 s, FVC = forced vital capacity, HOMA-IR = homeostasis model assessment of insulin resistance, LDL-C = low-density lipoprotein-cholesterol, OR = odds ratio, PEF = peak expiratory flow, PFT = pulmonary function test, SD = standard deviation, SMI = skeletal muscle mass index. 1 SD of SMI = 3.8.
In the age subgroup analyses, lower quartile levels of SMI were significantly associated with increasing proportions of subjects with <80% in FVC%, FEV1%, and PEF%, respectively (all P for trend <.01; model 2 multivariate analyses) in all age groups (<30, 30–39, 40–49, 50–59, and ≥60) (Table 4). Figure 4 demonstrates multivariate-adjusted ORs (95% CI; model 2) for proportion of subjects with <80% of each PFT value per 1 SD decrease of SMI in all age groups. All adjusted ORs (model 2) for proportions of subjects with <80% of FVC%, FEV1%, and PEF% showed positive associations with 1 SD decrease of SMI in all age groups. Interestingly, the oldest age group (≥60) had the highest adjusted ORs for proportion of subjects with FVC% <80% (2.87 [2.32–3.40]; Fig. 4A) and for proportion of FEV1% <80% (3.02 [2.59–3.47]; Fig. 4B) per 1 SD decline in SMI among the age groups.
Figure 4.
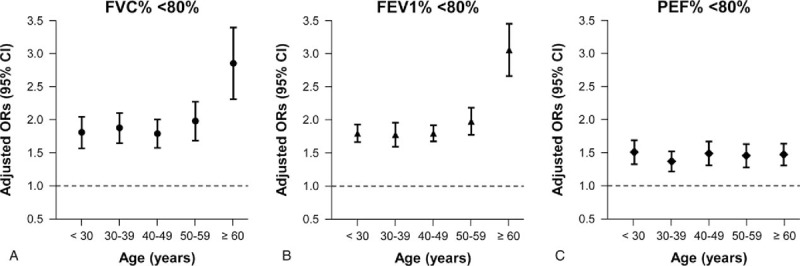
+Multivariate-adjusted ORs (95% CI) for subjects with (A) %FVC <80%, (B) %FEV1 <80%, and (C) %PEF <80% per 1 SD decrease of SMI in different age groups. +Estimated from multivariate logistic regression model (model 2) adjusted for age, sex, hypertension, fasting glucose, HOMA-IR, LDL-C, serum creatinine, ALT and health behavior-related factors. ALT = alanine aminotransferase, CI = confidence interval, FEV1 = forced expiratory volume in 1 s, FVC = forced vital capacity, HOMA-IR = homeostasis model assessment of insulin resistance, LDL-C = low-density lipoprotein-cholesterol, OR = odds ratio, PEF = peak expiratory flow, PFT = pulmonary function test, SD = standard deviation, SMI = skeletal muscle mass index. 1 SD of SMI = 3.8.
4. Discussion
In this present study with a large number of Korean subjects without known lung disease, we found that decreased skeletal muscle mass was independently associated with low levels of FEV1, FVC, and PEF after adjustment for various confounding variables including age, sex, various metabolic factors, and health behavior-related factors. Furthermore, these associations persisted in the subgroup analyses for gender and all age groups.
Among the PFT parameters, the present study showed that FVC and FEV1 were independently associated with skeletal muscle mass even after adjustments for possible confounding factors. However, FEV1/FVC was not related to skeletal muscle mass. These results are consistent with the findings of a previous study that a low skeletal muscle mass group had decreased FVC and FEV1, respectively, but consistent FEV1/FVC compared with a normal skeletal muscle mass group in elderly subjects aged over 65 years.[24] There are several explanations for these findings. Because decreased and restricted lung appears to have decreased values of FVC and FEV1, subjects with reduced SMI may have weakened ability to inflate and deflate their lungs. Thus, the values of FVC and FEV1 can decline, but FEV1/FVC describing upper airway obstruction would remain unchanged. Although SMI was estimated as generalized skeletal muscle mass, a recent study demonstrated that upper extremity strength was correlated with maximal inspiratory and expiratory pressure.[11] Namely, this finding suggests that generalized skeletal muscle mass may be related to respiratory skeletal muscle mass. Another explanation for FVC and FEV1 associated with SMI could be that loss in skeletal muscle mass is related to enhanced inflammatory mediators, which could result in impairing lung elasticity and expansion.[25,26] Therefore, in our present findings, decreased generalized skeletal muscle mass, estimated by SMI, could represent reduced lung volume and increased lung restriction rather than airway obstruction.
In this study, PEF emerged as a significant spirometric parameter associated with skeletal muscle mass. To the best of our knowledge, this is the first study to evaluate the relationship between PEF and skeletal muscle mass with adjustments for confounding factors. PEF is the maximum speed of expiration which is commonly used to monitor patients with obstructive lung diseases such as asthma.[27] But, in healthy subjects without definite lung diseases, PEF is determined by lung volume as well as expiratory muscle strength.[10,28] Moreover, previous studies demonstrated that PEF was improved by expiratory muscle strength training.[29,30] Therefore, our finding of PEF related to SMI is consistent with previous studies. However, PEF is not specific as a diagnostic method for pulmonary diseases.[31] This is why ORs for proportion of PEF%<80% per 1 SD decline in SMI were smaller than those for FVC% <80% and FEV1% <80% (Fig. 2). Nevertheless, PEF is a rapid and convenient method for screening lung function in healthy subjects and home monitoring in patients with lung diseases.[23,31] Hence, measuring PEF could be useful for screening of lung dysfunction in asymptomatic adults with decreased skeletal muscle mass.
Furthermore, we performed subgroup analyses of subjects stratified by gender and age, and the significant associations of SMI with FVC, FEV1, and PEF were still present in all subgroups of gender and age, in each. Interestingly, in gender stratified analyses, adjusted ORs for <80% of FVC%, FEV1%, and PEF% were higher in males than in females (Fig. 3). Furthermore, in age stratified analyses, adjusted ORs for <80% of FVC% and FEV1% from subjects aged over 60 years were the highest among all age groups, individually (Fig. 4). These findings suggest that lung function in elderly and male subjects was more affected by decreased SMI than that in younger and female subjects. These results can be explained partially by previous reports that oxidative stress is more evident in males and more prevalent in the elderly, which might have an influence on lung function as SMI decreases.[32,33] However, it is necessary that further studies be conducted to elucidate the mechanisms for cause–effect relations of gender and age on lung function associated with changes in skeletal muscle mass.
The present study was performed to investigate whether there were independent associations between skeletal muscle mass and PFT parameters. From our results, we concluded that FEV1, FVC, and PEF were independently associated with skeletal muscle mass. To our knowledge, this is the largest study conducted to determine the relationship between skeletal muscle mass and PFT in asymptomatic adults. Furthermore, we are the first to report that PEF was a significant parameter related to skeletal muscle mass. A previous study reported that low skeletal muscle mass was related to decreased FEV1 and FVC. However, the previous study was performed only in elderly aged over 65.[24] In the current study, we have conducted the analyses in healthy adults over 18 for generalization and further performed subgroup analyses by gender and different age groups. Moreover, because skeletal muscle mass can be influenced by age, gender, various metabolic factors, health-related behaviors, and physical status,[19,34–36] it is important to consider the effect of various confounding factors on skeletal muscle mass. Therefore, we performed analyses with adjustments for the various possible confounders, which supported the significance of the present findings.
PFT is a commonly used evaluation tool for lung function in subjects with positive pulmonary symptoms.[23] However, clinical features of pulmonary diseases such as COPD or restrictive lung disease often present later in the course of the diseases.[37,38] In a clinical practice, PFT is only recommended for patients who complained of respiratory symptoms. Evidence of the present study indicates that low skeletal muscle mass is closely linked to decreased lung function in asymptomatic subjects without known lung disease. Furthermore, previous studies demonstrated that the prognosis of COPD was related to low skeletal muscle mass in COPD patients, which supports the possibility that a common pathway may exist between low skeletal muscle mass and decreased lung function.[7,8] Since avoiding the development of severe forms of COPD or restrictive lung disease is critical, early detection of pulmonary dysfunction should be attempted at a preclinical phase of the disease.[37] Therefore, the present study suggests that PFT may be applied as an additional evaluation for lung function in asymptomatic subjects with decreased skeletal muscle mass at clinical setting. Thus, low skeletal muscle mass might be a relevant marker for pulmonary dysfunction in the apparently healthy subjects.
The present study used the definition of weight-adjusted SMI (wSMI) to diagnosis sarcopenia instead of using the height-adjusted SMI (hSMI). Although there are many reports on sarcopenia using the hSMI,[3,4,6,7] recent studies demonstrated that the hSMI could severely underestimate the prevalence of sarcopenia among Southeast Asians including Chinese and Korean elderly.[39–41] Furthermore, Kim et al[39] reported that the hSMI seemed to be unable to determine the subjects with sarcopenic obesity. There are a few possible explanations related to underestimation of sarcopenia by the hSMI in Korean population. Because the Korean elderly experienced a quick industrialization, the increased height in the younger subjects should be considered as it was the reference subjects for determining sarcopenia by height definition. Moreover, the difference of the mean height between the 20's and 80's was 14.5 cm in Korean subjects.[39] Furthermore, the important property of body fat is not incorporated using the hSMI.[40] Lim et al[42] demonstrated that sarcopenic obesity defined by the wSMI was more closely related to metabolic syndrome in the Korean longitudinal study, which shows wSMI as a clinically useful definition. Therefore, SMI adjusted by body weight may be a more appropriate method in determining sarcopenia in Korean population.
This study has several limitations. First, because this is a cross-sectional design, exact cause and effect relationships could not be confirmed. Second, subjects aged over 60 were relatively smaller than middle-aged participants which could have resulted in selection bias. However, we additionally analyzed the age subgroups to overcome age variance of participants. Third, skeletal muscle mass of the present study was measured by BIA. However, dual-energy x-ray absorptiometry (DEXA) is a well-validated technique for the analysis of body composition at the molecular level.[43] Still, recent studies showed that BIA was well correlated with the DEXA method.[44,45] Moreover, the BIA can be usefully applied for health screening a large population due to its simple and rapid method with no need for specialized radiologist and radiation exposure. Furthermore, we could not directly quantify respiratory skeletal muscle mass, and instead used skeletal muscle mass of the whole body. Because recent studies demonstrated that respiratory skeletal muscles have the same sarcopenic processes as other skeletal muscles,[46–48] these results suggest that measuring whole body skeletal muscle mass could indirectly represent respiratory skeletal muscle mass. Lastly, other parameters for lung function such as diffusion capacity, inspiratory and expiratory pressure were not included in this study because PFT was performed only for health screening purposes for the participants with no clinically apparent lung disease.
In conclusion, the present study showed that decreased skeletal muscle mass was independently associated with low levels of PFT parameters such as FVC%, FEV1%, and PEF% in a large population of Korean adults without clinically ostensible lung disease. For the first time, our results indicated the clinical significance of low skeletal muscle mass as a potential risk for pulmonary dysfunction in all age groups and in men and women.
Author contributions
Conceptualization: Chul-Hyun Park, Youbin Yi, Yong-Taek Lee, Kyung Jae Yoon.
Data curation: Chul-Hyun Park, Youbin Yi, Jong Geol Do, Yong-Taek Lee, Kyung Jae Yoon.
Formal analysis: Chul-Hyun Park, Youbin Yi, Jong Geol Do, Yong-Taek Lee, Kyung Jae Yoon.
Methodology: Chul-Hyun Park, Jong Geol Do, Yong-Taek Lee.
Project administration: Chul-Hyun Park.
Supervision: Yong-Taek Lee, Kyung Jae Yoon.
Writing – original draft: Chul-Hyun Park.
Writing – review & editing: Chul-Hyun Park, Yong-Taek Lee, Kyung Jae Yoon.
Footnotes
Abbreviations: ALT = alanine aminotransferase, BIA = bioelectric impedance analyzer, CIs = confidence intervals, COPD = chronic obstructive pulmonary disease, DEXA = dual-energy x-ray absorptiometry, FEV1 = forced expiratory volume in the first second, FVC = forced vital capacity, HbA1c = glycated hemoglobin, HDL-C = high-density lipoprotein cholesterol, HOMA-IR = homeostasis model assessment of insulin resistance, hSMI = height-adjusted SMI, IPAQ-SF = International Physical Activity Questionnaire Short Form, LDL-C = low-density lipoprotein cholesterol, ORs = odds ratios, PEF = peak expiratory flow, PFT = pulmonary function test, SMI = skeletal muscle mass index, wSMI = weight-adjusted SMI.
Two corresponding authors have equally contributed to this work.
This research was supported by grant from Minister of Education (NRF-2017R1D1A1B03032899).
The authors have no conflicts of interest to disclose.
References
- [1].Evans WJ, Campbell WW. Sarcopenia and age-related changes in body composition and functional capacity. J Nutr 1993;123:465–8. [DOI] [PubMed] [Google Scholar]
- [2].Fielding RA, Vellas B, Evans WJ, et al. Sarcopenia: an undiagnosed condition in older adults. Current consensus definition: prevalence, etiology, and consequences. International working group on sarcopenia. J Am Med Dir Assoc 2011;12:249–56. [DOI] [PMC free article] [PubMed] [Google Scholar]
- [3].Hyun YY, Lee KB, Rhee EJ, et al. Chronic kidney disease and high eGFR according to body composition phenotype in adults with normal BMI. Nutr Metab Cardiovasc Dis 2016;26:1088–95. [DOI] [PubMed] [Google Scholar]
- [4].Wang T, Feng X, Zhou J, et al. Type 2 diabetes mellitus is associated with increased risks of sarcopenia and pre-sarcopenia in Chinese elderly. Sci Rep 2016;6:38937. [DOI] [PMC free article] [PubMed] [Google Scholar]
- [5].Walston JD. Sarcopenia in older adults. Curr Opin Rheumatol 2012;24:623–7. [DOI] [PMC free article] [PubMed] [Google Scholar]
- [6].Dogan SC, Hizmetli S, Hayta E, et al. Sarcopenia in women with rheumatoid arthritis. Eur J Rheumatol 2015;2:57–61. [DOI] [PMC free article] [PubMed] [Google Scholar]
- [7].Costa TM, Costa FM, Moreira CA, et al. Sarcopenia in COPD: relationship with COPD severity and prognosis. J Bras Pneumol 2015;41:415–21. [DOI] [PMC free article] [PubMed] [Google Scholar]
- [8].Jones SE, Maddocks M, Kon SS, et al. Sarcopenia in COPD: prevalence, clinical correlates and response to pulmonary rehabilitation. Thorax 2015;70:213–8. [DOI] [PubMed] [Google Scholar]
- [9].Durante A, Rodigheri A, Franco CW, et al. Inspiratory muscle training improves respiratory muscle strength and the peak expiratory flow in hypertensive elderly women. ConScientiae Saúde 2014;13:364–71. [Google Scholar]
- [10].Pedersen OF. The Peak Flow Working Group: physiological determinants of peak expiratory flow. Eur Respir J Suppl 1997;24:11S–6S. [PubMed] [Google Scholar]
- [11].Bahat G, Tufan A, Ozkaya H, et al. Relation between hand grip strength, respiratory muscle strength and spirometric measures in male nursing home residents. Aging Male 2014;17:136–40. [DOI] [PubMed] [Google Scholar]
- [12].Corrao G, Bagnardi V, Zambon A, et al. A meta-analysis of alcohol consumption and the risk of 15 diseases. Prev Med 2004;38:613–9. [DOI] [PubMed] [Google Scholar]
- [13].Oh JY, Yang YJ, Kim BS, et al. Validity and reliability of Korean version of International Physical Activity Questionnaire (IPAQ) short form. J Korean Acad Fam Med 2007;28:532–41. [Google Scholar]
- [14].Hagströmer M, Oja P, Sjöström M. The International Physical Activity Questionnaire (IPAQ): a study of concurrent and construct validity. Public Health Nutr 2006;9:755–62. [DOI] [PubMed] [Google Scholar]
- [15].The Korean Nutrition Society. Food Value: Nutrient Composition Table for Foods. Seoul: The Korean Nutrition Society; 2006. [Google Scholar]
- [16].Ahn Y, Kwon E, Shim JE, et al. Validation and reproducibility of food frequency questionnaire for Korean genome epidemiologic study. Eur J Clin Nutr 2007;61:1435–41. [DOI] [PubMed] [Google Scholar]
- [17].Matthews DR, Hosker JP, Rudenski AS, et al. Homeostasis model assessment: insulin resistance and beta-cell function from fasting plasma glucose and insulin concentrations in man. Diabetologia 1985;28:412–9. [DOI] [PubMed] [Google Scholar]
- [18].Malavolti M, Mussi C, Poli M, et al. Cross-calibration of eight-polar bioelectrical impedance analysis versus dual-energy X-ray absorptiometry for the assessment of total and appendicular body composition in healthy subjects aged 21–82 years. Ann Hum Biol 2003;30:380–91. [DOI] [PubMed] [Google Scholar]
- [19].Janssen I, Heymsfield SB, Ross R. Low relative skeletal muscle mass (sarcopenia) in older persons is associated with functional impairment and physical disability. J Am Geriatr Soc 2002;50:889–96. [DOI] [PubMed] [Google Scholar]
- [20].American Thoracic Society. Standardization of spirometry. Am J Crit Care Med 1995;152:1107–36. [DOI] [PubMed] [Google Scholar]
- [21].Choi JK, Paek D, Lee JO. Normal predictive values of spirometry in Korean population. Tuberc Respir Dis 2005;58:230–42. [Google Scholar]
- [22].Kim YS, Ahn AR, Kim SK, et al. Peak expiratory flow in normal healthy Korean subjects measured by mini-wright peak flow meter. Tuberc Respir Dis 2001;50:320–33. [Google Scholar]
- [23].Miller MR, Hankinson J, Brusasco V, et al. Standardisation of spirometry. Eur Respir J 2005;26:319–38. [DOI] [PubMed] [Google Scholar]
- [24].Moon JH, Kong MH, Kim HJ. Implication of sarcopenia and sarcopenic obesity on lung function in healthy elderly: using Korean National Health and Nutrition Examination Survey. J Korean Med Sci 2015;30:1682–8. [DOI] [PMC free article] [PubMed] [Google Scholar]
- [25].Byun MK, Cho EN, Chang J, et al. Sarcopenia correlates with systemic inflammation in COPD. Int J Chron Obstruct Pulmon Dis 2017;12:669–75. [DOI] [PMC free article] [PubMed] [Google Scholar]
- [26].Bano G, Trevisan C, Carraro S, et al. Inflammation and sarcopenia: a systematic review and meta-analysis. Maturitas 2017;96:10–5. [DOI] [PubMed] [Google Scholar]
- [27].Quanjer PH, Lebowitz MD, Gregg I, et al. Peak expiratory flow: conclusions and recommendations of a Working Party of the European Respiratory Society. Eur Respir J Suppl 1997;24:2S–8S. [PubMed] [Google Scholar]
- [28].Sly PD, Collins RA, Morgan WJ. Taussig LM, Landau LI, Le Souëf PN, Martinez FD, Morgan WJ, Sly PD. Lung function in cooperative subjects. Pediatric Respiratory Medicine 2nd ed.Philadelphia, PA: Mosby/Elsevier; 2008;171–178. [Google Scholar]
- [29].Kim J, Sapienza CM. Implications of expiratory muscle strength training for rehabilitation of the elderly: Tutorial. J Rehabil Res Dev 2005;42:211–24. [DOI] [PubMed] [Google Scholar]
- [30].Baker SE. Expiratory Muscle Strength Training and Detraining: Effects on Speech and Cough Production. Gainesville, FL: University of Florida; 2003. [Google Scholar]
- [31].National Asthma Education and Prevention Program. Expert Panel Report 3 (EPR-3): Guidelines for the Diagnosis and Management of Asthma-Summary Report 2007. J Allergy Clin Immunol 2007;120:S94–138. [DOI] [PubMed] [Google Scholar]
- [32].Fanò G, Mecocci P, Vecchiet J, et al. Age and sex influence on oxidative damage and functional status in human skeletal muscle. J Muscle Res Cell Motil 2001;22:345–51. [DOI] [PubMed] [Google Scholar]
- [33].Fulle S, Belia S, Di Tano G. Sarcopenia is more than a muscular deficit. Arch Ital Biol 2005;143:229–34. [PubMed] [Google Scholar]
- [34].Ryu M, Jo J, Lee Y, et al. Association of physical activity with sarcopenia and sarcopenic obesity in community-dwelling older adults: the Fourth Korea National Health and Nutrition Examination Survey. Age Ageing 2013;42:734–40. [DOI] [PubMed] [Google Scholar]
- [35].Moorthi RN, Avin KG. Clinical relevance of sarcopenia in chronic kidney disease. Curr Opin Nephrol Hypertens 2017;26:219–28. [DOI] [PMC free article] [PubMed] [Google Scholar]
- [36].Ponziani FR, Gasbarrini A. Sarcopenia in patients with advanced liver disease. Curr Protein Pept Sci 2018;19:681–91. [DOI] [PubMed] [Google Scholar]
- [37].Mehta V, Desai N, Patel S. When pulmonary function test is available, should we wait for the COPD symptoms to develop? J Clin Diagn Res 2016;10:OE08–12. [DOI] [PMC free article] [PubMed] [Google Scholar]
- [38].Mannino DM, Ford ES, Redd SC. Obstructive and restrictive lung disease and functional limitation: data from the Third National Health and Nutrition Examination. J Intern Med 2003;254:540–7. [DOI] [PubMed] [Google Scholar]
- [39].Kim YS, Lee Y, Chung YS, et al. Prevalence of sarcopenia and sarcopenic obesity in the Korean population based on the Fourth Korean National Health and Nutritional Examination Surveys. J Gerontol A Biol Sci Med Sci 2012;67:1107–13. [DOI] [PubMed] [Google Scholar]
- [40].Moon JJ, Park SG, Ryu SM, et al. New skeletal muscle mass index in diagnosis of sarcopenia. J Bone Metab 2018;25:15–21. [DOI] [PMC free article] [PubMed] [Google Scholar]
- [41].Wen X, Wang M, Jiang CM, et al. Are current definitions of sarcopenia applicable for older Chinese adults? J Nutr Health Aging 2011;15:847–51. [DOI] [PubMed] [Google Scholar]
- [42].Lim S, Kim JH, Yoon JW, et al. Sarcopenic obesity: prevalence and association with metabolic syndrome in the Korean Longitudinal Study on Health and Aging (KLoSHA). Diabetes Care 2010;33:1652–4. [DOI] [PMC free article] [PubMed] [Google Scholar]
- [43].Bazzocchi A, Diano D, Ponti F, et al. Health and ageing: a cross-sectional study of body composition. Clin Nutr 2013;32:569–78. [DOI] [PubMed] [Google Scholar]
- [44].Donini LM, Poggiogalle E, Del Balzo V, et al. How to estimate fat mass in overweight and obese subjects. Int J Endocrinol 2013;2013:285680. [DOI] [PMC free article] [PubMed] [Google Scholar]
- [45].Dicembrini I, Pala L, Cresci B, et al. Predictors of weight loss in the clinical management of obese patients: the relevance of body composition. Obes Metab 2010;6:29–33. [Google Scholar]
- [46].Greising SM, Mantilla CB, Gorman BA, et al. Diaphragm muscle sarcopenia in aging mice. Exp Gerontol 2013;48:881–7. [DOI] [PMC free article] [PubMed] [Google Scholar]
- [47].Simões LA, Dias JM, Marinho KC, et al. Relationship between functional capacity assessed by walking test and respiratory and lower limb muscle function in community-dwelling elders. Rev Bras Fisioter 2010;14:24–30. [PubMed] [Google Scholar]
- [48].Janssens JP, Pache JC, Nicod LP. Physiological changes in respiratory function associated with ageing. Eur Respir J 1999;13:197–205. [DOI] [PubMed] [Google Scholar]