Abstract
The diagnosis of dilated cardiomyopathy (DCM) remains a challenge in clinical radiology. This study aimed to investigate whether texture analysis (TA) parameters on magnetic resonance T1 mapping can be helpful for the diagnosis of DCM.
A total of 50 DCM cases were retrospectively screened and 24 healthy controls were prospectively recruited between March 2015 and July 2017. T1 maps were acquired using the Modified Look-Locker Inversion Recovery (MOLLI) sequence at a 3.0 T MR scanner. The endocardium and epicardium were drawn on the short-axis slices of the T1 maps by an experienced radiologist. Twelve histogram parameters and 5 gray-level co-occurrence matrix (GLCM) features were extracted during the TA. Differences in texture features between DCM patients and healthy controls were evaluated by t test. Support vector machine (SVM) was used to calculate the diagnostic accuracy of those texture parameters.
Most histogram features were higher in the DCM group when compared to healthy controls, and 9 of these had significant differences between the DCM group and healthy controls. In terms of GLCM features, energy, correlation, and homogeneity were higher in the DCM group, when compared with healthy controls. In addition, entropy and contrast were lower in the DCM group. Moreover, entropy, contrast, and homogeneity had significant differences between these 2 groups. The diagnostic accuracy when using the SVM classifier with all these histogram and GLCM features was 0.85 ± 0.07.
A computer-based TA and machine learning approach of T1 mapping can provide an objective tool for the diagnosis of DCM.
Keywords: cardiovascular magnetic resonance (CMR), dilated Cardiomyopathy (DCM), support vector machine (SVM), T1 mapping, texture analysis (TA)
1. Introduction
Dilated cardiomyopathy (DCM) is a very common type of primary cardiomyopathy, which manifests as left ventricle and (or) right ventricular enlargement and contraction dysfunction, with or without heart failure. The pathology mainly follows the myocardial cell degeneration, hypertrophy and interstitial fibrosis in the whole heart. Furthermore, this disease is progressive, and can cause death at any stage of the disease.[1] The prevalence for DCM in the common population remains unknown. In the adult population, men are more affected than women.[2] Furthermore, there are no diagnostic criteria for DCM, other than 1 of that excludes the other disease states. The early diagnosis of DCM is crucial. Myocardial fibrosis (MF) leads to increased stiffness of the myocardium, which is also associated with heart failure.[3] Histological results have shown that diffuse MF is common in DCM. Recent studies have found that MF can predict DCM.[4] Traditionally, late gadolinium enhancement (LGE) has been considered as the evaluation criterion for fibrosis.[5] Recent studies have shown that T1-mapping techniques provide new insight into the quantification of fibrosis, which may be superior to LGE techniques.[6,7]
1.1. Potential of texture analysis (TA) in DCM
Texture is a certain visual feature that represents image patterns, which may reflect roughness and regularity. In medical images, the frequency of random patterns is higher than that of regular patterns, which is hard for human observation. Texture features can reflect the intensity distribution and frequency domain characteristics of images that are beyond the examination of a human eye.[8] In addition, texture can be quantified using different algorithms.[9] To date, the TA of cardiovascular magnetic resonance (CMR) T1 mapping has not been reported. The value of T1 mapping in the diagnosis of diffuse MF in DCM has been recognized. Through the TA of T1 mapping, more subtle characteristics could be shown, especially those beyond the human visual system. The objective of the present study was to determine the diagnostic value of TA in T1 maps for DCM.
1.2. Potential of machine learning in DCM
Support vector machine (SVM) is a mature and effective algorithm in machine learning. This makes SVM an objective tool to complement the present clinical diagnosis of DCM.
The early diagnosis of DCM remains challenging. T1-mapping techniques provide a new method for quantifying myocardial fibrosis, which may be better than LGE techniques. The present results revealed that through the TA of T1 mapping, more subtle characteristics can be identified. The TA of T1 mapping may be helpful for the diagnosis of DCM.
2. Methods
The study was approved by the Ethics Committee. All written informed consents were signed by the study subjects or their legal authorized representatives. The flow chart for the present study is illustrated in Figure 1. First, a region of interest (ROI) from the original T1-mapping was defined by 1 co-author, who was blinded to the study at this stage. Then, TA was performed to obtain the histogram and gray-level co-occurrence matrix (GLCM) parameters. Finally, The SVM classifier was used to determine whether these texture parameters can be helpful in differentiating patients from controls. The sensitivity, specificity, false positive rate and false negative rates were calculated.
Figure 1.
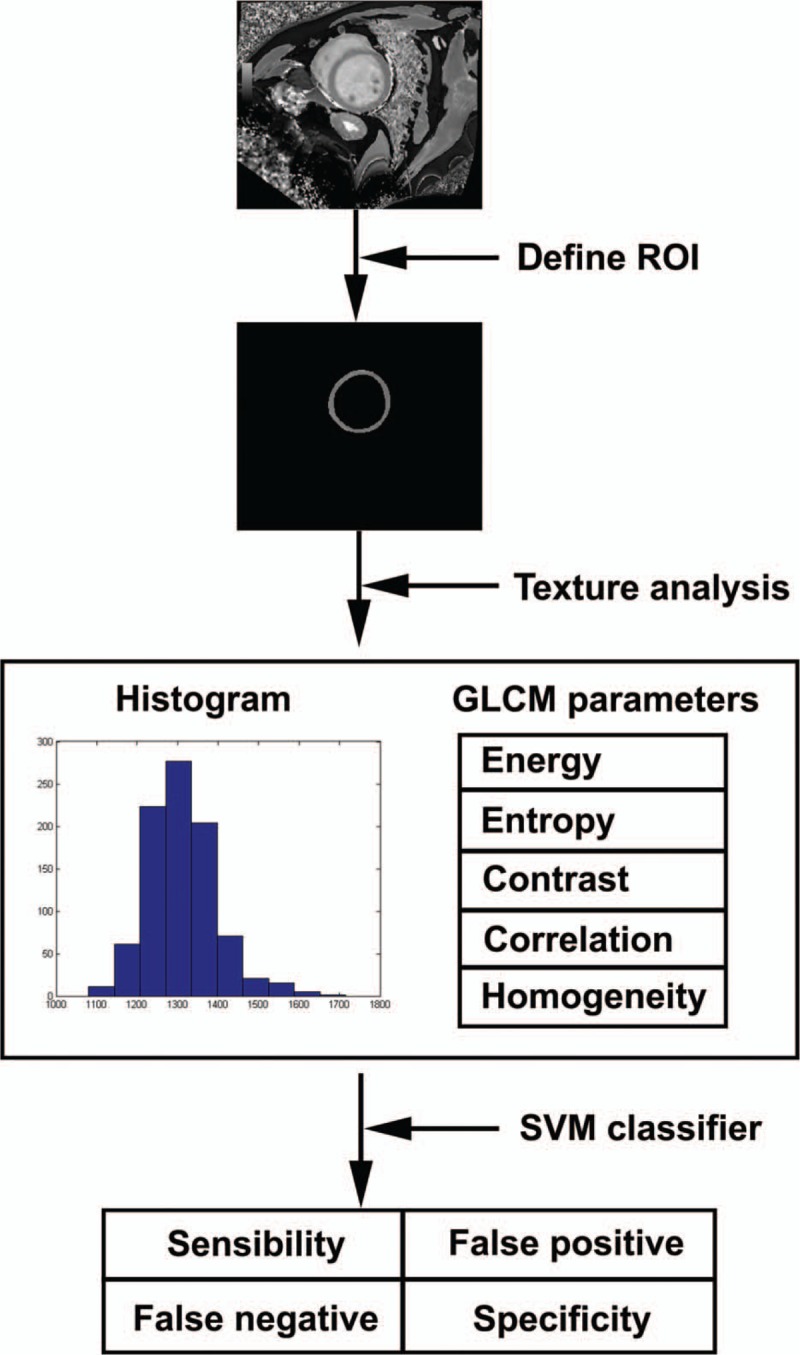
Schematic diagram of this study.
2.1. Study subjects
A total of 74 subjects were included in the study. Among these subjects, 50 DCM patients (mean age: 47.56 ± 13.57 years old; 40 males and 10 females) were retrospectively recruited and 24 healthy controls (mean age: 47.67 ± 13.15 years old; 14 males and 10 females) were prospectively recruited between March 2015 and July 2017. The diagnosis of DCM was based on the clinical examination, blood analysis and echocardiography of patients, who presented with symptoms of heart failure. The inclusion criteria were as follows:
(i) the calculated left ventricular end diastolic diameter to the body surface area was >2.7 cm/m2,
(ii) the left ventricular ejection fraction was < 45%, or
(iii) the left ventricular shortening rate was < 25%.
The exclusion criteria were as follows: hypertension, coronary heart disease, valvular disease, congenital heart disease, systemic diseases, and pulmonary heart disease. CMR data were collected from those patients for further evaluation before the study. Furthermore, 24 healthy controls without systemic illness or history of cardiovascular problems underwent 12-lead electrocardiogram (ECG), echocardiography and CMR. All these examinations revealed no abnormalities.
2.2. Magnetic resonance (MR) protocol
The CMR scans were performed on a 3.0 Tesla scanner (Siemens, Skyra, Erlangen, Germany) with a 16-channel cardiac receiver coil. Four magnetic compatibility electrodes were placed on the patients’ chest to obtain the ECG trigger. T1 mapping was collected using pre-Gadopentetate Dimeglumine (Gd-DTPA) contrast. The cine images of 3 long-axis and short-axis views (8–11 slices, depending on the size of the heart) were acquired. A MOLLI sequence (TR = 324.96 ms, TE = 1.12 ms, Flip angle = 35°, type 5 [3] 3) was used during breath-hold at 3 short axis views near the base, middle and apex, respectively. All T1 maps were used for TA. The principle and accuracy of the MOLLI sequence were reported in the studies conducted by Neville D. Gai and Peter Kellman.[10,11]
2.3. Texture feature analysis
Based on the different methods of evaluating the relationship between pixels, there are 4 main categories of TA methods: model, structure, transformation, and statistics. For medical image processing, there are mainly 6 kinds of texture features: histogram (statistical class), co-occurrence matrix (statistical class), absolute gradient (statistical class), run-length matrix (statistical class), auto-regressive model (model class), and wavelets (transform class).[12] Histogram reflects the frequency of a voxels’ gray level in the image. The histogram is 1 of the most commonly used texture parameters. Many features including mean, variance, mode, and percentiles can be obtained from the histogram analysis. Since only T1 relaxation time can be measured from T1 mapping, the investigators aimed to search for other parameters that can reflect the statistical features of T1 mapping by TA. Those parameters may have a potential to provide more information to diagnose DCM.
A histogram analysis included the following features: mean standard deviation (SD), minimum, maximum, the 10th, 25th, 50th, 75th and, 90th percentiles, mode, skewness, and kurtosis. The analysis was performed by using our in-house software under the MATLAB R2011b environment (MathWorks, Natick, MA). The calculation formula of the parameters was based on the study conducted by Choi, M. H.[13]
GLCM is a commonly used method to describe texture by studying the spatial correlation characteristics of gray scale. The gray level histogram is the result of the statistics of a pixel on the image with a gray level, and the GLCM is the statistics of 2 pixels with a certain distance to maintain a certain gray level.[14] Five kinds of GLCM features were calculated: energy, entropy, contrast, correlation, and homogeneity. The calculation formula for those features was referred to the studies conducted by Robert M [15] and Chaddad A.[16] Energy is the sum of squares of each matrix element in the GLCM. Energy reflects the distribution uniformity and texture smoothness of an image. Entropy reflects the degree of the system chaotic. Contrast directly reflects the contrast of luminance between a pixel value and nearby pixels. Correlation reflects the consistency of the image texture. Homogeneity reflects the homogeneity of the image texture to measure the local change of the image.
2.4. SVM classifier
SVM, as a mature and effective learning model in machine learning, was used to identify the classification accuracy of the histogram and GLCM features. SVM was performed by using the toolbox of MATLAB R2011b (MathWorks, Natick, MA). Among the total subjects, 35 DCM patients and 17 healthy controls were randomly chosen by the program as the training set for the SVM classifier. The trained classifier classified the other 15 DCM patients and 7 healthy controls.
2.5. Statistical analysis
Statistical analysis was performed by using SPSS (V22; SPSS, Chicago, IL). The texture features derived from the T1 mapping of the heart were compared between DCM patients and healthy controls. Student t tests were performed. A P-value < .01 was considered statistically significant when comparing between DCM and healthy controls. Bonferroni correction was used to correct multiple comparisons. The accuracy of the SVM classifier was calculated using the SVM tool-box of MATLAB R2011b (MathWorks, Natick, MA). Furthermore, 35 patients and 17 controls were randomly selected as the training set. Since the training set and test set were randomly selected, the accuracies may change with the different combinations of subjects in these sets. The program was run for 100 times, and the average accuracy was considered as the overall accuracy.
3. Results
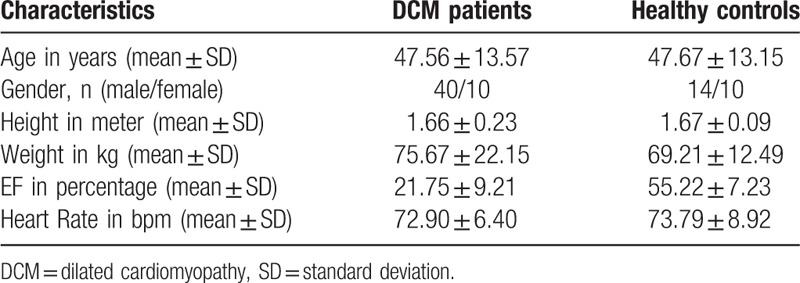
Seventy-four subjects were analyzed. Among these subjects, 50 DCM patients were retrospectively recruited and 24 healthy controls were prospectively recruited. The diagnosis of DCM was based on the clinical examination, blood analysis and echocardiography of patients who presented symptom of heart failure. Furthermore, 24 healthy controls without systemic disease or history of cardiovascular events underwent 12-lead ECG, echocardiography and CMR. All those examinations revealed no abnormalities. Table 1 shows the characteristics of DCM patients and healthy controls. There was no group difference in the subject demographics.
Table 1.
Characteristics of DCM patients and healthy controls.
3.1. TA: histogram features
Figure 2 shows the T1 mapping (A1) of a 46-year old male patient with the segmented myocardial (B1) and the T1 mapping of a 32-year old male healthy control (A2) with the segmented myocardial (B2). The histogram of the myocardial of DCM patients (blue) and healthy controls (orange) is presented in Figure 3.
Figure 2.
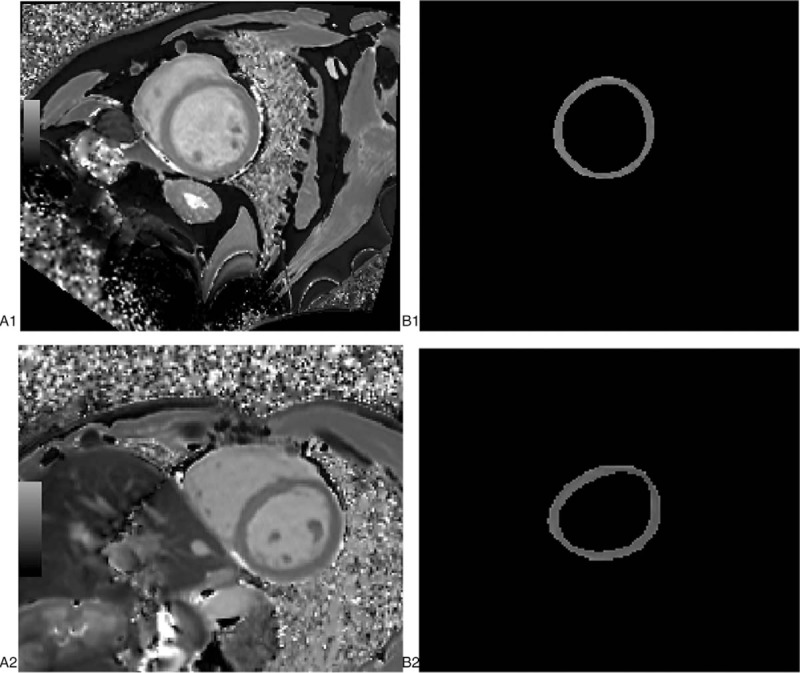
Example cases. DCM patient, M, 46Y A1 T1 mapping at middle level, B1 outline of myocardial Control, M, 32Y A2 T1 mapping at middle level, B2 outline of myocardial. DCM= = dilated cardiomyopathy.
Figure 3.
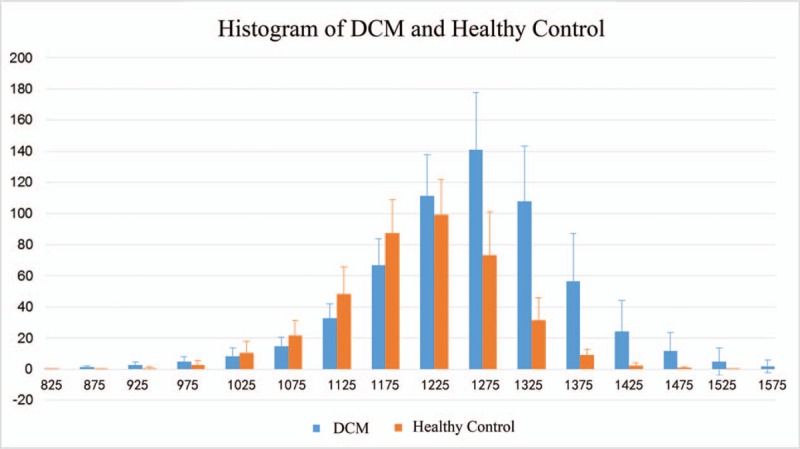
Histogram of myocardial of DCM patients (blue) and healthy control (orange). DCM = dilated cardiomyopathy.
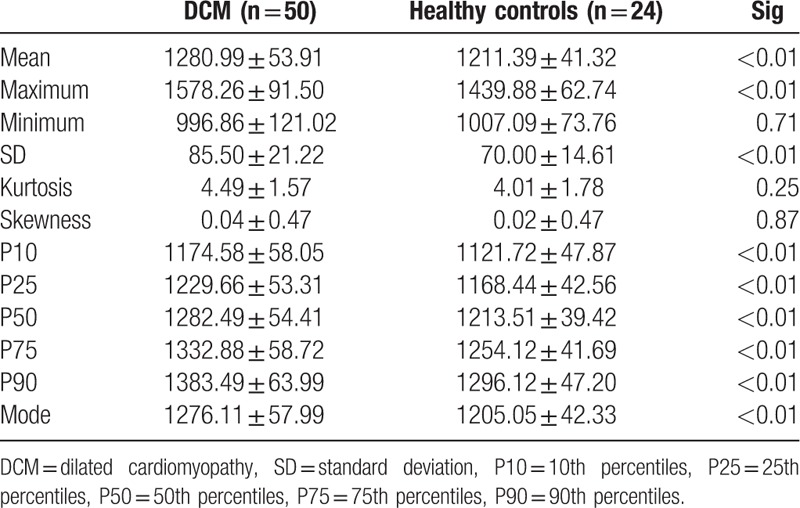
The histogram features derived from the T1 mapping obtained from DCM patients and healthy controls are shown in Table 2. In addition, the results of the independent-samples t test re-listed in Table 2. The minimum of the T1 value was lower in DCM patients, when compared with that of healthy controls. Furthermore, the other 11 features were apparently higher in the DCM group, when compared with that of healthy controls. Most of the histogram features, except for the minimum, kurtosis and skewness, had significant variations between DCM and healthy controls.
Table 2.
Histogram features of DCM patients and healthy controls.
3.2. TA: GLCM features
The GLCM features and results of the independent-samples t tests are presented in Table 3. Energy, correlatio, and homogeneity were higher in the DCM group when compared to healthy controls. Furthermore, entropy and contrast were lower in the DCM group. Entropy, contrast, and homogeneity had statistically significant differences between these 2 groups.
Table 3.
GLCM features of DCM and healthy controls.

3.3. Machine learning: SVM classifier
The test set, which included 15 DCM patients and 7 healthy controls, were randomly sorted out and classified using the SVM classifier. All 17 texture features were used as the training feature for the SVM classifier. The diagnostic efficacy of SVM has been tested for 100 times. The result was quite steady and the averaged value of those 100 tests is considered to be the final result. The accuracy was 0.85 ± 0.07. Table 4 shows the accuracy of the SVM classifier using all 17 texture features as the training feature.
Table 4.
Accuracy of SVM classifier using all texture features as training features.

4. Discussion
In the present study, TA and the machine learning approach were used to diagnose DCM. The present results demonstrated that most of the texture parameters, including histogram parameters and GLCM parameters, could significantly differentiate DCM patients from controls. In the present study, the diagnostic accuracy of DCM using the proposed texture parameters and SVM classifier could reach 0.85 ± 0.07. The present results suggest the clinical utility of the machine learning approach to DCM, which has never been reported before. This could have a significant impact in the future clinical diagnosis of DCM due to the high repeatability and efficiency of this computer-based method when compared with the traditional approach.
4.1. Advantage of the computer-based approach
Presently, the diagnosis of DCM mainly depends on clinical symptoms, such as ejection fraction (EF) decrease and ventricular enlargement. As a developing technique, CMR provides more useful information for DCM diagnosis. Cardiac cine sequences help to observe the movement of the myocardium, LGE indicates the localized FM, and T1 maps have the potential to reflect the biochemical changes of the myocardium. However, all those techniques are easily affected by the observer. Machine learning approach for DCM makes the result more objective.
4.2. Features of TA
Diffuse MF has been frequently discovered in the histology of DCM. Recent studies have found that MF can predict the prognosis of DCM.[4] The techniques for T1 mapping have rapidly been developed,[10,11,17–19] and the diagnostic value of T1 mapping for MF has been validated.[6,7,20–23] Image texture is a type of local characteristic of the image. The image texture feature of a pixel is correlated to the gray level of this pixel and pixels around it. The histogram and GCLM can be used as a measure of image texture. As medical images have a smooth texture, statistical features, such as histogram and GLCM features, were used as the main characters.
4.3. Histogram analysis
A histogram reflects the distribution of gray image levels, and can be used to evaluate the efficacy of the chemotherapy and tumor gradation.[13,24,25] Histogram parameters mainly reflect first-order information which mainly indicated the gray variation. Mean, SD, minimum, maximum, the 10th, 25th, 50th, 75th, and 90th percentiles, mode, skewness, and kurtosis, on behalf of the different features of histogram distribution, can be calculated. The present study shows that most of the histogram features have significant differences between the DCM group and healthy controls, except for minimum, skewness, and kurtosis. This demonstrates the clinical utility of the histogram analysis. Literature suggests that T1 value has a moderate correlation with the histological percentage of fibrosis.[26] Because MF commonly occurs in DCM, T1 value also increased in the DCM group. The present study shows that mean, SD, maximum, 5 percentiles and mode are significantly higher in the DCM group than in healthy controls. Mean reflects the average T1 value of the myocardium. Mean increases in DCM patients as MF occurs. Maximum and the 5 percentiles reflect the distribution of the T1 value. The T1 value is correlated to the degree of fibrosis.[23] The significant difference of the 10th percentiles and 25th percentiles between DCM and healthy controls may indicate that the histogram analysis has the potential of track mild fibrosis. SD reflects the degree of dispersion of a data set. Since the distribution of MF is irregular, SD increases in DCM patients. Mode is the most frequent value of a data set, which represents the general level of the data. Mode increases as T1 value increases. The increase of these 9 parameters may indicate the occurrence of MF.
4.4. GLCM analysis
GLCM is an effective method for analyzing the texture features of an image based on the second order combination of the conditional probability density function of the image.[27,28] GLCM parameters reflect the second-order information which shows the adjacency relationship between pixels and surrounding pixels. Direction, interval, and rangeability can be determined by calculating the correlation of separate gray levels. When the image is meticulous and uniform, energy is abundant. Otherwise, the energy is low. The higher the degree of chaos, the greater of the entropy value becomes. Contrast reflects the contrast of adjacent pixels. The greater the difference in texture pixels, the greater the contrast becomes. The correlation equals to 1 for a positively correlated image and −1 for a negatively correlated image. The correlation of a constant image is none. Homogeneity indicates the local change of the image. Homogeneity equals to 1 for a diagonal GLCM. In the present result, energy and correlation had no significant differences between DCM and controls. Entropy and contrast were obviously lower in the DCM group. Meanwhile, homogeneity was higher in the DCM group than in healthy controls. The main reason for this phenomenon is that MF was common and evenly distributed.[3] The location of MF is not typical, in which some were in the middle of the interventricular septum, and some were near the ventricular wall. The distribution of the area where the T1 value increased was dispersed. Another possible reason is that the myocardial wall of DCM was very thin, which may introduce errors in the calculation of GLCM. As the spatial resolution of magnetic resonance is not high enough, there are only 2 to 3 pixels at the thinnest place of the myocardial wall. The GLCM parameters depend on the relationship between adjacent pixels. The number of pixels is too small to make the GLCM parameters accurate.
4.5. Machine learning and SVM classifier
With the development of image processing technology, image analysis, and machine learning are applied more and more widely in medical image processing.[29–32] SVM has been used as the main and efficient classifier over years.[33,34] Recently, SVM has been used in medical image processing for computer-assisted diagnosis.[35–37] The present study shows that the accuracy of the SVM classifier could be 0.85 ± 0.07. This makes SVM an objective tool to complement the present clinical diagnosis of DCM. To date, there is no gold standard for the clinical diagnosis of DCM. The only way to diagnose DCM is to exclude other potential reasons based on all medical evidence. The availability of an objective and complementary tool could significantly boost the confidence of clinicians.
4.6. Limitations and future work
One limitation of the present study was that the T1 mapping after contrast agent injection was not analyzed. T1 value changes after the injection of contrast agent. Most of the healthy controls refused to be injected with a contrast agent. Hence, merely T1 mapping before contrast was analyzed. In addition, the sample size was small, especially for healthy controls. DCM patients have different symptoms at different stages. The factor of disease staging was not considered in the present study. More studies should be performed to convert these findings into clinical use.
5. Conclusion
In summary, the technique of combining TA with the machine learning approach offers a novel, repeatable and automated approach for differentiating DCM patients from healthy controls. This approach could be used as an assisted screening tool in the clinical setting for the diagnosis of DCM.
Acknowledgments
Thanks for the support from our colleagues from MR department and cardiovascular medicine department who help us on MR scanning and clinical examination. Thanks to Shaoyu Wang, an engineer from SIEMENS, who provided technical support for MOLLI sequence. Thanks to Dexing Kong, a professor from Zhejiang University, who give constructive suggestions on Machine learning. Thanks to Yuan Hong, a PhD Student form Zhejiang University, who give proposal on programming.
Author contributions
XS contributed to the paper draft, texture feature parameter calculation, programming and statistical analysis; YS contributed to the cases collected and enter criterion; KX contributed to machine learning algorithm; YZ contributed to the assist DCM diagnosis; WZ contributed to the assist DCM diagnosis; ZK contributed to the article mentality guidance and paper revise; JC contributed to the article mentality guidance. All authors reviewed the results and approved the final version of the manuscript.
Conceptualization: Xiao-Ning Shao, Yong Zhang.
Data curation: Ying-Jie Sun, Wen-Bo Zhang.
Formal analysis: Wen-Bo Zhang, Yong Zhang.
Investigation: Xiao-Ning Shao, Ying-Jie Sun.
Methodology: Zhi-Feng Kou.
Project administration: Jing-Liang Cheng.
Resources: Yong Zhang, Jing-Liang Cheng.
Software: Xiao-Ning Shao, Kun-Tao Xiao.
Supervision: Jing-Liang Cheng.
Validation: Jing-Liang Cheng.
Visualization: Xiao-Ning Shao.
Writing – original draft: Xiao-Ning Shao.
Writing – review & editing: Xiao-Ning Shao.
Footnotes
Abbreviations: CMR = cardiovascular magnetic resonance, DCM = dilated cardiomyopathy, ECG = electrocardiogram, GLCM = gray-level co-occurrence matrix, LGE = late gadolinium enhancement, MF = myocardial fibrosis, MOLLI = modified look-locker inversion recovery, ROI = region of interest, SVM = support vector machine, TA = texture analysis.
The study was approved by the ethics committee of The First Affiliated Hospital of Zhengzhou University (Ethical approval number: 2015–16); all the subjects were informed and signed informed consent.
All the subjects were informed and signed informed consent.
All data generated or analyzed during this study are included in this article.
The authors declare that they have no competing interests.
The authors have no conflicts of interest to disclose.
References
- [1].Assomull RG, Prasad SK, Lyne J, et al. Cardiovascular magnetic resonance, fibrosis, and prognosis in dilated cardiomyopathy. J Am Coll Cardiol 2006;48:1977–85. [DOI] [PubMed] [Google Scholar]
- [2].Fairweather D, Cooper LT, Jr, Blauwet LA. Sex and gender differences in myocarditis and dilated cardiomyopathy. Curr Probl Cardiol 2013;38:7–46. [DOI] [PMC free article] [PubMed] [Google Scholar]
- [3].Choi EY, Choi BW, Kim SA, et al. Patterns of late gadolinium enhancement are associated with ventricular stiffness in patients with advanced non-ischaemic dilated cardiomyopathy. Eur J Heart Fail 2009;11:573–80. [DOI] [PubMed] [Google Scholar]
- [4].Lehrke S, Lossnitzer D, Schöb M, et al. Use of cardiovascular magnetic resonance for risk stratification in chronic heart failure: prognostic value of late gadolinium enhancement in patients with non-ischaemic dilated cardiomyopathy. Heart 2011;97:727–32. [DOI] [PubMed] [Google Scholar]
- [5].Ordovas KG, Higgins CB. Delayed contrast enhancement on MR images of myocardium: past, present, future. Radiology 2011;261:358–74. [DOI] [PubMed] [Google Scholar]
- [6].aus dem Siepen F, Buss SJ, Messroghli D, et al. T1 mapping in dilated cardiomyopathy with cardiac magnetic resonance: quantification of diffuse myocardial fibrosis and comparison with endomyocardial biopsy. Eur Heart J Cardiovasc Imaging 2015;16:210–6. [DOI] [PubMed] [Google Scholar]
- [7].Aus dem Siepen F, Seitz SA, Giannitsis E, et al. Non-invasive measurement of myocardial extracellular volume using T1 mapping as a novel biomarker of diffuse fibrosis in dilated cardiomyopathy. J Cardiovasc Magn R 2013;15:1–2. [Google Scholar]
- [8].Kassner A, Thornhill RE. Texture analysis: a review of neurologic MR imaging applications. AJNR Am J Neuroradiol 2010;31:809–16. [DOI] [PMC free article] [PubMed] [Google Scholar]
- [9].Holli KK, Harrison L, Dastidar P, et al. Texture analysis of MR images of patients with Mild Traumatic Brain Injury. BMC Med Imaging 2010;10:8. [DOI] [PMC free article] [PubMed] [Google Scholar]
- [10].Gai ND, Stehning C, Nacif M, et al. Modified look-locker T1 evaluation using Bloch simulations: human and phantom validation. Magn Reson Med 2013;69:329–36. [DOI] [PMC free article] [PubMed] [Google Scholar]
- [11].Kellman P, Hansen MS. T1-mapping in the heart: accuracy and precision. J Cardiovasc Magn Reson 2014;16:2. [DOI] [PMC free article] [PubMed] [Google Scholar]
- [12].Castellano G, Bonilha L, Li LM, et al. Texture analysis of medical images. Clin radiol 2004;59:1061–9. [DOI] [PubMed] [Google Scholar]
- [13].Choi MH, Oh SN, Rha SE, et al. Diffusion-weighted imaging: apparent diffusion coefficient histogram analysis for detecting pathologic complete response to chemoradiotherapy in locally advanced rectal cancer. J Magn Reson Imaging 2016;44:212–20. [DOI] [PubMed] [Google Scholar]
- [14].Barry B, Buch K, Soto JA, et al. Quantifying liver fibrosis through the application of texture analysis to diffusion weighted imaging. Magn Reson Imaging 2014;32:84–90. [DOI] [PubMed] [Google Scholar]
- [15].Haralick RM, Shanmugam K, Dinstein I. Textural features for image classification. IEEE Trans Syst Man Cybern 1973;3:610–21. [Google Scholar]
- [16].Chaddad A, Tanougast C. Extracted magnetic resonance texture features discriminate between phenotypes and are associated with overall survival in glioblastoma multiforme patients. Med Biol Eng Comput 2016;54:1707–18. [DOI] [PubMed] [Google Scholar]
- [17].Salerno M, Kramer CM. Advances in parametric mapping with CMR imaging. JACC Cardiovasc Imaging 2013;6:806–22. [DOI] [PMC free article] [PubMed] [Google Scholar]
- [18].Piechnik SK, Ferreira VM, Dall’Armellina E, et al. Shortened modified look-locker inversion recovery (ShMOLLI) for clinical myocardial T1-mapping at 1.5 and 3 T within a 9 heartbeat breathhold. J Cardiovasc Magn Reson 2010;12:1–1. [DOI] [PMC free article] [PubMed] [Google Scholar]
- [19].Kellman P, Arai AE, Xue H. T1 and extracellular volume mapping in the heart: estimation of error maps and the influence of noise on precision. J Cardiovasc Magn Reson 2013;15:56. [DOI] [PMC free article] [PubMed] [Google Scholar]
- [20].Puntmann VO, Voigt T, Chen Z, et al. Native T1 mapping in differentiation of normal myocardium from diffuse disease in hypertrophic and dilated cardiomyopathy. JACC Cardiovasc Imaging 2013;6:475–84. [DOI] [PubMed] [Google Scholar]
- [21].Messroghli DR, Plein S, Higgins DM, et al. Human myocardium: single-breath-hold MR T1 mapping with high spatial resolution—reproducibility study. Radiology 2006;238:1004–12. [DOI] [PubMed] [Google Scholar]
- [22].Teraoka K, Suzuki Y, Komori Y. The study about the difference of extra cellular volume calculated with T1mapping in dilated cardiomyopathy with and without late gadolinium enhancement. J Cardiovasc Magn Reson 2015;17:1–2.25589308 [Google Scholar]
- [23].Kawel N, Nacif M, Zavodni A, et al. T1 mapping of the myocardium: intra-individual assessment of post-contrast T1 time evolution and extracellular volume fraction at 3T for Gd-DTPA and Gd-BOPTA. J Cardiovasc Magn Reson 2012;14:27. [DOI] [PMC free article] [PubMed] [Google Scholar]
- [24].Chandarana H, Rosenkrantz AB, Mussi TC, et al. Histogram analysis of whole-lesion enhancement in differentiating clear cell from papillary subtype of renal cell cancer. Radiology 2012;265:790–8. [DOI] [PubMed] [Google Scholar]
- [25].Skogen K, Schulz A, Dormagen JB, et al. Diagnostic performance of texture analysis on MRI in grading cerebral gliomas. Eur J Radiol 2016;85:824–9. [DOI] [PubMed] [Google Scholar]
- [26].Bull S, White SK, Piechnik SK, et al. Human non-contrast T1 values and correlation with histology in diffuse fibrosis. Heart 2013;99:932–7. [DOI] [PMC free article] [PubMed] [Google Scholar]
- [27].Yu H, Touret AS, Li B, et al. Application of texture analysis on parametric T1 and T2 maps for detection of hepatic fibrosis. J Magn Reson Imaging 2016;45:250–9. [DOI] [PubMed] [Google Scholar]
- [28].Joseph GB, Baum T, Carballido-Gamio J, et al. Texture analysis of cartilage T2 maps: individuals with risk factors for OA have higher and more heterogeneous knee cartilage MR T2 compared to normal controls—data from the osteoarthritis initiative. Arthritis Res Ther 2011;13:R153. [DOI] [PMC free article] [PubMed] [Google Scholar]
- [29].Gao Z, Li Y, Sun Y, et al. Motion tracking of the carotid artery wall from ultrasound image sequences: a nonlinear state-space approach. IEEE Trans Med Imaging 2018;37:273–83. [DOI] [PubMed] [Google Scholar]
- [30].Kong B, Wang X, Li Z, et al. Cancer metastasis detection via spatially structured deep network. Inf Process Med Imaging 2017;236–48. [Google Scholar]
- [31].Chen J, Zhang H, Zhang W, et al. Correlated regression feature learning for automated right ventricle segmentation. IEEE J Transl Eng Health Med 2018;6:99. [DOI] [PMC free article] [PubMed] [Google Scholar]
- [32].Kong B, Zhan Y, Shin M, et al. Recognizing end-diastole and end-systole frames via deep temporal regression network. Med Image Comput Comput Assist Interv 2016;264–72.28149964 [Google Scholar]
- [33].Solomonoff RJ. Machine Learning—Past and Future. The Dartmouth Artificial Intelligence Conference. Dartmouth, NH; July 13-15, 2006. [Google Scholar]
- [34].Wakankar AT, Suresh GR. Automatic diagnosis of breast cancer using thermographic color analysis and SVM classifier. Intell Syst Technol Appl 2016;530:21–32. [Google Scholar]
- [35].Parveen and Singh A. Detection of Brain Tumor in MRI Images, using combination of fuzzy c-means and SVM. Proceedings of the 2nd International Conference on Signal Processing and Integrated Networks (SPIN ’15), pp. 98–102, February 2015. [Google Scholar]
- [36].Keerthi SS, Shevade SK, Bhattacharyya C, et al. Improvements to Platt's SMO algorithm for SVM classifier design. Neural Comput 2001;13:637–49. [Google Scholar]
- [37].Li C, Huang R, Ding Z, et al. A level set method for image segmentation in the presence of intensity inhomogeneities with application to MRI. IEEE Trans Image Process 2011;20:2007–16. [DOI] [PMC free article] [PubMed] [Google Scholar]


