Supplemental Digital Content is available in the text
Keywords: acetate, fluoro-D-glucose, hepatoma, positron emission tomography/computed tomography, prognosis, transarterial chemoembolization
Abstract
The aim of the present study was to evaluate the clinical significance of dual radiotracer studies, 11C-acetate and 18F-fluoro-D-glucose positron emission tomography/computed tomography (18F-FDG PET/CT), for the prediction of response and recurrence after transarterial chemoembolization (TACE).
This study retrospectively included a total 42 hepatoceullar carcinoma (HCC) patients (median age, 59; range, 34–85 years old) who underwent 11C-acetate and 18F-FDG PET/CT concurrently. Tumor uptake normalized by liver uptake (TNR; maximum tumor SUV to mean normal liver SUV ratio) was obtained first. Then, FAratio, which is the ratio of 18F-FDG TNR (TNR_FDG) to 11C-acetate TNR, was obtained and correlated with response after TACE and recurrence-free survival (RFS), using a Cox multivariate proportional-hazard model.
Among clinical factors, including the Hepatoma Arterial Embolization Prognostic score and positron emission tomography (PET) parameters, multiple regression analysis revealed FAratio and tumor size to be the only significant factors. As a PET parameter, FAratio exhibited the largest area under the curve in the prediction of response after TACE. In the Cox multivariate proportional-hazard model, TNR_FDG was the only significant predictive factor for RFS. In subgroup analysis, TNR_FDG was the only significant predictive factor for recurrence in intermediate stage patients. However, FAratio was the only significant predictive factor for recurrence in advanced stage patients.
Dual radiotracer use of 11C-acetate and 18F-FDG PET/CT contributed to the prediction of response and recurrence after TACE. Used in addition to 18F-FDG, 11C-acetate PET/CT could give additional information in advanced stage patients. Based on the characteristics of tumor metabolism assessed by dual radiotracer PET/CT, treatment plans could be more personalized and optimized.
1. Introduction
Hepatocellular carcinoma (HCC) is the sixth leading cause of cancer-related deaths in men, and its incidence has been increasing in developed countries.[1] Curative resection of the tumor and liver transplantation are the treatments of choice in early stage HCC patients. However, most patients have intermediate to advanced stage HCC at diagnosis, and transarterial chemoembolization (TACE) is performed as the initial treatment in these patients.[2–4] TACE plays a significant role in the control of HCC by inducing ischemic necrosis due to arterial embolization and due to its chemotherapeutic effects, but recurrence is inevitable.[5,6]
The response and prognosis of hepatoma after TACE are variable. Recently, the hepatoma arterial-embolization prognostic score (HAP score) was introduced based on clinical variables, such as serum albumin level, bilirubin level, and tumor size.[7] Computed tomography (CT) imaging features, such as the completeness of lipiodol uptake by the tumor, are also considered,[8] but there are no reliable prognostic tools.
In addition to tumor phenotype and impairment of hepatic reserve, the metabolic features of hepatomas could predict the response to or prognosis after TACE, especially using imaging tools such as positron emission tomography/computed tomography (PET/CT).[9] 2-deoxy-2-18F-fluoro-D-glucose (18F-FDG) PET/CT is widely used for noninvasive cancer imaging. It is also widely used in the diagnosis of poorly differentiated HCC, extrahepatic metastasis, and prediction of recurrence after liver transplantation.[10–13] Based on these results, 18F-FDG PET/CT plays in significant role in the management of HCC. At the same time, 11C-acetate is useful in the detection of low grade HCC and the differentiation between HCC and benign lesions.[14,15]11C-acetate uptake is known to be related to acetyl coenzyme A (CoA) expression in well-differentiated HCC.[16] Therefore, 11C-acetate has the potential to play a complementary role to 18F-FDG PET/CT in the diagnosis of HCC.[17]
In the aspects of tumor metabolism and prognosis, 18F-FDG uptake is correlated with poorly differentiated HCC, and it is known to have aggressive characteristics.[9] Since 11C-acetate uptake is related to well-differentiated HCC and could be expected with less aggressiveness or a fair prognosis, there have been a lack of studies of prognosis after TACE regarding the aspect of 11C-acetate metabolism.
In our previous study, we performed 11C-acetate and 18F-FDG dual radiotracer PET/CT for the characterization of HCC.[14] Based on our previous work, we attempted to evaluate the role of 18F-FDG and 11C-acetate dual tracer PET/CT in the prediction of treatment response in HCC patients who underwent TACE. Second, we attempted to evaluate whether it could predict recurrence after TACE.
2. Materials and methods
2.1. Ethics statement
Institutional Review Board at National Cancer Center approved the study design and waived informed consent (NCC2017-0149).
2.2. Patients
Forty-two patients diagnosed with HCC between June 2006 and April 2007 were enrolled retrospectively. All of the patients were part of our previous prospective study: among them, patients who received TACE were selected.[14] All of the patients had newly diagnosed HCC and the diagnosis of HCC was based on the guidelines of the Korean Liver Cancer Study Group and National Cancer Center of Korea.[18] All of the patients underwent 18F-FDG, 11C-acetate PET/CT, and dynamic spiral CT before treatment. All tumors were pathologically confirmed 1 week before or after PET/CT by percutaneous core biopsies in the aid of ultrasonography. The inclusion criteria for the subjects were as follows: age between 18 and 80 years old; adequate liver function (Child–Pugh classification A or B); Eastern Cooperative Oncology Group performance status of 0 to 2; and adequate renal function (serum creatinine <1.4 mg/dL). The exclusion criteria for subjects were whether they had any other malignancy or distant metastasis.
2.3. Imaging studies
Synthesis of radiopharmaceutical and acquisition of PET/CT images were performed in the same manner as in our previous study.[14] In brief, 2 dedicated PET/CT scanners were used (Biograph LSO; Siemens Healthcare, Erlangen, Germanyand Discovery LS; GE Healthcare, Milwaukee, WI). Noncontrast CT images were acquired in the range of the skull base to upper thigh, and subsequent PET images were acquired 20 minutes after injection of 11C-acetate and 60 minutes after injection of 18F-FDG. Image acquisition was performed 4 minutes per bed in the 2-dimensional acquisition mode. 11C-acetate PET/CT and 18F-FDG PET/CT were performed on the same day: 11C-acetate PET/CT was performed first, and 18F-FDG PET/CT was performed at least 4 hours later, after >5 half-lives later. PET images were reconstructed using ordered-subset expectation maximization with 2 iterations and 8 subsets and with attenuation correction. The standardized uptake value (SUV) was calculated as (decay-corrected activity [kBq] per milliliter of tissue volume)/(injected 18F-FDG or 11C-acetate activity [kBq]/body mass [g]). The SUVs of lesions were obtained by manually placing of a volume of interest (VOI) around the lesion. PET/CT images were interpreted by 2 nuclear medicine physicians, who were unaware of the clinical information about these patients.
Acquisition of dynamic spiral CT imaging was performed using a multidetector CT scanner (Lightspeed pro-16, GE Healthcare) with contrast enhancement. Images were acquired in the noncontrast phase, hepatic artery phase (25 second after contrast injection), portal vein phase (70 second after contrast injection), and equilibrium phase (180 second after contrast injection). Final agreement of 2 experienced radiologists was used in the interpretation of the images.
2.4. TACE methodology
TACE was performed for the treatment of HCC according to National Cancer Center protocol.[19] Briefly, an arterial catheter was placed in the hepatic artery via the femoral artery by the Seldinger technique. Tumor feeding vessels were superselected—segmental arteries, subsegmental arteries, or lobar branches when possible—and infusion of solution containing 20 to 60 mg of doxorubicin hydrochloride (ADM; Dong-a Pharmacy, Seoul, South Korea) and 2 to 20 mL of iodized oil (Lipiodol; Guerbet, Aulnay-sous-Bois, France) was performed. The infusion was ended when the lipiodol mixture in the feeding arteries was in stasis as indicated by the appearance of iodized oil in the portal vein nearest the tumor. Subsequent embolization was performed using absorbable gelatin sponge particles (Gelfoam; Upjohn, MI).
2.5. Clinical features and image analysis
Clinical features, which show tumor phenotype, stage, and functional reserve, were collected, including serum albumin level, bilirubin level, and tumor size. For the assessment of prognosis after TACE, the modified Hepatoma Arterial Embolization Prognostic (mHAP) score was investigated.[20]
Tumor lipiodol uptake after TACE was evaluated by dynamic spiral CT as complete or partial, representing the technical success of TACE, and it is potentially correlated with response after TACE. PET/CT images were reviewed using a dedicated workstation (GE Healthcare). Intrahepatic primary lesions were interpreted visually by comparing data with tracer uptake by the normal liver parenchyma for 11C-acetate and 18F-FDG PET. The hypermetabolic lesion for each radiopharmaceutical was defined as positive in the diagnosis of the tumor, compared with normal liver uptake of each radiopharmaceutical.
For semiquantitive analysis, the tumor to normal liver ratio (TNR) was obtained. To evaluate tumor uptake, a VOI was placed to cover the highest activity of each tumor on CT images from PET/CT scans with the guidance of contrast-enhanced dynamic CT. The maximum SUV (SUVmax) of the tumor VOI was used for further analysis. To evaluate normal liver uptake, 3 1 cm3-sized VOIs were placed where the tumor was not detected, and the mean SUV (SUVmean) was obtained. Among 3 VOIs, the median of the SUVmeans of the normal liver VOIs was used. Then, TNR was obtained SUVmax of tumor normalized by selected SUVmean of normal liver in each radiotracer. Finally, the ratio of TNR in each radiotracer was obtained and was used for the analysis (FAratio; ratio of TNR_FDG [18F-FDG TNR] and TNR_Ace [11C-Acetate TNR]).
2.6. Endpoints
Patients’ data were obtained from electronic medical record review. First, response assessment after TACE was conducted 4 to 6 weeks after TACE by dynamic spiral CT, using the modified Response Evaluation Criteria in Solid Tumors (mRECIST).[21] Based on the mRECIST criteria, the patients were divided into a responder group (complete and partial remission) and a nonresponder group (stable disease and progressive disease). After complete remission, the patients were evaluated 3 months later with dynamic CT scans and alpha-fetoprotein (AFP). Response after TACE according to the clinical factors was primary endpoint.
Second, the recurrence-free survival (RFS) period was determined when recurrence was detected. Recurrence was defined as the appearance of a viable tumor in contact with or inside the treated area or the appearance of a new lesion. Evaluation of RFS according to TNR in each radiotracer and FAratio was secondary endpoint.
2.7. Statistical analysis
The data were analyzed using MedCalc software (version 17.5; Broekostraat, Mariakerke, Belgium). Quantitative values are expressed as the median and range. The chi-square test was performed for the comparison of clinicopathologic factors in the responder and non-responder groups. Student's t test and the Mann–Whitney U test were used for the evaluation of differences in TNR between the complete lipiodol uptake and partial lipiodol uptake groups. Receiver-operating-characteristic (ROC) curve analysis was performed for the prediction of response after TACE in each parameter and acquisition of optimal cutoffs. Multivariate analysis using logistic regression was performed for the prediction of response after TACE. RFS was evaluated by Kaplan–Meier survival analysis. For the comparison with optimal the cutoff, the log-rank test was performed. Using significant factors in the univariate analysis, Cox stepwise proportional hazard regression analysis was performed. P values <.05 were considered significant.
3. Results
3.1. Patient characteristics
Forty-two patients were included in the present study (34 men and 8 women). The ages of the patients ranged from 34 to 85 years old (median 59.0 year old). All of the patients had Child–Pugh classification A or B liver function (A: 36, B: 6 patients). According to the Barcelona Clinic Liver Cancer (BCLC) staging classification, 4 patients were very early stages, 3 patients were in early stages, 23 patients were in intermediate stages, and 12 patients were in advanced stages. Twenty-six patients showed a tumor size <5 cm, and 16 patients showed a tumor size >5 cm. Eighteen patients had a single lesion, and 24 patients had >2 lesions. Fifteen patients had HAP score A, 17 patients had HAP score B, 7 patients had HAP score C, and 3 patients had HAP score D.
3.2. Prediction of response after TACE
After TACE, patients with complete response numbered 9 (21.4%), those with partial response numbered 16 (38.1%), those with stable disease numbered 10 (23.8%), and those with progressive disease numbered 7 (16.7%). Clinical characteristics of the patients according to the objective response are summarized in Table 1. Among TNR_FDG, TNR_Ace, and FAratio, only TNR_FDG and FAratio were significant parameters between responders and nonresponders (Table 2). Comparison of TNR_FDG and TNR_Ace between responders and nonresponders was performed (Fig. 1). Using ROC curve analysis, the optimal cutoff of each parameter was determined. FAratio with a cutoff value of 1.67 exhibited the largest area under the curve (AUC). Representative cases are presented in Figs. 2 and 3.
Table 1.
Patients’ characteristics classified by response after TACE.
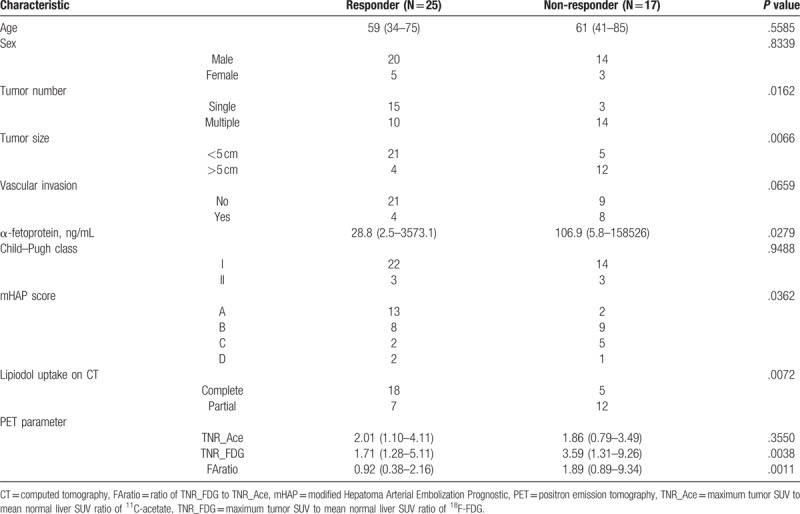
Table 2.
Receiver-operating characteristic curve analysis of PET parameters in predicting response after TACE.

Figure 1.
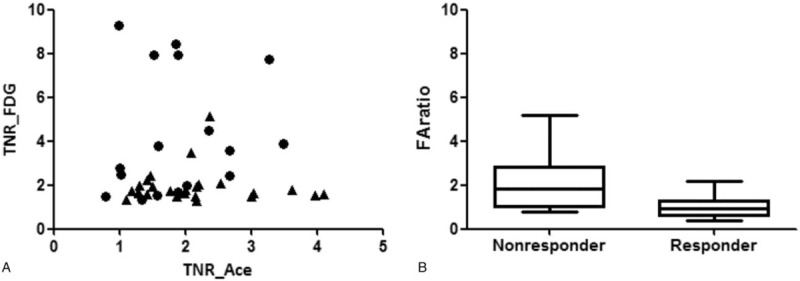
Values of TNR_FDG, TNR_Ace, FAratio in the patients, divided into responders and nonresponders after TACE. (A) Patients with high TNR_FDG and low TNR_Ace corresponded to the nonresponder group, and patients with low TNR_FDG and high TNR_Ace corresponded to the responder group. (B) Box plot of FAratio between the nonresponder and responder groups. Larger values of FAratio were observed in the nonresponder group compared with the responder group after TACE, with significant differences (P = .0006, Mann–Whitney U test). FAratio = ratio of TNR_FDG and TNR_Ace, TACE = transarterial chemoembolization, TNR_Ace = maximum tumor SUV to mean normal liver SUV ratio of 11C-acetate, TNR_FDG = maximum tumor SUV to mean normal liver SUV ratio of 18F-FDG.
Figure 2.
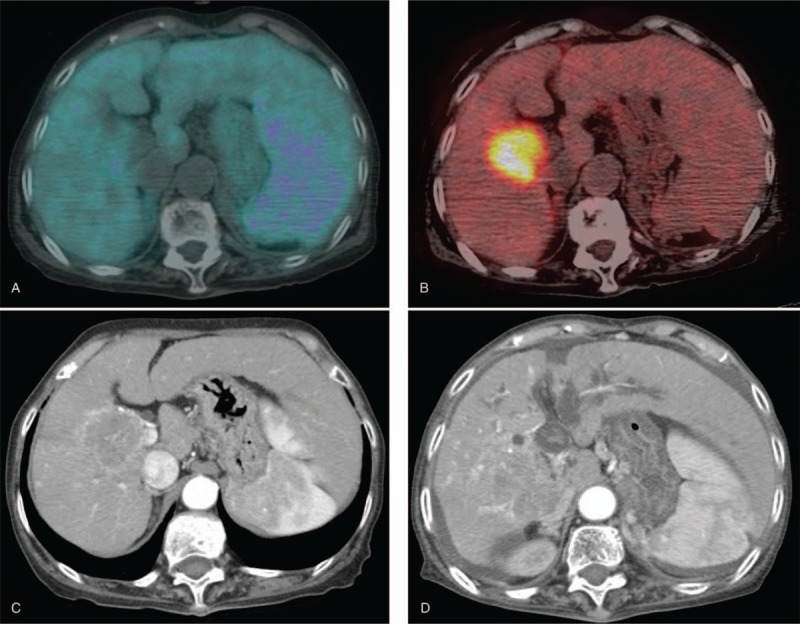
Eighty-four-year-old woman with right hepatic lobe mass. (A) Tumor did not exhibit definite 11C-acetate uptake (TNR_Ace: 0.99). (B) In contrast, high 18F-FDG uptake was shown (TNR_FDG: 6.73). FAratio was 6.80. (C) Initial arterial phase image of dynamic CT. (D) She was a nonresponder after TACE. Three months after TACE, the size of the tumor was increased, and right portal vein invasion was observed. CT = computed tomography, 18F-FDG = 18F-fluoro-D-glucose, FAratio = ratio of TNR_FDG and TNR_Ace, TACE = transarterial chemoembolization, TNR_Ace = maximum tumor SUV to mean normal liver SUV ratio of 11C-acetate, TNR_FDG = maximum tumor SUV to mean normal liver SUV ratio of 18F-FDG.
Figure 3.
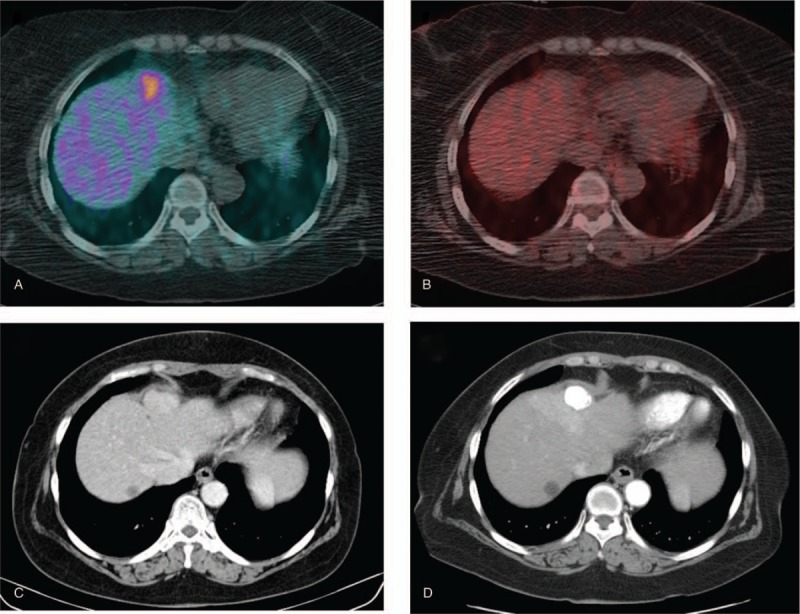
Seventy-year-old woman with a nodule in liver segment 4. (A) Tumor exhibited increased 11C-acetate uptake (TNR_Ace: 2.17). (B) In contrast, subtle 18F-FDG uptake was shown (TNR_FDG 1.92). (C) Initial arterial phase image of dynamic CT. (D) She was a responder after TACE. Three months after TACE, compact lipiodol retention was observed without an arterial enhancement lesion. A benign hepatic cyst is observed in liver segment 8. CT = computed tomography, 18F-FDG = 18F-fluoro-D-glucose, TACE = transarterial chemoembolization, TNR_Ace = maximum tumor SUV to mean normal liver SUV ratio of 11C-acetate, TNR_FDG = maximum tumor SUV to mean normal liver SUV ratio of 18F-FDG.
In univariate analysis, FAratio (cutoff, 1.67), number of tumors (single or multiple), vascular invasion (present or absent), tumor size (cutoff, 5 cm), lipiodol uptake (complete or incomplete), and mHAP score (A, B, or C) were significant factors. However, in multivariate analysis, FAratio and tumor size were significant factors in the prediction of response (Table 3).
Table 3.
Multivariate logistic regression for prediction of response after TACE.

3.3. Relationships between lipiodol uptake and metabolic features
11C-acetate and 18F-FDG uptake were compared according to lipiodol uptake. TNR_Ace was higher in the complete lipiodol uptake group than in the partial lipiodol uptake group, although statistical significance was not attained (P = .1808, Student t test), while TNR_FDG was significantly higher (P = .0022, Mann–Whitney U test) in the partial lipiodol uptake group than in the complete lipiodol uptake group (Fig. 4).
Figure 4.
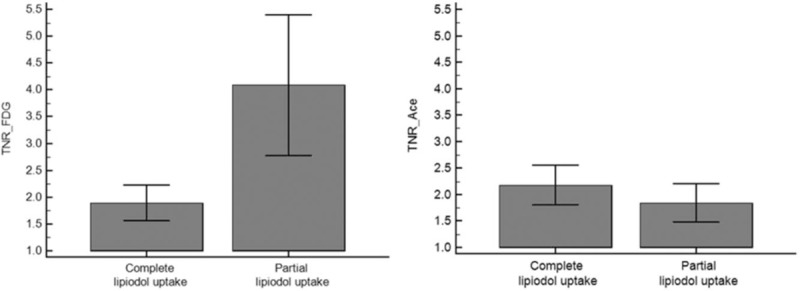
Comparison of TNR_FDG and TNR_ace in the complete lipiodol uptake and partial lipiodol uptake groups. (TNR_FDG: 1.89 ± 0.77 in the complete lipiodol uptake group, 4.09 ± 2.72 in the partial lipiodol uptake group, P = .0022; and TNR_Ace: 2.18 ± 0.88 in the complete lipiodol uptake group, 1.84 ± 0.75 in the partial lipiodol uptake group, P = .1885). TNR_Ace = maximum tumor SUV to mean normal liver SUV ratio of 11C-acetate, TNR_FDG = maximum tumor SUV to mean normal liver SUV ratio of 18F-FDG.
3.4. Predictors of recurrence after TACE
In the follow-up of patients after TACE (median, 30.1 months; range, 1.0–126.0 months), recurrence was observed in 36 patients (86%). The median value and range of RFS was 5.98 month (1.0–27.0 month). Visual analysis revealed significant differences in RFS (Fig. 5, Kaplan–Meier analysis, P = .0217) among 18F-FDG positive 11C-acetate positive, 18F-FDG positive 11C-acetate negative, 18F-FDG negative 11C-acetate positive, and 18F-FDG negative and 11C-Acetate negative patients (see Table S1, Supplemental Content, which demonstrates number of patients in each group). In univariate analysis, BCLC stage, TNR_FDG, FAratio, vascular invasion, and tumor size were significant factors, but in multivariate analysis, TNR_FDG was the only significant factor in the prediction of recurrence (Table 4). Patients with TNR_FDG >2.41, which was the cutoff value derived from response after TACE, exhibited shorter RFS based on the log-rank test (median, RFS 7.40; range, 0.8–14.9 months, P < .001).
Figure 5.
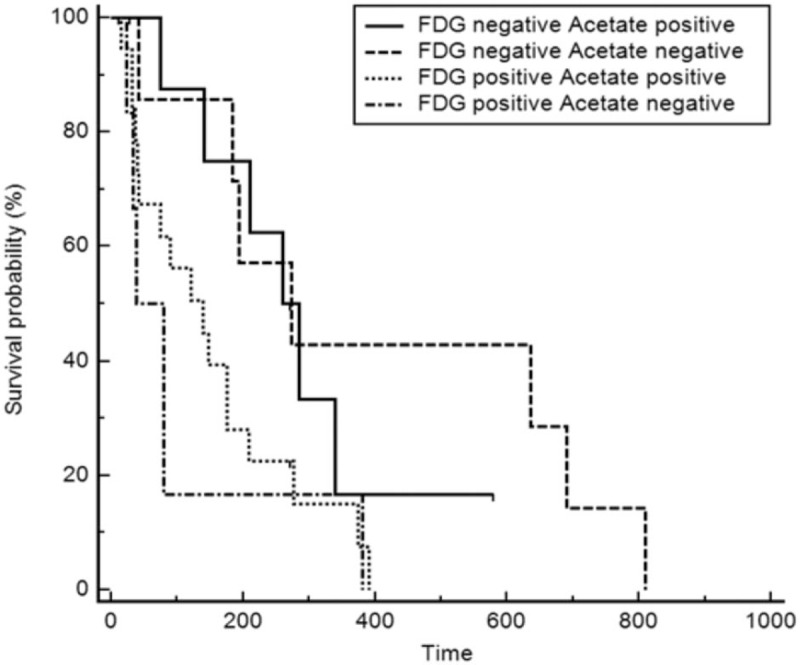
Kaplan–Meier survival analysis with regard to 11C-acetate and 18F-FDG avidity. Significant differences in RFS were observed among the 4 groups according to the 18F-FDG and 11C-acetate uptake. 18F-FDG = 18F-fluoro-D-glucose, RFS = recurrence-free survival.
Table 4.
Multivariate analysis for the prediction of recurrence after TACE.

3.5. Subgroup analysis according to BCLC stage: intermediate stage and advanced stage patients
Patients with intermediate and advanced BCLC stages were divided into subgroups, and subgroup analysis was performed. In each group, RFS was 4.03 months (range, 0.37–9.20 months) in intermediate BCLC stages and 1.40 months (0.8–3.06 months) in advanced BCLC stages (see Table S2, Supplemental Content, which shows patients’ demographics in each stages). In patients in the intermediate BCLC stage group, multivariate analysis revealed that TNR_FDG was the only significant factor among Child–Pugh class, mHAP score, number, size, vascular invasion, AFP and FAratio (HR [harzard ratio] 1.37, P = .0099). In contrast, for patients in the advanced BCLC stage group, multivariate analysis revealed that FAratio was the only significant factor among Child–Pugh class, mHAP score, number, size, vascular invasion, AFP and TNR_FDG (HR 1.57, P = .0181). Kaplan–Meier survival curves in each stage are depicted in Fig. 6.
Figure 6.
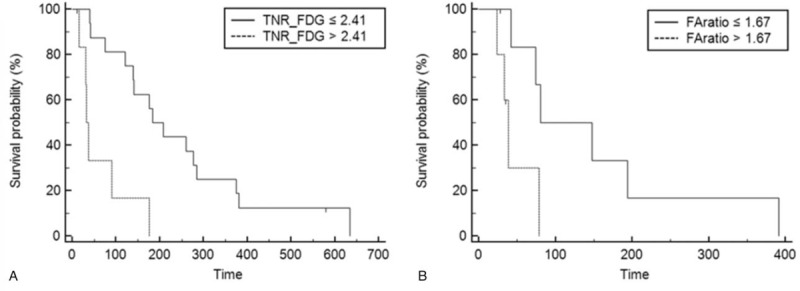
Kaplan–Meier survival analysis of subgroup analysis with regard to BCLC stage. (A) In intermediate stage patients, significantly longer RFS was observed in low TNR_FDG. (B) In advanced stage patients, significantly longer RFS was observed in low FAratio. Multivariate analysis revealed in intermediate stage patients that TNR_FDG was the only significant factor and in advanced stage patients, and FAratio was the only significant factor in the prediction of tumor progression after TACE. BCLC = Barcelona Clinic Liver Cancer, FAratio = ratio of TNR_FDG and TNR_Ace, TACE = transarterial chemoembolization, TNR_FDG = maximum tumor SUV to mean normal liver SUV ratio of 18F-FDG, RFS = recurrence-free survival.
4. Discussion
TACE is widely performed in intermediate to advanced HCC.[4] Since TACE is a palliative treatment, meticulous follow-up is needed to manage recurrence.[22] There are known tools for the prediction of recurrence, such as the mHAP score. It is based on clinical factors and the size of the tumor using data-driven approach. However, there has been a lack of studies correlating tumor recurrence with aspects of tumor metabolism, which could be evaluated by 18F-FDG and 11C-acetate PET/CT.
In the present study, FAratio, which is the ratio of TNR_FDG to TNR_Ace, exhibited the largest AUC when correlated with the response after TACE. FAratio was a significant factor for the prediction of response after TACE among various factors. However, FAratio could predict recurrence after TACE in univariate analysis but not in multivariate analysis. As reported in the previous study, TNR_FDG was the only significant factor in the prediction of tumor progression after TACE.[9]18F-FDG uptake of tumors is well known as a poor prognostic factor for recurrence.[9–11]18F-FDG uptake is related to poorly differentiated HCC and the aggressiveness of the tumor.[23–25] However, in the subgroup analysis of patients with advanced BCLC stage, FAratio was the only significant factor in the prediction of RFS in multivariate analysis.
TNR_Ace is the denominator of FAratio, and it is closely related to 11C-acetate uptake, in addition to 18F-FDG uptake. 11C-acetate uptake itself was not significant factor in the prediction of response or prognosis after TACE. However, significant differences in RFS were observed among 18F-FDG positive 11C-acetate positive, 18F-FDG positive 11C-acetate negative, 18F-FDG negative 11C-acetate positive, and 18F-FDG negative and 11C-acetate negative patients using Kaplan–Meier analysis (Fig. 5). In particular, longer RFS was observed in acetate positive patients in the 18F-FDG positive group, compared with acetate negative patients. The reason for the fair outcomes of patients with 11C-acetate in the 18F-FDG avid group was related to lipiodol uptake after TACE. Heterogeneous or non-compact lipiodol uptake is known to be related to recurrence after TACE.[8,26,27] Lipiodol uptake of the tumor could be affected by the vascularity of the tumor, and 11C-acetate uptake increases under a hypervascular environment.[28–30] In contrast, hypovascularity and severe hypoxia are less favorable for 11C-acetate uptake and could be related to poor differentiation of the tumor and could potentially explain 18F-FDG uptake.[31] TNR_Ace was higher in the complete lipiodol uptake group than in the partial lipiodol uptake group. In contrast, 18F-FDG uptake was significantly higher in the partial lipiodol uptake group, as expected. Thus, when tumors exhibit 11C-acetate and 18F-FDG uptake both, tumor characteristics are more hypervascular, compared with tumors with 18F-FDG uptake alone, which could lead to fair outcomes after TACE. Uptake patterns of 11C-acetate and 18F-FDG could be heterogeneous in the same tumor (Fig. 7). Metabolic features related to 11C-acetate uptake might partially incorporate the CT features related to lipiodol uptake.
Figure 7.
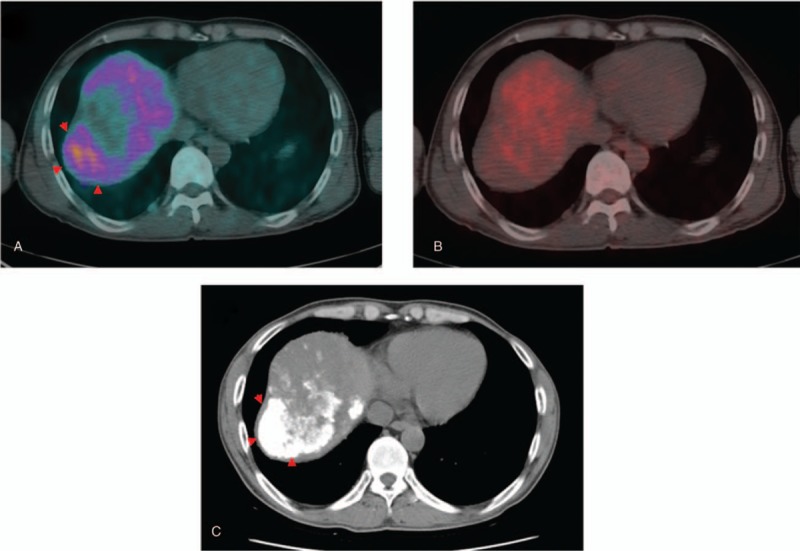
Forty-eight-year-old man with huge infiltrative HCC in the right hepatic lobe. (A) 11C-acetate uptake is shown in the lateral side of the right hepatic lobe tumor (arrowhead). (B) In contrast, 18F-FDG uptake is shown in the medial side of the right hepatic lobe tumor. (C) Lipiodol uptake is shown in the lateral side of the tumor, concordant with the 11C-acetate uptake portion (arrowhead). 18F-FDG = 18F-fluoro-D-glucose, HCC = hepatoceullar carcinoma.
However, FAratio was a significant factor only in the BCLC advanced group in the prediction of tumor progression and not in all of the patients. In the intermediate stage patients, TNR_FDG was sufficient in the prediction of tumor progression, but in cases of advanced patients, the majority of patients exhibited 18F-FDG uptake. Tumor differentiation using the Edmonson–Steiner grade of these patients was III in 7 patients and II in 2 patients, and relatively poor differentiation likely resulted in 18F-FDG uptake. Therefore, in advanced patients, 18F-FDG uptake was common, and 11C-acetate uptake was more critical, compared with in the intermediate stage patients. In the intermediate stage patients, relative heterogenous differentiation was observed, which had an impact on 18F-FDG uptake. Since advanced BCLC stage patients generally exhibited poor overall survival with heterogenous clinical characteristics, precise and personalized approaches are needed.[32] Additionally, 11C-acetate PET/CT could help in the management of advanced stage patients.
There were some limitations of the present study. The study was performed in a retrospective manner, and it could influence patient selection. However, our patients were from our previous prospective study, and the image acquisition of PET/CT was uniform.[14] This condition could offset the retrospective nature of the study. Second, although 11C-acetate uptake was related to fair outcomes after TACE, it did not contribute greatly. The TNR_Ace was not a significant factor for the prediction of response or recurrence independently. The small number of patients probably resulted in the marginally significant difference in TNR_Ace between the complete lipiodol uptake and partial lipiodol uptake groups. In addition to response after TACE, low TNR_Ace was potentially related to recurrence after TACE. Good differentiation of the tumor itself was related to relatively longer RFS, but more studies of cancer metabolomics in terms of utilization of acetate are needed. Third, the value of FAratio is a ratio that emphasizes the value of each TNR. FAratio was a significant factor for the prediction of response and recurrence after TACE in the advanced patients, likely emphasizing TNR_FDG. However, since TNR could be affected by various PET/CT conditions, such as reconstruction method, the ratio of 18F-FDG uptake to 11C-acetate uptake was affected by technical problems more than uptake itself. Fourth, small number of patients with various BCLC stage was included in the study, and that could lead to false positive results. We could find significant factors for the prediction of response and recurrence after TACE with quite low P-values, but large prospective studies are needed for the validation of the present study.
5. Conclusion
11C-acetate and 18F-FDG dual tracer PET/CT assisted in the characterization of the tumor nature and in the prediction of response and recurrence after TACE. For the prediction of prognosis, dual radiotracer PET/CT could be beneficial in the management of advanced stage patients.
Author contributions
Conceptualization: Joong-Won Park.
Data curation: Joong-Won Park.
Funding acquisition: Seok-ki Kim.
Investigation: Sohyun Park, Seok-ki Kim.
Methodology: Tae-Sung Kim, Se Hun Kang, Hyun Beom Kim, Seok-ki Kim.
Project administration: Hyun Beom Kim, Seok-ki Kim.
Resources: Se Hun Kang, Hyun Beom Kim.
Software: Tae-Sung Kim.
Supervision: Tae-Sung Kim, Joong-Won Park, Seok-ki Kim.
Validation: Se Hun Kang, Seok-ki Kim.
Writing – original draft: Sohyun Park.
Writing – review & editing: Sohyun Park, Seok-ki Kim.
Supplementary Material
Footnotes
Abbreviations: 18F-FDG = 18F-fluoro-D-glucose, AUC = area under the curve, BCLC = Barcelona Clinic Liver Cancer, CoA = acetyl coenzyme A, FAratio = ratio of TNR_FDG and TNR_Ace, HAP score = hepatoma arterial-embolization prognostic score, HCC = hepatoceullar carcinoma, HR = hazard ratio, mHAP score = modified hepatoma arterial-embolization prognostic score, mRECIST = modified response evaluation criteria in solid tumors, PET/CT = positron emission tomography/computed tomography, RFS = recurrence-free survival, ROC = receiver-operating-characteristic, SUV = standardized uptake value, SUVmax = maximum standardized uptake value, SUVmean = mean standardized uptake value, TACE = transarterial chemoembolization, TNR = maximum tumor SUV to mean normal liver SUV ratio, TNR_Ace = maximum tumor SUV to mean normal liver SUV ratio of 11C-acetate, TNR_FDG = maximum tumor SUV to mean normal liver SUV ratio of 18F-FDG.
This research was supported by a National Cancer Center Grants (NCC-1710111-1, 1810201-1), National Cancer Center, Republic of Korea.
The authors of this work have no conflicts of interest to disclose.
Supplemental Digital Content is available for this article.
References
- [1].Torre LA, Bray F, Siegel RL, et al. Global cancer statistics, 2012. CA Cancer J Clin 2015;65:87–108. [DOI] [PubMed] [Google Scholar]
- [2].Llovet JM, Burroughs A, Bruix J. Hepatocellular carcinoma. Lancet 2003;362:1907–17. [DOI] [PubMed] [Google Scholar]
- [3].Bruix J, Sherman M. American Association for the Study of Liver D. Management of hepatocellular carcinoma: an update. Hepatology 2011;53:1020–2. [DOI] [PMC free article] [PubMed] [Google Scholar]
- [4].Verslype C, Rosmorduc O, Rougier P. Group EGW. Hepatocellular carcinoma: ESMO-ESDO Clinical Practice Guidelines for diagnosis, treatment and follow-up. Ann Oncol 2012;23(suppl):vii41–8. [DOI] [PubMed] [Google Scholar]
- [5].Kanematsu T, Furuta T, Takenaka K, et al. A 5-year experience of lipiodolization: selective regional chemotherapy for 200 patients with hepatocellular carcinoma. Hepatology 1989;10:98–102. [DOI] [PubMed] [Google Scholar]
- [6].Wheeler PG, Melia W, Dubbins P, et al. Non-operative arterial embolisation in primary liver tumours. Br Med J 1979;2:242–4. [DOI] [PMC free article] [PubMed] [Google Scholar]
- [7].Kadalayil L, Benini R, Pallan L, et al. A simple prognostic scoring system for patients receiving transarterial embolisation for hepatocellular cancer. Ann Oncol 2013;24:2565–70. [DOI] [PMC free article] [PubMed] [Google Scholar]
- [8].Kwan SW, Fidelman N, Ma E, et al. Imaging predictors of the response to transarterial chemoembolization in patients with hepatocellular carcinoma: a radiological-pathological correlation. Liver Transpl 2012;18:727–36. [DOI] [PMC free article] [PubMed] [Google Scholar]
- [9].Song MJ, Bae SH, Lee SW, et al. 18F-fluorodeoxyglucose PET/CT predicts tumour progression after transarterial chemoembolization in hepatocellular carcinoma. Eur J Nucl Med Mol Imaging 2013;40:865–73. [DOI] [PubMed] [Google Scholar]
- [10].Lee JW, Paeng JC, Kang KW, et al. Prediction of tumor recurrence by 18F-FDG PET in liver transplantation for hepatocellular carcinoma. J Nucl Med 2009;50:682–7. [DOI] [PubMed] [Google Scholar]
- [11].Kim YI, Paeng JC, Cheon GJ, et al. Prediction of posttransplantation recurrence of hepatocellular carcinoma using metabolic and volumetric indices of 18F-FDG PET/CT. J Nucl Med 2016;57:1045–51. [DOI] [PubMed] [Google Scholar]
- [12].Lee SD, Kim SH, Kim YK, et al. (18)F-FDG-PET/CT predicts early tumor recurrence in living donor liver transplantation for hepatocellular carcinoma. Transpl Int 2013;26:50–60. [DOI] [PubMed] [Google Scholar]
- [13].Lee JW, Hwang SH, Kim DY, et al. Prognostic value of FDG uptake of portal vein tumor thrombosis in patients with locally advanced hepatocellular carcinoma. Clin Nucl Med 2017;42:e35–40. [DOI] [PubMed] [Google Scholar]
- [14].Park JW, Kim JH, Kim SK, et al. A prospective evaluation of 18F-FDG and 11C-acetate PET/CT for detection of primary and metastatic hepatocellular carcinoma. J Nucl Med 2008;49:1912–21. [DOI] [PubMed] [Google Scholar]
- [15].Huo L, Guo J, Dang Y, et al. Kinetic analysis of dynamic (11)C-acetate PET/CT imaging as a potential method for differentiation of hepatocellular carcinoma and benign liver lesions. Theranostics 2015;5:371–7. [DOI] [PMC free article] [PubMed] [Google Scholar]
- [16].Yun M, Bang SH, Kim JW, et al. The importance of acetyl coenzyme A synthetase for 11C-acetate uptake and cell survival in hepatocellular carcinoma. J Nucl Med 2009;50:1222–8. [DOI] [PubMed] [Google Scholar]
- [17].Hwang KH, Choi DJ, Lee SY, et al. Evaluation of patients with hepatocellular carcinomas using [(11)C]acetate and [(18)F]FDG PET/CT: a preliminary study. Appl Radiat Isot 2009;67:1195–8. [DOI] [PubMed] [Google Scholar]
- [18].Park JW, Korean Liver Cancer Study G, National Cancer C. [Practice guideline for diagnosis and treatment of hepatocellular carcinoma]. Korean J Hepatol 2004;10:88–98. [PubMed] [Google Scholar]
- [19].Park JW, Park KW, Cho SH, et al. Risk of hepatitis B exacerbation is low after transcatheter arterial chemoembolization therapy for patients with HBV-related hepatocellular carcinoma: report of a prospective study. Am J Gastroenterol 2005;100:2194–200. [DOI] [PubMed] [Google Scholar]
- [20].Pinato DJ, Arizumi T, Allara E, et al. Validation of the hepatoma arterial embolization prognostic score in European and Asian populations and proposed modification. Clin Gastroenterol Hepatol 2015;13:1204.e2–8.e2. [DOI] [PubMed] [Google Scholar]
- [21].Lencioni R, Llovet JM. Modified RECIST (mRECIST) assessment for hepatocellular carcinoma. Semin Liver Dis 2010;30:52–60. [DOI] [PMC free article] [PubMed] [Google Scholar]
- [22].Woo HY, Jang JW, Choi JY, et al. Tumor doubling time after initial response to transarterial chemoembolization in patients with hepatocellular carcinoma. Scand J Gastroenterol 2010;45:332–9. [DOI] [PubMed] [Google Scholar]
- [23].Shiomi S, Nishiguchi S, Ishizu H, et al. Usefulness of positron emission tomography with fluorine-18-fluorodeoxyglucose for predicting outcome in patients with hepatocellular carcinoma. Am J Gastroenterol 2001;96:1877–80. [DOI] [PubMed] [Google Scholar]
- [24].Seo S, Hatano E, Higashi T, et al. Fluorine-18 fluorodeoxyglucose positron emission tomography predicts tumor differentiation, P-glycoprotein expression, and outcome after resection in hepatocellular carcinoma. Clin Cancer Res 2007;13(2 pt 1):427–33. [DOI] [PubMed] [Google Scholar]
- [25].Higashi T, Hatano E, Ikai I, et al. FDG PET as a prognostic predictor in the early post-therapeutic evaluation for unresectable hepatocellular carcinoma. Eur J Nucl Med Mol Imaging 2010;37:468–82. [DOI] [PubMed] [Google Scholar]
- [26].Kinugasa H, Nouso K, Takeuchi Y, et al. Risk factors for recurrence after transarterial chemoembolization for early-stage hepatocellular carcinoma. J Gastroenterol 2012;47:421–6. [DOI] [PubMed] [Google Scholar]
- [27].Rou WS, Lee BS, Moon HS, et al. Risk factors and therapeutic results of early local recurrence after transcatheter arterial chemoembolization. World J Gastroenterol 2014;20:6995–7004. [DOI] [PMC free article] [PubMed] [Google Scholar]
- [28].Zhao JG, Feng GS, Kong XQ, et al. Assessment of hepatocellular carcinoma vascularity before and after transcatheter arterial chemoembolization by using first pass perfusion weighted MR imaging. World J Gastroenterol 2004;10:1152–6. [DOI] [PMC free article] [PubMed] [Google Scholar]
- [29].Fujita T, Ito K, Tanabe M, et al. Iodized oil accumulation in hypervascular hepatocellular carcinoma after transcatheter arterial chemoembolization: comparison of imaging findings with CT during hepatic arteriography. J Vasc Interv Radiol 2008;19:333–41. [DOI] [PubMed] [Google Scholar]
- [30].Park YS, Lee CH, Kim JH, et al. Using intravoxel incoherent motion (IVIM) MR imaging to predict lipiodol uptake in patients with hepatocellular carcinoma following transcatheter arterial chemoembolization: a preliminary result. Magn Reson Imaging 2014;32:638–46. [DOI] [PubMed] [Google Scholar]
- [31].Yamamoto T, Hirohashi K, Kaneda K, et al. Relationship of the microvascular type to the tumor size, arterialization and dedifferentiation of human hepatocellular carcinoma. Jpn J Cancer Res 2001;92:1207–13. [DOI] [PMC free article] [PubMed] [Google Scholar]
- [32].Giannini EG, Bucci L, Garuti F, et al. Patients with advanced hepatocellular carcinoma need a personalized management: A lesson from clinical practice. Hepatology 2018;67:1784–96. [DOI] [PubMed] [Google Scholar]
Associated Data
This section collects any data citations, data availability statements, or supplementary materials included in this article.


