Abstract
This study was designed to investigate whether ANRIL affected the aetiology of coronary artery disease (CAD) by acting on downstream miR‐181b and NF‐κB signalling. Altogether 327 CAD patients diagnosed by angiography were included, and mice models of CAD were established. Human coronary endothelial cells (HCAECs) and human umbilical vein endothelial cells (HUVECs) were also purchased. In addition, shRNA‐ANRIL, shRNA‐NC, pcDNA3.1‐ANRIL, miR‐181b mimic, miR‐181b inhibitor and miR‐NC were transfected into the cells. The lipopolysaccharides (LPS) and pyrrolidine dithiocarbamate (PDTC) were also added to activate or deactivate NF‐κB signalling. Both highly expressed ANRIL and lowly expressed miR‐181b were associated with CAD population aged over 60 years old, with smoking history, with hypertension and hyperlipidemia, with CHOL H 4.34 mmol/L, TG ≥ 1.93 mmol/L and Hcy ≥ 16.8 μmol/L (all P < 0.05). Besides, IL‐6, IL‐8, NF‐κB, TNF‐α, iNOS, ICAM‐1, VCAM‐1 and COX‐2 expressions observed within AD mice models were all beyond those within NC and sham‐operated groups (P < 0.05). Also VEGF and HSP 70 were highly expressed within AD mice models than within NC and sham‐operated mice (P < 0.05). Transfection of either pcDNA‐ANRIL or miR‐181b inhibitor could significantly fortify HCAECs’ viability and put on their survival rate. At the meantime, the inflammatory factors and vascular‐protective parameters were released to a greater level (P < 0.05). Finally, highly expressed ANRIL also notably bring down miR‐181b expression and raise p50/p65 expressions within HCAECs (P < 0.05). The joint role of ANRIL, miR‐181b and NF‐κB signalling could aid in further treating and diagnosing CAD.
Keywords: coronary artery disease, lncRNA ANRIL, mice model, miR‐181b, NF‐κB
1. INTRODUCTION
The cardiovascular and cerebrovascular disorders, especially coronary artery disease (CAD), have cast huge burdens both socially and economically. Statistics documented that CAD comprised nearly 40% of all death‐relevant causes within developed countries,1 and its onset was considered as an interactive outcome of polygenes and environmental parameters.2 In spite of numerous studies mentioning the pathogenesis of atherosclerosis and development of ischaemic heart disease, around 30% of CAD cases failed to be explained by known cardiovascular hazards.3, 4 It was before manifested that CAD could be taken as a consequence of progressive inflammation,5 yet the exact mechanisms underlying dysfunctions of CAD remained vague.
Long non‐coding RNAs (lnc RNAs), a type of transcripts comprising >200 nucleotides, were involved in the aetiology of diverse human disorders through epigenetic, transcriptional and post‐transcriptional regulations.6, 7 Interestingly, it was appeared that lncRNAs also participated in the development of cardiovascular diseases, including heart failure, cardiac hypertrophy, cardiac metabolic diseases and myocardial infarction.8 Among them, lncRNA ANRIL, also named as CDKN2BAS, was ranked as the best replicating genetic risk factor for CAD,8 and it was speculated to alter expressions of related proteins through RNA interference, gene silencing, chromatin remodelling and DNA methylation.9 In addition, the function of lncRNAs was often mediated through the regulation of microRNAs (miRNAs), which post‐transcriptionally regulate gene expression by binding to the 3′ untranslated region (UTR) of mRNAs.10 For instance, it was documented that ANRIL modifying miR‐181b could boost a series of vicious transformations that were relevant to human vascular inflammation.11 However, whether ANRIL would impact on miR‐181b to regulate the onset or progression of CAD remained unanswered.
The miR‐181 pointed out here has been revealed to affect different aspects of cell life activities, including cell proliferation, cell differentiation and cell death.12, 13 Furthermore, miR‐181b was discovered to inhibit NF‐κB‐mediated endothelial cell activation by lowering the expression of importin‐α3 (IPOA3), a key protein assisting in translocation of NF‐κB from cytoplasm to nucleus.14 Notwithstanding, the role of miRNA‐181b in chronic inflammatory disease, such as atherosclerosis, has not been examined. However, in the vascular endothelium, NF‐κB activation induces the expression of pro‐inflammatory genes, which seemed as a pivotal parameter for the occurrence and development of atherosclerosis.15, 16, 17
All in all, it was hypothesized that ANRIL, miR‐181b and NF‐κB might function to modify the aetiology of atherosclerosis. In response, this study was designed to investigate whether ANRIL regulated the presence and progression of CAD by acting on downstream miR‐181band NF‐κB signalling.
2. MATERIALS AND METHODS
2.1. Inclusion of subjects
Altogether 327 CAD patients diagnosed by angiography were included from the 455th Hospital of Chinese People's Liberation Army during the time span stretching from March 2015 to July 2016. The participants with concurrent cancer, acute myocardial infarction, severe heart failure (left ventricular ejection fraction 30%), cardiomyopathy, active infection and connective tissue disease were excluded. This study has obtained the informed consents from all patients, and it was approved by the 455th Hospital of Chinese People's Liberation Army and the ethics committee of the 455th Hospital of Chinese People's Liberation Army.
2.2. Establishment of mice models and sample collection
The SD rats of clean grade (male; 7‐week; 220‐250 g) were provided by the experimental animal centre of the 455th Hospital of Chinese People's Liberation Army. The rats were anaesthetized with usage of 50 mg/kg pentobarbital sodium. Their four limbs were subcutaneously inserted with needle electrodes, and changes of electrocardiogram were monitored. After tracheal intubation, the rats’ breath was controlled at 90 times/min, and tidal volume was set as 3‐4 mL. The rats were disinfected and operated with thoracotomy before their pericardium was cut. After 30‐minute successful ligation, the artery clamp was loosen, and reperfusion was sustained for 90 minutes to cause ischaemia reperfusion injury. About 10 minutes later, ligation was considered as successful if ST‐segment elevation was observed within electrocardiogram, and those without ST‐segment elevation was sifted out. The cardiac tissues of rats were taken out, and the ischaemic myocardium within left ventricle of the heart was clipped and was frozen within liquid nitrogen at −80°C.
2.3. Determination of cardiac function
Sacculus was inserted through atrioventricular valve, and pressure transducer was connected with the computer. Then left ventricular systolic pressure (LVSP), maximum change rate of left intraventricular pressure (±dp/dtmax) and coronary blood‐flow volume (CF) were recorded.
2.4. Cell culture
Human coronary endothelial cells (HCAECs) and human umbilical vein endothelial cells (HUVECs) were purchased from the American Type Culture Collection (ATCC). HUVECs and HCAECs were cultured within endothelial cell growth medium (ScienCell, USA) that was supplemented with 5% (v/v) FBS, 1% endothelial cell growth supplement (ECGS) and 1% penicillin streptomycin. The HUVECs and HCAECs within 3‐7 passages were applied for the following experiments.
2.5. Conduction of ELISA
The interleukin‐6 (IL‐6) and IL‐8 concentrations were detected exactly in line with the procedures presented within IL‐6 kit (R&D System, Minneapolis, MN, USA) and IL‐8 kit (R&D System, Minneapolis, MN, USA). Finally, after supplementation of stopping solution, the absorbance (A) of each sample was determined at the wavelength of 450 nm by microplate reader (Tecan, Männedorf, Switzerland).
2.6. Quantitative real‐time polymerase chain reaction (qRT‐PCR)
RNeasy Mini Kit (Qiagen, Duesseldorf, Germany) was employed to extract total RNA from tissues. The purity and concentration of the RNA were measured with the aid of a spectrophotometer (Thermo Scientific, Waltham, MA, USA). We adopted PrimeScript RT reagent kit (Invitrogen, Carlsbad, CA, USA) to reversely transcribe 1 mg RNA, following the procedures of: (a) at 42°C for 60 minutes, (b) at 95°C for 5 minutes, and (c) at 4°C for 10 minutes. The obtained cDNAs were subject to PCR according to the instructions of the SYBR Green master kit (Applied Biosystems, Foster City, CA, USA). The primers (Table 1) were designed with usage of ABI Primer Express software and were synthesized by Shanghai Sango. Also the specific reaction conditions for ANRIL worked as follows: (a) pre‐denaturation at 95°C for 30 seconds; (b) 40 cycles of denaturation at 95°C for 2 minutes and annealing at 55°C for 1 minute; and (c) extension at 40°C for 5 minutes. The PCR conditions for miR‐181b were particularized as: (a) pre‐denaturation at 95°C for 30 seconds; (b) 40 cycles of denaturation at 95°C for 5 seconds and annealing at 60°C for 30 seconds; and (c) extension at 40°C for 5 minutes. Moreover, the detailed PCR conditions were enlisted as: (a) pre‐denaturation at 95°C for 30 seconds; (b) 40 cycles of denaturation at 95°C for 5 seconds and annealing at 60°C for 30 seconds; and (c) extension at 60°C for 5 minutes. GADPH was designated as the internal reference for ANRIL and NF‐κB, and U6 was set as the internal reference for miR‐181b. The 2−ΔΔCt method18 was used to calculate the relative expression of target genes.
Table 1.
The primer sequence of miR‐181b, lncRNA ANRIL, NF‐κB, TNF‐α, iNOS, ICAM‐1,VCAM‐1 used in this study
| Items | Primer sequence |
|---|---|
| miR‐181b | 5′‐ACACTCCAGCTGGGAACATTCATTGCTGTCGG‐3′ |
| 5′‐TGGTGTCGTGGAGTCG‐3′ | |
| U6 | 5′‐CTCGCTTCGGCAGCACA‐3′ |
| 5′‐AACGCTTCACGAATTTGCGT‐3′ | |
| LncRNA ANRIL | 5′‐TTATGCTTTGCAGCACACTGG‐3′ |
| 5′‐GTTCTGCCACAGCTTTGATCT‐3′ | |
| NF‐κB | 5′‐AACACTGCCGACCTCAAGAT‐3′ |
| 5′‐CATCGGCTTGAGAAAAGGAG‐3′ | |
| TNF‐α | 5′‐CTCCAGCTGGAAGACTCCTCCCAG‐3′ |
| 5′‐CCCGACTACGTGCTCCTCACC‐3′ | |
| iNOS | 5′‐TGGCTTGCCCTTGGAAGTTTCTC‐3′ |
| 5′‐TCCAGGCCATCTTGGTGGCAAGA‐3′ | |
| ICAM‐1 | 5′‐CGACTGGACGAGAGGGATTG‐3′ |
| 5′‐TTATGACTGCGGCTGCTACC‐3′ | |
| VCAM‐1 | 5′‐GCAAGGTTCCTAGCGTGTAC‐3′ |
| 5′‐GGCTCAAGCATGTCATATTCAC‐3′ | |
| GAPDH | 5′‐ACAGCAACAGGGTGGTGGAC‐3′ |
| 5′‐TTTGAGGGTGCAGCGAACTT‐3′ |
2.7. Cell transfection
The shRNA (shRNA‐ANRIL) targeting ANRIL, the shRNA lentivirus particles added with interfering nucleotides (shRNA‐NC), pcDNA3.1‐ANRIL, miR‐181b mimic, miR‐181b inhibitor and miR‐NC were all gained from Genepharma (Shanghai, China). The pcDNA™3.1 that was resistant to ampicillin was purchased from Invitrogen. The lipopolysaccharides (LPS, E. coli 0111:B4) and pyrrolidine dithiocarbamate (PDTC, Sigma, St. Louis, MO, USA) were, respectively, the activator and inhibitor for NF‐κB. The transfection was performed as per the instructions of Lipofectamine™ 2000 (Invitrogen), and cells of each group were collected 24‐48 hours after transfection.
2.8. Colony formation assay
The transfected cells were seeded at 1 × 10⁴ within culture dishes of a 35‐mm diameter. The cells stained with trypan blue were observed and counted in triplicate within 6 weeks. Then cells were dissociated and were suspended in the medium containing 0.3% agar. The colonies exceeding 0.5 mm in diameter were counted after 14 days.
2.9. Cell proliferation assay
All the procedures were carried through in line with the instructions of CCK‐8 kit (Dojindo Laboratories, Kumamoto, Japan). After 72‐hour transfection, 2 × 10⁴ cells (100 μL) were inoculated within each well of 96‐well culture plate. About 3‐4 hours later when cells grew against the wall, 100 μL RPMI 1640 complete medium and 10 μL CCK‐8 were added. Then, the cells were cultured in 5% CO2 at 37°C for 2 hours. The D450 values would be determined with a microplate reader (infinite M200, Tecan, Austria) at the wavelength of 450 nm.
2.10. Cell apoptosis assay
When cells were re‐suspended within 500 μL binding buffer, 5 μL Annexin V‐fluorescein isothiocyanate (FITC) (Invitrogen) and 10 μL propidium iodide (PI) were added in the darkness to stain the cells for 15 minutes. Within the scatter diagram drawn from bivariate flow cytometer (Bio‐Rad, Hercules, CA, USA), cells within the lower‐left quadrant and the upper‐left quadrant were, respectively, held as FITC‐/PI‐labelled live cells and FITC‐/PI+ labelled live cells. Moreover, cells within the upper‐right quadrant were considered as necrotic cells labelled with FITC+/PI+, and ones within the lower‐right quadrant were deemed as early apoptotic cell labelled by FITC+/PI‐.
2.11. Western blotting
We prepared RIPA lysis buffer to extract proteins from tissues and cells, and Bradford method was employed to measure the protein concentration. Subsequently, equal amounts (ie, 30 μg) of proteins were electrophoresed on the 6% or 10% polyacrylamide gel, and the isolated proteins were then transferred onto the polyvinylidene fluoride (PVDF) membrane. After 1‐hour blockage of the membranes with TBS Tween‐20 buffer that contained 5% bovine serum albumin (BSA) at room temperature, rabbit anti‐human NF‐κB monoclonal antibody (1:900, Abcam, Cambridge, MA, USA), rabbit anti‐human VCAM‐1 monoclonal antibody (1:1000, Abcam Cambridge, MA, USA), rabbit anti‐human VEGF polyclonal antibody (1:20, Santa Cruz Biotechnology, Santa Cruz, CA, USA), rabbit anti‐human HSP70 monoclonal antibody (1:100, Cell Signaling Technology, Danvers, MA, USA), rabbit anti‐human COX‐2 monoclonal antibody (1:100, DAKO, Glostrup, Denmark) and rabbit anti‐human GAPDH monoclonal antibody (1:1000, Cell Signaling Technology, Danvers, MA, USA) were supplemented. Then, the membranes were incubated with corresponding mouse anti‐rabbit secondary antibodies (1:10000, CST) at room temperature for 1 hour, and electro‐chemi‐luminescence (ECL) detection reagent (Millipore, Billerica, MA, USA) was utilized for development. At last, images were collected by employing Syngene Gene Genius gel imaging system (Syngene, Cambridge, UK).
2.12. Dual luciferase reporter gene assay
The ANRIL fragments that covered specific miR‐181b binding sites were cloned into the pmirGLO dual luciferase expression vector (Promega, Madison, WI, USA) to construct reporter vectors named as pmirGLO‐ANRIL‐Wt. The same vector including miR‐181b mutational sites within the ANRIL sequence was called as pmirGLO‐ANRIL‐Mut. The HCAECs that have been transfected with miR‐181b and miR‐NC were again transfected with pmirGLO‐ANRIL‐WT or pmirGLO‐ANRIL ‐MUT. Similarly, certain NF‐κB fragments that contained miR‐181b binding sites were amplified by PCR and were then cloned into pmirGLO dual luciferase expression vector to form NF‐κB‐Wt. The NF‐κB‐Mut was produced in a manner same to NF‐κB‐Wt, except that the miR‐181b binding sites within NF‐κB were mutated. When cell confluency reached 40% ‐50%, the cells that have been transfected with miR‐181b mimics or miR‐NC were, respectively, transfected with NF‐κB‐Wt, NF‐κB‐Mut or pRL‐TK reporter vector. Then, a luciferase reporter assay was performed based on the dual‐luciferase reporter gene detection system (Promega).
2.13. Statistical analyses
All the statistical analyses were performed with the aid of GraphPad Prism software (GraphPad Prism Software Inc., San Diego, USA). Student's t test or one‐way ANOVA test was employed to compare quantitative data (mean ± SD), and chi‐square test was applied for evaluation of enumeration data. A P value < 0.05 was considered as a mark of significant differences.
3. RESULTS
3.1. Association of ANRIL and miR‐181b expressions with baseline characteristics of CAD patients
Founded on the percentage of coronary artery stenosis, the CAD patients were categorized into LAD1 group (81%‐100%, severe), LAD2 group (51%‐80%, moderate), LAD 3 group (30%‐50%, mild) and healthy group. According to Figure 1A, up‐regulated ANRIL expression and down‐regulated miR‐181b expression were observed within CAD patients when compared to the healthy group (P < 0.05). It was further revealed that ANRIL expression increased with the rising degree of LAD (P < 0.05), yet miR‐181b expression followed a tendency opposite to ANRIL (P < 0.05). Similar to the results of tissues, ANRIL was expressed more within HCAECs than within HUVECs, and miR‐181b expression within HCAECs appeared lower than within HUVECs (P < 0.05)(Figure 1B). More than that, both highly expressed ANRIL and lowly expressed miR‐181b were associated with CAD population aged over 60 years old, with smoking history, with symptoms of hypertension and hyperlipidemia, with CHOL ≥ 4.34 mmol/L, TG ≥ 1.93 mmol/L and Hcy ≥ 16.8 μmol/L (all P < 0.05) (Table 2). Furthermore, the multi‐variate analyses informed us that higher ANRIL expression (HR = 2.10, 95% CI: 1.24‐3.57, P = 0.006), lower miR‐181b expression (HR = 1.81, 95% CI: 1.08‐3.02, P = 0.024), TG level ≥ 1.93 mmol/L (HR = 3.95, 95% CI: 2.10‐7.46, P < 0.001) and Hcy ≥ 16.8 μmol/L (HR = 2.30, 95% CI: 1.30‐4.07, P = 0.004) were all correlated with poorer prognosis of CAD patients (Table 3, Figure 1C). At the same time, Spearman's correlation analysis unfolded that miR‐181b expressions were negatively correlated with ANRIL expressions among the CAD patients investigated (rs = −0.534, P < 0.001) (Figure 1D).
Figure 1.
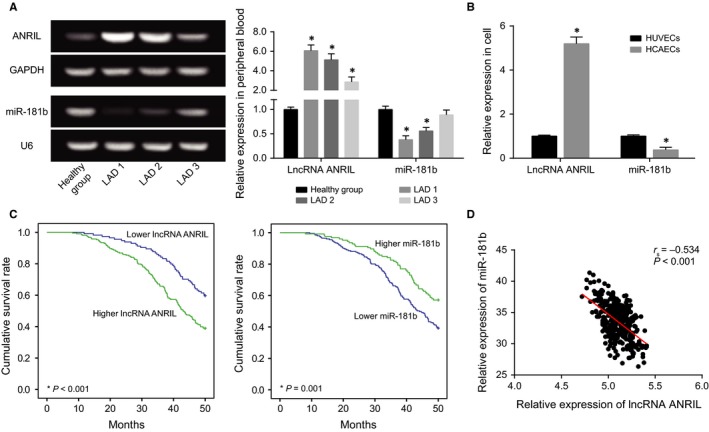
The Expressions of lncRNA ANRIL and miR‐181b were Compared between Coronary Artery Disease (CAD) Tissues/Cells and Normal Tissues/Cells. A, ANRIL and miR‐181b expressions were compared between CAD tissues and normal tissues. *P < 0.05 when compared to normal tissues. B, ANRIL and miR‐181b expressions were compared between HUVECs and HCAECs. *P < 0.05 when compared to HUVECs. C, The survival rates of CAD patients with differentially expressed ANRIL and miR‐181b were compared. D, ANRIL expressions were negatively correlated with miR‐181b expressions within CAD tissues
Table 2.
Association between the expression of long non‐coding RNA ANRIL/miR‐181b and the clinical characteristics in 327 patients with coronary artery disease
| Characteristics | LncRNA ANRIL expression | miR‐181b expression | ||||
|---|---|---|---|---|---|---|
| Low | High | P value | Low | High | P value | |
| Age (mo) | ||||||
| <60 | 50 | 59 | 0.003 | 55 | 54 | 0.004 |
| ≥60 | 64 | 154 | 146 | 72 | ||
| Gender | ||||||
| Female | 50 | 72 | 0.073 | 70 | 52 | 0.241 |
| Male | 64 | 141 | 131 | 74 | ||
| Distribution | ||||||
| Single vessel disease | 40 | 63 | 0.318 | 63 | 40 | 0.989 |
| Double vessel disease | 38 | 65 | 63 | 40 | ||
| Triple vessel disease | 36 | 85 | 75 | 46 | ||
| Disease types | ||||||
| AMI | 32 | 60 | 0.788 | 62 | 30 | 0.298 |
| UAP | 39 | 80 | 79 | 50 | ||
| SAP | 43 | 73 | 60 | 46 | ||
| Family history | ||||||
| Negative | 12 | 20 | 0.741 | 16 | 16 | 0.161 |
| Positive | 102 | 193 | 185 | 110 | ||
| Smoking | ||||||
| Positive | 25 | 81 | 0.003 | 75 | 31 | 0.017 |
| Negative | 89 | 132 | 126 | 95 | ||
| Hypertension | ||||||
| Positive | 42 | 110 | 0.011 | 107 | 45 | 0.002 |
| Negative | 72 | 103 | 94 | 81 | ||
| Diabetes | ||||||
| Positive | 32 | 40 | 0.053 | 47 | 25 | 0.452 |
| Negative | 82 | 173 | 154 | 101 | ||
| Hyperlipidemia | ||||||
| Positive | 40 | 115 | 0.001 | 105 | 50 | 0.027 |
| Negative | 74 | 98 | 96 | 76 | ||
| CHOL (mmol/L) | ||||||
| ≥4.34 | 56 | 135 | 0.013 | 126 | 65 | 0.048 |
| <4.34 | 58 | 78 | 75 | 61 | ||
| TG (mmol/L) | ||||||
| ≥1.93 | 60 | 140 | 0.021 | 135 | 65 | 0.005 |
| <1.93 | 54 | 73 | 66 | 61 | ||
| Hcy (μmol/L) | ||||||
| ≥16.8 | 65 | 156 | 0.003 | 146 | 75 | 0.014 |
| <16.8 | 49 | 57 | 55 | 51 | ||
AMI, acute myocardial infarction; UAP, unstable angina pectoris; SAP, stable angina pectoris; CHOL, cholesterol; TG, triacylglycerol; Hcy, homocysteine. The bold treatment indicated a significant result featured by p<0.05.
Table 3.
Univariate and multivariate analysis of factors influencing survival in patients with coronary artery disease
| Characteristics | Univariate analysis | Multivariate analysis | ||||
|---|---|---|---|---|---|---|
| Hazard Ratio | 95% CI | P value | Hazard Ratio | 95% CI | P value | |
| LncRNA ANRIL expression | ||||||
| High vs Low | 2.32 | 1.46‐3.69 | <0.001 | 2.1 | 1.24‐3.57 | 0.006 |
| miR‐181b expression | ||||||
| Low vs High | 2.06 | 1.31‐3.24 | 0.002 | 1.81 | 1.08‐3.02 | 0.024 |
| Age (mo) | ||||||
| <60 vs ≥60 | 0.91 | 0.57‐1.45 | 0.695 | 0.99 | 0.58‐1.68 | 0.965 |
| Smoking | ||||||
| Positive vs Negative | 1.66 | 1.04‐2.67 | 0.035 | 1.23 | 0.72‐2.10 | 0.446 |
| Hypertension | ||||||
| Positive vs Negative | 0.91 | 0.59‐1.41 | 0.687 | 0.67 | 0.40‐1.11 | 0.118 |
| Hyperlipidemia | ||||||
| Positive vs Negative | 1.69 | 1.09‐2.62 | 0.019 | 0.93 | 0.55‐1.58 | 0.8 |
| CHOL (mmol/L) | ||||||
| ≥4.34 vs <4.34 | 1.77 | 1.13‐2.75 | 0.012 | 0.56 | 0.30‐1.06 | 0.075 |
| TG (mmol/L) | ||||||
| ≥1.93 vs <1.93 | 3.66 | 2.29‐5.85 | <0.001 | 3.95 | 2.10‐7.46 | <0.001 |
| Hcy (μmol/L) | ||||||
| ≥16.8 vs <16.8 | 3.16 | 1.95‐5.13 | <0.001 | 2.3 | 1.30‐4.07 | 0.004 |
CHOL, cholesterol; TG, triacylglycerol; Hcy, homocysteine. The bold treatment indicated a significant result featured by p<0.05.
3.2. Variation of cardiac functions within CAD mice models
When compared to NC group and sham‐operated group, the CAD mice models were observed with remarkably decreased LVSP, +dp/dtmax and ‐dp/dtmax (all P < 0.05). Following an analogous trend, CAD mice models exhibited a significantly inhibited CF in comparison with NC group and sham‐operated group (P < 0.05) (Figure 2A). However, there was no significant distinction of LVSP, +dp/dtmax, ‐dp/dtmax NC and CF within NC group from those within sham‐operated group (P > 0.05).
Figure 2.
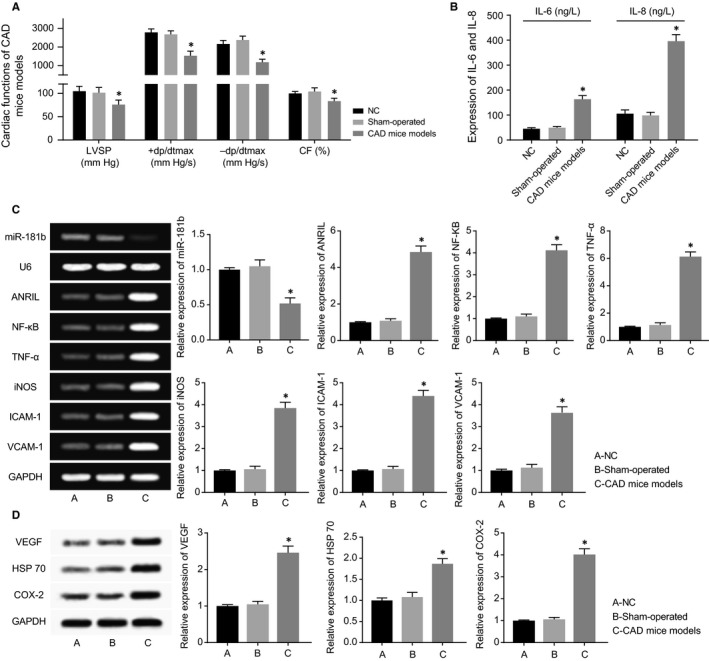
The CAD Mice Models were Established. A, The cardiac functions of mice were compared among CAD mice models, sham‐operated mice and negative control (NC) mice. *P < 0.05 when compared to NC and sham‐operated mice. B, IL‐6 and IL‐8 expressions were compared among CAD mice models, sham‐operated mice and NC mice. *P < 0.05 when compared to NC and sham‐operated mice. C, The expressions of ANRIL, miR‐181b, NF‐κB, TNF‐α, iNOS, ICAM‐1 and VCAM‐1 expressions were compared among CAD mice models, sham‐operated mice and NC mice. *P < 0.05 when compared to NC and sham‐operated mice. D, VEGF, HSP 70 and COX‐2 expressions were compared among CAD mice models, sham‐operated mice and NC mice. *P < 0.05 when compared to NC and sham‐operated mice
3.3. Expressions of ANRIL, MiR‐181b, NF‐κB, inflammatory factors (IL‐6, IL‐8, TNF‐l, iNOS, ICAM‐1, VCAM‐1 and COX‐2) and vascular‐protective factors (ie, VEGF and HSP 70) within CAD mice models
Up‐regulated ANRIL and NF‐κB expressions, along with largely down‐regulated miR‐181 expressions, were found within AD mice models, with NC and sham‐operated groups as the reference (P < 0.05). Besides, regarding the inflammatory factors, IL‐6, IL‐8, NF‐κB, TNF‐, iNOS, ICAM‐1, VCAM‐1 and COX‐2 expressions observed within AD mice models were all beyond those within NC and sham‐operated groups (P < 0.05) (Figure 2B,C). Also the vascular‐protective parameters, such as VEGF and HSP 70, were both highly expressed within AD mice models than within mice of NC and sham‐operated groups (P < 0.05) (Figure 2D).
3.4. ANRIL and miR‐181b regulated survival, viability and apoptosis of HCAECs, along with EMT‐specific proteins within HCAECs
ANRIL expressions were up‐regulated and down‐regulated after respective transfection of si‐1#/2# and pcDNA‐ANRIL (P < 0.05), and miR‐181b also was over‐expressed and under‐expressed after respective treatments of miR‐181b mimic and miR‐181b inhibitor (Figure 3A,B). It was indicated from CCK8 assay and plate clone formation assay that transfection of either pcDNA‐ANRIL or miR‐181b inhibitor could significantly fortify HCAECs’ viability and put on their survival rate (P < 0.05), but HCAECs’ viability and survival rate dramatically fell off within si‐ANRIL and miR‐181b mimic groups in comparison with NC group (P < 0.05) (Figure 3C,D). In addition, pcDNA‐ANRIL and miR‐181b inhibitor, which went contrary to si‐ANRIL and miR‐181b mimic, were both correlated with declined apoptotic percentage of HCAECs, when compared to NC group (P < 0.05) (Figure 4A). Furthermore, over‐expressed ANRIL and under‐expressed miR‐181 generated lower E‐cadherin expression, along with higher N‐cadherin and vimentin expressions than NC group, which displayed a tendency opposite to under‐expressed ANRIL and over‐expressed miR‐181 (P < 0.05) (Figure 4B).
Figure 3.
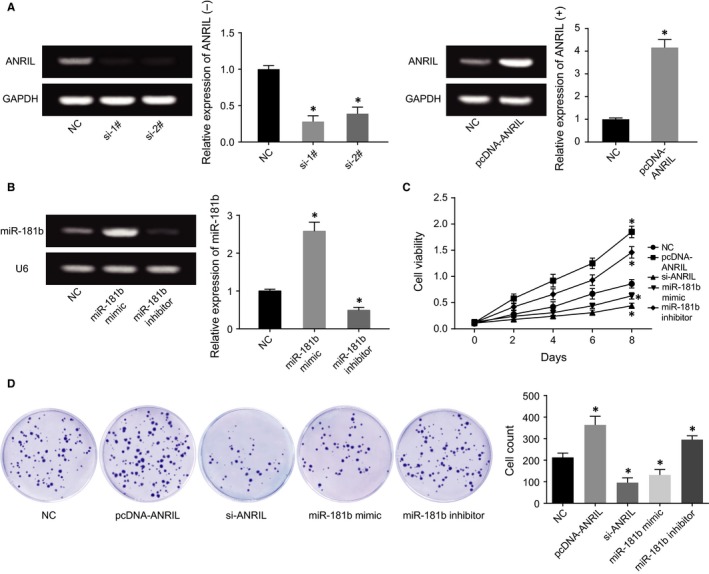
The Effects of ANRIL and miR‐181b on Viability and Survival of HUVECs and HCAECs were Evaluated. A, ANRIL expressions were determined after transfection of si‐1#, si‐2# or pcDNA‐ANRIL. *P < 0.05 when compared to NC. B, MiR‐181b expressions were determined after transfection of miR‐181b mimic or miR‐181b inhibitor. *P < 0.05 when compared to NC. C, The viability of HCAECs was compared among pcDNA‐ANRIL, si‐ANRIL, miR‐181b mimic, miR‐181b inhibitor and NC groups. *P < 0.05 when compared to NC. D, The survival rates of HCAECs were compared after transfection of pcDNA‐ANRIL, si‐ANRIL, miR‐181b mimic, miR‐181b inhibitor or NC. *P < 0.05 when compared to NC
Figure 4.
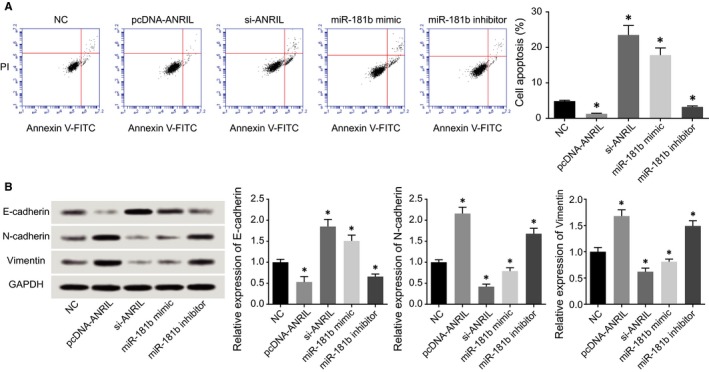
The Influences of ANRIL and miR‐181b on the Apoptosis and Epithelial Mesenchymal Transition (EMT)‐Specific Proteins were Assessed. A, The apoptotic statues of HCAECs were compared after transfection of pcDNA‐ANRIL, si‐ANRIL, miR‐181b mimic, miR‐181b inhibitor and NC groups. *P < 0.05 when compared to NC. B, The expressions of EMT‐specific proteins within HCAECs were compared after transfection of pcDNA‐ANRIL, si‐ANRIL, miR‐181b mimic, miR‐181b inhibitor or NC. *P < 0.05 when compared to NC
3.5. ANRIL and miR‐181b modulated HCAECs’ release of inflammatory factors and vascular‐protective factors
In line with Figure 5, we found that HCAECs transfected with pcDNA‐ANRIL and miR‐181b inhibitor released a larger amount of inflammatory factors (ie, IL‐6, IL‐8, TNF‐α, iNOS, ICAM‐1, VCAM‐1 and COX‐2) and vascular‐protective parameters (ie,. VEGF and HSP 70) than NC group. Conversely, silencing of ANRIL or addition of miR‐181b mimic both gave rise to down‐regulated expressions of the inflammatory factors and vascular‐protective parameters mentioned above (P < 0.05).
Figure 5.
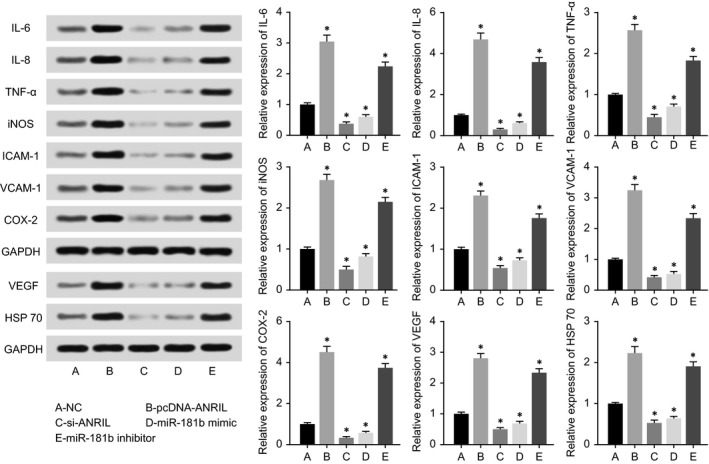
The Expressions of IL‐6, IL‐8, TNF‐α, iNOS, ICAM‐1, VCAM‐1, COX‐2, VEGF and HSP70 within HCAECs were Compared among pcDNA‐ANRIL, si‐ANRIL, miR‐181b Mimic, miR‐181b Inhibitor and NC Groups. *P < 0.05 when compared to NC
3.6. ANRIL targeted miR‐181b to inhibit its expression
The luciferase activity of the pmirGLO‐ANRIL‐Wt+miR‐181b group seemed quite lower than that of pmirGLO‐ANRIL‐Mut+miR‐181b group (P < 0.05), and scarcely any differences were viewed between pmirGLO‐ANRIL‐Mut+miR‐181b group and pmirGLO+NC group (P > 0.05) (Figure 6A). In addition, qRT‐PCR results delivered a message that highly expressed ANRIL also notably brought down miR‐181b expression and raised p50/p65 expressions within HCAECs (P < 0.05), yet altered miR‐181b expression exerted few effects on ANRIL expression within HCAECs (P > 0.05) (Figure 6B,C).
Figure 6.
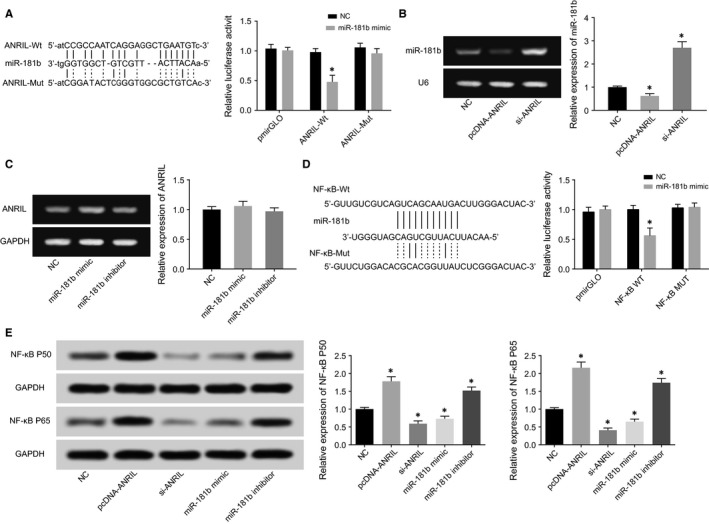
The Correlations among ANRIL, miR‐181b and NF‐kB within HCAECs were Verified. A, The luciferase activities were compared between miR‐181b mimic+ANRIL wt and miR‐181b mimic+ANRIL mut groups. *P < 0.05 when compared to miR‐181b mimic+NC. B, MiR‐181b expressions were detected after transfection of pcDNA‐ANRIL or si‐ANRIL. *P < 0.05 when compared with NC. C, ANRIL expressions were detected after transfection of miR‐181b mimic or miR‐181b inhibitor. D, The luciferase activities were compared between miR‐181b mimic+NF‐kB wt and miR‐181b mimic+NF‐kB mut groups. *P < 0.05 when compared to miR‐181b mimic+NC. E, NF‐kB p50 and p65 expressions were detected after transfection of pcDNA‐ANRIL, si‐ANRIL, miR‐181b mimic or miR‐181b inhibitor. *P < 0.05 when compared to NC
3.7. MiR‐181b prohibited HCAECs’ survival, viability and apoptosis, along with EMT‐specific proteins within HCAECs via targeting NF‐κB
The miR‐181b mimic transfected with pmirGLO‐NF‐κB‐Wt displayed a luciferase activity smaller than miR‐181b mimic+pmirGLO‐NF‐κB‐Mut group (P < 0.05), whose luciferase activity was approximate to that of miR‐NC+pmirGLO group without statistical significance (P > 0.05) (Figure 6D). Meanwhile, we found that up‐regulation or down‐regulation of miR‐181b expression could accordingly alter NF‐κB p50 and p65 expressions (P < 0.05) (Figure 6E).
The results of CCK8 assay and colony formation assay both showed that the viability and survival status of HCAECs were more vigorous within miR‐NC+NF‐κB activator group than within miR‐NC group (P < 0.05), suggesting that NF‐κB suppressed the miR‐181b‐induced effect of weakening proliferation of HCAECs. Moreover, miR‐NC+NF‐κB activator group presented relatively lower apoptosis than miR‐NC group (P < 0.05), implying that NF‐κB played an inhibitory role in the promoting effect of miR‐181b on HCAECs’ apoptosis. What's more, miR‐NC+NF‐κB activator group was determined with lowly expressed E‐cadherin and highly expressed N‐cadherin and vimentin, when compared to miR‐NC group (P < 0.05).
3.8. MiR‐181b repressed HCAECs’ capacity to release inflammatory factors and vascular‐protective factors through modulation of NF‐κB
MiR‐NC+NF‐κB activator group was found to secrete more inflammatory factors (ie, IL‐6, IL‐8, NF‐κB, TNF‐α, iNOS, ICAM‐1, VCAM‐1 and COX‐2) and vascular‐protective factors (ie, VEGF and HSP 70) than miR‐NC group (P < 0.05) (Figure 8). And miR‐NC group remained higher release of the above‐mentioned inflammatory factors and vascular‐protective factors than miR‐181b mimic group (P < 0.05).
Figure 8.
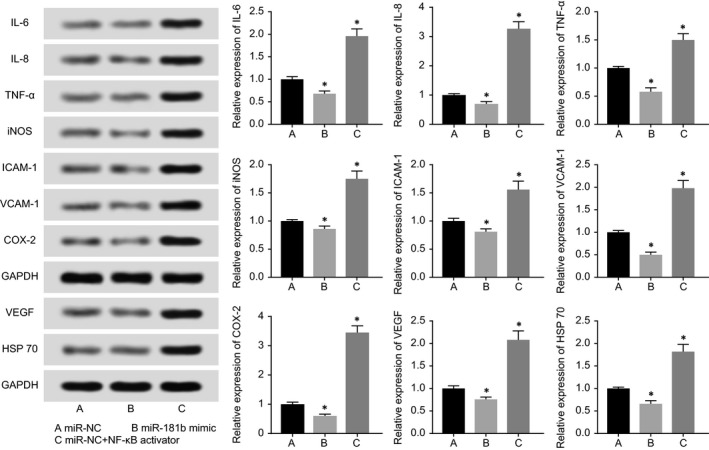
NF‐kB modified by miR‐181b participated in regulating expressions of IL‐6, IL‐8, TNF‐α, iNOS, ICAM‐1, VCAM‐1, COX‐2, VEGF and HSP70 within HCAECs. *P < 0.05 when compared to miR‐NC
4. DISCUSSION
Coronary artery disease, one principal cause for heart disease‐induced death, has been on the rise in its prevalence because of increased populations with obesity and diabetes.19, 20, 21 Currently, the treatments for CAD mainly incorporated chemotherapy, percutaneous coronary intervention, coronary artery bypass grafting and so on, it still brought about high mortality.22 One main reason was believed as that the inaccurate and incomplete diagnostic strategies for CAD resulted in a spike in the rate of missed diagnosis. Therefore, early detection of CAD was of great necessity, and it had high application value to develop bio‐diagnostic markers featuring high sensitivity and convenience.
LncRNAs, a class of non‐coding RNAs with a length greater than 200 nt, can be involved in genetic regulation transcriptionally and post‐transcriptionally, and some of them, including Bvrt, Fendrr, ANRIL, MIAT, MyHeart (Mhrt), functioned essentially in the occurrence of heart diseases, including myocardial infarction, cardiomyopathy, heart failure and atherosclerosis.23, 24, 25, 26, 27, 28 ANRIL was a 3.8‐kb‐long non‐coding RNA transcribed from chromosome 9p21, which was a crucial locus of genetic sensitivity for CAD.29, 30 Multiple single nucleotide polymorphisms (SNPs) of ANRIL, such as rs6475606, rs10757274 and rs2383206, were reckoned as the pathological factors for CAD, and CAD was observably affected by the aberrant expression of ANRIL.25 It was additionally demonstrated that ANRIL could recruit CBX7 of polycomb repressive complex 1 (PRC1) and suz12 of PRC2 within prostate tissues and fibroblasts, so that expressions of INK4b/ARF/INK4a locus would be restrained.31, 32 The CDKN2A/B therein encoded cell cycle regulatory proteins, such as p16INK4A and p15INK4B,32 suggesting that ANRIL was actively involved in modifying cell proliferation, motility and apoptosis. Our study also demonstrated that ANRIL could greatly influence the viability, apoptosis and survival percentage of myocardial cells (Figures 3 and 4).
More than that, inflammation has been running through the mechanisms that facilitated the onset and development of CAD, especially when coronary plaques were initially formed, unsteadily progressed and finally broken.33 For instance, vascular endothelial cells (ECs) could perceive the pathological stimulus within blood by secreting inflammatory factors, and thereby triggering atherosclerosis. Zhou et al34 firstly disclosed that ANRIL and related inflammatory factors were up‐regulated within ECs under the stimulation of pathogens, which was mediated by up‐regulated TNF‐α that was caused by NF‐κB signalling. Also ANRIL was capable of binding to PRC‐associated protein (ie, Yin Yang 1) to induce or restrain genetic expressions (eg, IL6 and IL8) that were related with inflammatory responses.35, 36, 37 Thus, it was quite acceptable that ANRIL could act on NF‐κB signalling to induce inflammation, thereby generating CAD‐specific cell activities (Figures 3, 4, 5, 6, 7, 8).
Figure 7.
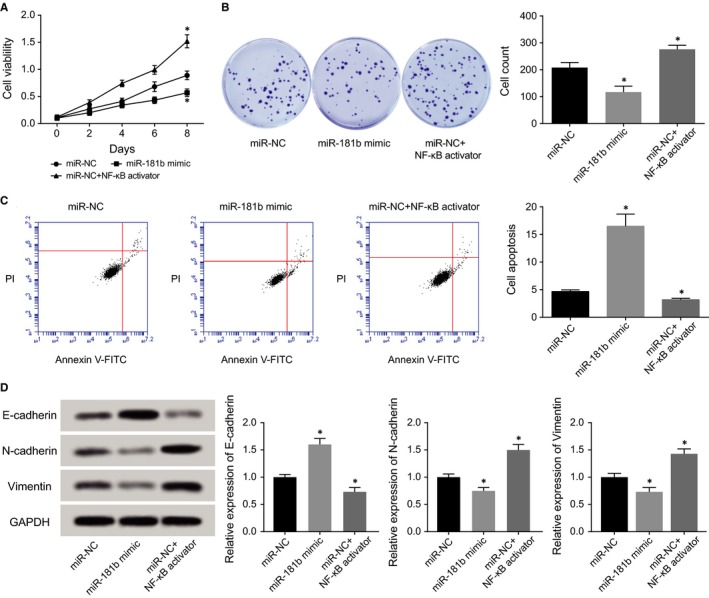
NF‐kB was Subject to Regulation of miR‐181b in Modulating Viability (A), survival (B), apoptosis (C) and epithelial‐mesenchymal transition (EMT)‐specific proteins (D). *P < 0.05 when compared to miR‐NC
LncRNAs usually modulated disease progression through functioning on coding or non‐coding genes to boost or hinder the regulatory network within cellular processes.38, 39 This investigation held that the regulatory role of ANRIL in CAD was played via regulation of miR‐181b (Figures 3, 4, 5, 6), which has been a focus among CAD studies. In particular, plasma miR‐181b was under‐expressed remarkably within CAD patients than within normal subjects.14 Furthermore, it was mirrored that decreased miR‐181b restrained vascular remodelling by activating TGF‐β/pSmadD2/3 pathway,40 and addition of angiotensin II into cardiac fibroblasts could significantly down‐regulate miR‐181b expression.41 In addition, it has been illuminated that miR‐181b might suppress breast cancer cells’ capacity of metastasis by targeting CXCL1 and CXCL2, a couple of inflammatory cytokines.42, 43, 44 He et al45 arrived at conclusions that miR‐181b was highly expressed with prostate cancer tissues and cell line (ie. PC‐3), and transfecting miR‐181b anti‐sense nucleotide sequences into PC‐3 cell line could result in increased cell apoptosis, decreased cell proliferation and inhibited cell invasion. Also it was covered by Bresin et al46 that over‐expressed miR‐181b might lower the expression of anti‐apoptosis proteins (eg, TCL1, Bcl2 and Mcl1) within chronic lymphocytic leukaemia (CLL) cells, and meanwhile, CLL cells’ apoptosis was evidently induced. Besides, miR‐181b expression was markedly up‐regulated within thyroid papillary carcinoma (TPC) tissues, and down‐regulating miR‐181b expression could evidently hinder TPC cells’ proliferation and promoted their apoptosis.47 This study also verified that miR‐181b, regulated by ANRIL, participated in the mechanisms underlying proliferation and apoptosis of HCAECs cells (Figures 3, 4, 5, 6).
With respect to inflammatory reactions, it was displayed that MiR‐181b could target Importin‐3(IPOA3) to restrain nuclear transfer of NF‐κB, thereby down‐regulating VCAM‐1 expression and relieving inflammatory responses.14 Moreover, after intravenous injection of miR‐181b mimic into atherosclerosis mice, the convergence of macrophages, CD4+ T cells and other inflammatory cells were held up, along with decreased expressions of inflammatory markers.11 Similar to this, our study verified that miR‐181b could induce inflammatory reactions both in vivo and in vitro, which was specifically manifested as that the expressions of IL‐6, IL‐8, TNF‐α, iNOS, ICAM‐1, VCAM‐1, COX‐2 were down‐regulated (Figures 5 and 8).
The NF‐κB signalling mentioned above not only resulted in incremental apoptosis and declined migration of cancer cells,48 but also mainly involved in inflammatory response. NF‐κB could directly stimulate expressions of such inflammatory factors as IL‐6, IL‐8, TNF‐α, iNOS, ICAM‐1, VCAM‐1 and COX‐2 (Figure 8). Among them, increased release of TNF‐α also could induce aggregation and expression of iNOS, ICAM‐1 and VCAM‐1 within the ischaemic region. Also IL‐6 could up‐regulate ICAM‐1 expression within endothelial cells, and thereby aggravating ischaemia to induce myocardial damage.49 Another channel of NF‐κB signalling lied in that activation of NF‐κB would trigger myocardial tissues’ awareness of self‐protection, so that enhancive expression of vascular‐protective factors (eg, VEGF and HSP90) could enhance proliferation of epithelium mucosae, tissue recovery and protection of cardiomyocytes (Figure 8).
Above all, this investigation elucidated that ANRIL could target miR‐181b to control proliferation and apoptosis of CAD cells, thereby inducing activation of NF‐κB signalling and release of inflammatory biomarkers, including IL‐6, IL‐8, NF‐κB, TNF‐α, iNOS, ICAM‐1, VCAM‐1 and COX‐2. Nevertheless, this study merely carried out in vitro experiments about the ANRIL/miR‐181b/NF‐κB axis, yet mice CAD models were not established to verify relevant results. Secondly, few experiments were carried out to explore whether overexpression or under‐expression of ANRIL and miR‐181b would affect the phenotypes of mice. Thirdly, we were not informed about if there existed small‐molecule drugs that could interfere with CAD treatment by impeding or promoting ANRIL/miR‐181b/NF‐κB axis. Lastly, curves were not fitted to assess if ANRIL and miR‐181b could act as biomarkers for early‐diagnosis of CAD.
CONFLICT OF INTEREST
None.
ACKNOWLEDGEMENT
None.
Guo F, Tang C, Li Y, et al. The interplay of LncRNA ANRIL and miR‐181b on the inflammation‐relevant coronary artery disease through mediating NF‐κB signalling pathway. J Cell Mol Med. 2018;22:5062–5075. 10.1111/jcmm.13790
REFERENCES
- 1. Zou JG, Ma YT, Xie X, et al. The association between CYP1A1 genetic polymorphisms and coronary artery disease in the Uygur and Han of China. Lipids Health Dis. 2014;13:145. [DOI] [PMC free article] [PubMed] [Google Scholar]
- 2. Winkelmann BR, Hager J. Genetic variation in coronary heart disease and myocardial infarction: methodological overview and clinical evidence. Pharmacogenomics. 2000;1:73‐94. [DOI] [PubMed] [Google Scholar]
- 3. Thygesen K, Alpert JS, Jaffe AS, et al. Third universal definition of myocardial infarction. J Am Coll Cardiol. 2012;60:1581‐1598. [DOI] [PubMed] [Google Scholar]
- 4. Perk J, De Backer G, Gohlke H, et al. European guidelines on cardiovascular disease prevention in clinical practice (version 2012). The fifth joint task force of the European society of cardiology and other societies on cardiovascular disease prevention in clinical practice (constituted by representatives of nine societies and by invited experts). G Ital Cardiol. 2013;14:328‐392. [Google Scholar]
- 5. Gutierrez E, Flammer AJ, Lerman LO, Elizaga J, Lerman A, Fernandez‐Aviles F. Endothelial dysfunction over the course of coronary artery disease. Eur Heart J. 2013;34:3175‐3181. [DOI] [PMC free article] [PubMed] [Google Scholar]
- 6. Batista PJ, Chang HY. Long noncoding RNAs: cellular address codes in development and disease. Cell. 2013;152:1298‐1307. [DOI] [PMC free article] [PubMed] [Google Scholar]
- 7. Autuoro JM, Pirnie SP, Carmichael GG. Long noncoding RNAs in imprinting and X chromosome inactivation. Biomolecules. 2014;4:76‐100. [DOI] [PMC free article] [PubMed] [Google Scholar]
- 8. Schunkert H, Konig IR, Kathiresan S, et al. Large‐scale association analysis identifies 13 new susceptibility loci for coronary artery disease. Nat Genet. 2011;43:333‐338. [DOI] [PMC free article] [PubMed] [Google Scholar]
- 9. Amaral PP, Dinger ME, Mercer TR, Mattick JS. The eukaryotic genome as an RNA machine. Science. 2008;319:1787‐1789. [DOI] [PubMed] [Google Scholar]
- 10. Shukla GC, Singh J, Barik S. MicroRNAs: processing, maturation, target recognition and regulatory functions. Mol Cell Pharmacol. 2011;3:83‐92. [PMC free article] [PubMed] [Google Scholar]
- 11. Sun X, He S, Wara AKM, et al. Systemic delivery of microRNA‐181b inhibits nuclear factor‐kappaB activation, vascular inflammation, and atherosclerosis in apolipoprotein E‐deficient mice. Circ Res. 2014;114:32‐40. [DOI] [PMC free article] [PubMed] [Google Scholar]
- 12. Ji J, Yamashita T, Budhu A, et al. Identification of microRNA‐181 by genome‐wide screening as a critical player in EpCAM‐positive hepatic cancer stem cells. Hepatology. 2009;50:472‐480. [DOI] [PMC free article] [PubMed] [Google Scholar]
- 13. Thomas M, Lieberman J, Lal A. Desperately seeking microRNA targets. Nat Struct Mol Biol. 2010;17:1169‐1174. [DOI] [PubMed] [Google Scholar]
- 14. Sun X, Icli B, Wara AK, et al. MicroRNA‐181b regulates NF‐kappaB‐mediated vascular inflammation. J Clin Investig. 2012;122:1973‐1990. [DOI] [PMC free article] [PubMed] [Google Scholar]
- 15. Baker RG, Hayden MS, Ghosh S. NF‐kappaB, inflammation, and metabolic disease. Cell Metab. 2011;13:11‐22. [DOI] [PMC free article] [PubMed] [Google Scholar]
- 16. Xanthoulea S, Curfs DM, Hofker MH, de Winther MP. Nuclear factor kappa B signaling in macrophage function and atherogenesis. Curr Opin Lipidol. 2005;16:536‐542. [DOI] [PubMed] [Google Scholar]
- 17. Kempe S, Kestler H, Lasar A, Wirth T. NF‐kappaB controls the global pro‐inflammatory response in endothelial cells: evidence for the regulation of a pro‐atherogenic program. Nucleic Acids Res. 2005;33:5308‐5319. [DOI] [PMC free article] [PubMed] [Google Scholar]
- 18. Livak KJ, Schmittgen TD. Analysis of relative gene expression data using real‐time quantitative PCR and the 2(‐Delta Delta C(T)) Method. Methods. 2001;25:402‐408. [DOI] [PubMed] [Google Scholar]
- 19. Consortium CAD, Deloukas P, Kanoni S, et al. Large‐scale association analysis identifies new risk loci for coronary artery disease. Nat Genet 2013;45:25‐33. [DOI] [PMC free article] [PubMed] [Google Scholar]
- 20. Gao R, Yang Y, Han Y, et al. Bioresorbable Vascular Scaffolds Versus Metallic Stents in Patients With Coronary Artery Disease: ABSORB China Trial. J Am Coll Cardiol. 2015;66:2298‐2309. [DOI] [PubMed] [Google Scholar]
- 21. Manoushagian S, Meshkov A. Evaluation of solid organ transplant candidates for coronary artery disease. Am Journal Transplant. 2014;14:2228‐2234. [DOI] [PubMed] [Google Scholar]
- 22. Acharya D, Gulack BC, Loyaga‐Rendon RY, et al. Clinical characteristics and outcomes of patients with myocardial infarction and cardiogenic shock undergoing coronary artery bypass surgery: data from the society of thoracic surgeons national database. Ann Thorac Surg. 2016;101:558‐566. [DOI] [PMC free article] [PubMed] [Google Scholar]
- 23. Klattenhoff CA, Scheuermann JC, Surface LE, et al. Braveheart, a long noncoding RNA required for cardiovascular lineage commitment. Cell. 2013;152:570‐583. [DOI] [PMC free article] [PubMed] [Google Scholar]
- 24. Han P, Li W, Lin CH, et al. A long noncoding RNA protects the heart from pathological hypertrophy. Nature. 2014;514:102‐106. [DOI] [PMC free article] [PubMed] [Google Scholar]
- 25. Broadbent HM, Peden JF, Lorkowski S, et al. Susceptibility to coronary artery disease and diabetes is encoded by distinct, tightly linked SNPs in the ANRIL locus on chromosome 9p. Hum Mol Genet. 2008;17:806‐814. [DOI] [PubMed] [Google Scholar]
- 26. Grote P, Wittler L, Hendrix D, et al. The tissue‐specific lncRNA Fendrr is an essential regulator of heart and body wall development in the mouse. Dev Cell. 2013;24:206‐214. [DOI] [PMC free article] [PubMed] [Google Scholar]
- 27. Ishii N, Ozaki K, Sato H, et al. Identification of a novel non‐coding RNA, MIAT, that confers risk of myocardial infarction. J Hum Genet. 2006;51:1087‐1099. [DOI] [PubMed] [Google Scholar]
- 28. Wu C, Arora P. Long noncoding Mhrt RNA: molecular crowbar unravel insights into heart failure treatment. Circ Cardiovasc Genet. 2015;8:213‐215. [DOI] [PubMed] [Google Scholar]
- 29. McPherson R, Pertsemlidis A, Kavaslar N, et al. A common allele on chromosome 9 associated with coronary heart disease. Science. 2007;316:1488‐1491. [DOI] [PMC free article] [PubMed] [Google Scholar]
- 30. Helgadottir A, Thorleifsson G, Manolescu A, et al. A common variant on chromosome 9p21 affects the risk of myocardial infarction. Science. 2007;316:1491‐1493. [DOI] [PubMed] [Google Scholar]
- 31. Yap KL, Li S, Munoz‐Cabello AM, et al. Molecular interplay of the noncoding RNA ANRIL and methylated histone H3 lysine 27 by polycomb CBX7 in transcriptional silencing of INK4a. Mol Cell. 2010;38:662‐674. [DOI] [PMC free article] [PubMed] [Google Scholar]
- 32. Kotake Y, Nakagawa T, Kitagawa K, et al. Long non‐coding RNA ANRIL is required for the PRC2 recruitment to and silencing of p15(INK4B) tumor suppressor gene. Oncogene. 2011;30:1956‐1962. [DOI] [PMC free article] [PubMed] [Google Scholar]
- 33. Rein P, Saely CH, Silbernagel G, et al. Systemic inflammation is higher in peripheral artery disease than in stable coronary artery disease. Atherosclerosis. 2015;239:299‐303. [DOI] [PubMed] [Google Scholar]
- 34. Zhou X, Han X, Wittfeldt A, et al. Long non‐coding RNA ANRIL regulates inflammatory responses as a novel component of NF‐kappaB pathway. RNA Biol. 2016;13:98‐108. [DOI] [PMC free article] [PubMed] [Google Scholar]
- 35. Holdt LM, Hoffmann S, Sass K, et al. Alu elements in ANRIL non‐coding RNA at chromosome 9p21 modulate atherogenic cell functions through trans‐regulation of gene networks. PLoS Genet. 2013;9:e1003588. [DOI] [PMC free article] [PubMed] [Google Scholar]
- 36. Hasegawa A, Yasukawa M, Sakai I, Fujita S. Transcriptional down‐regulation of CXC chemokine receptor 4 induced by impaired association of transcription regulator YY1 with c‐Myc in human herpesvirus 6‐infected cells. J Immunol. 2001;166:1125‐1131. [DOI] [PubMed] [Google Scholar]
- 37. Jeon Y, Lee JT. YY1 tethers Xist RNA to the inactive X nucleation center. Cell. 2011;146:119‐133. [DOI] [PMC free article] [PubMed] [Google Scholar]
- 38. He S, Su H, Liu C, et al. MicroRNA‐encoding long non‐coding RNAs. BMC Genom. 2008;9:236. [DOI] [PMC free article] [PubMed] [Google Scholar]
- 39. Wang K, Long B, Zhou LY, et al. CARL lncRNA inhibits anoxia‐induced mitochondrial fission and apoptosis in cardiomyocytes by impairing miR‐539‐dependent PHB2 downregulation. Nat Commun. 2014;5:3596. [DOI] [PubMed] [Google Scholar]
- 40. Hori D, Dunkerly‐Eyring B, Nomura Y, et al. miR‐181b regulates vascular stiffness age dependently in part by regulating TGF‐beta signaling. PLoS ONE. 2017;12:e0174108. [DOI] [PMC free article] [PubMed] [Google Scholar]
- 41. Jiang X, Ning Q, Wang J. Angiotensin II induced differentially expressed microRNAs in adult rat cardiac fibroblasts. J Physiol sci. 2013;63:31‐38. [DOI] [PMC free article] [PubMed] [Google Scholar]
- 42. Kronski E, Fiori ME, Barbieri O, et al. miR181b is induced by the chemopreventive polyphenol curcumin and inhibits breast cancer metastasis via down‐regulation of the inflammatory cytokines CXCL1 and ‐2. Mol Oncol. 2014;8:581‐595. [DOI] [PMC free article] [PubMed] [Google Scholar]
- 43. Sochor M, Basova P, Pesta M, et al. Oncogenic microRNAs: miR‐155, miR‐19a, miR‐181b, and miR‐24 enable monitoring of early breast cancer in serum. BMC Cancer. 2014;14:448. [DOI] [PMC free article] [PubMed] [Google Scholar]
- 44. Liu J, Shi W, Wu C, Ju J, Jiang J. miR‐181b as a key regulator of the oncogenic process and its clinical implications in cancer (Review). Biomed Rep. 2014;2:7‐11. [DOI] [PMC free article] [PubMed] [Google Scholar]
- 45. He L, Yao H, Fan LH, et al. MicroRNA‐181b expression in prostate cancer tissues and its influence on the biological behavior of the prostate cancer cell line PC‐3. Genet Mol Res. 2013;12:1012‐1021. [DOI] [PubMed] [Google Scholar]
- 46. Bresin A, Callegari E, D'Abundo L, et al. miR‐181b as a therapeutic agent for chronic lymphocytic leukemia in the Emicro‐TCL1 mouse model. Oncotarget. 2015;6:19807‐19818. [DOI] [PMC free article] [PubMed] [Google Scholar]
- 47. Li D, Jian W, Wei C, et al. Down‐regulation of miR‐181b promotes apoptosis by targeting CYLD in thyroid papillary cancer. Int J Clin Exp Pathol. 2014;7:7672‐7680. [PMC free article] [PubMed] [Google Scholar]
- 48. Wang L, Wang YX, Chen LP, Ji ML. Upregulation of microRNA‐181b inhibits CCL18‐induced breast cancer cell metastasis and invasion via the NF‐kappaB signaling pathway. Oncol Lett. 2016;12:4411‐4418. [DOI] [PMC free article] [PubMed] [Google Scholar] [Retracted]
- 49. Frangogiannis NG, Smith CW, Entman ML. The inflammatory response in myocardial infarction. Cardiovasc Res. 2002;53:31‐47. [DOI] [PubMed] [Google Scholar]


