Abstract
Heparin has many important biological activities, associated with a diverse set of interactions with biologically functional proteins. The binding mechanisms and biological significance of heparin-protein interactions have attracted wide attention. However, the temperature sensitivity of heparin-protein interaction is relatively unstudied. The impact of temperature on the binding of heparin to three representative heparin-binding proteins, antithrombin III (AT III), fibroblast growth factor-1 (FGF1) and fibroblast growth factor-2 (FGF2) are evaluated. The affinity and kinetics of these interactions were measured at 10°C, 25°C and 30°C. The association rate, dissociation rate, binding affinity and binding mass were compared at different temperatures. In the two state binding process between AT III and heparin, temperature played a negligible role on ATIII binding to heparin (1st state reaction), but demonstrated a role in the conformational change process (2nd state reaction). In the case of FGF1 and FGF2, the kinetics and affinity, while distinctly different at the temperatures studies, were still within the same order of magnitude. Based these results, we conclude that it many cases it is possible to perform surface plasmon resonance measurements of heparin-protein interaction at different temperatures, especially at reduced (ambient or lower) temperatures, and obtain comparable binding data.
Keywords: Heparin, Protein, Interaction, Temperature, Surface plasmon resonance
Introduction
Heparan Sulfate (HS) and heparin are the most structurally complex members of the Glycosaminoglycan (GAG) family. These anionic, polydisperse, linear polysaccharides are highly sulfated and are O-glycosidically linked to a core protein to comprise HS and heparin Proteoglycans (PGs). HS, found on the external cell membrane and also in the Extracellular Matrix (ECM), can interact with many different protein ligands [1–3]. Many physiological and pathophysiological processes can be modulated through heparin/HS-protein interactions including: blood coagulation, cell growth and differentiation, host defense, viral infection, lipid transport and metabolism, cell-to-cell and cell-to-matrix signaling, inflammation, Alzheimer’s disease and cancer [1]. HS-protein interactions have been demonstrated to critically modulate the biological activity of the proteins through a variety of mechanisms, including localization of proteins in the ECM, regulation of enzymatic activities, ligands binding to receptors, and protein protection against proteolysis [2]. Heparin/HS-PGs are also essential cofactors required for the interaction of fibroblast growth factors (FGFs) with their protein-based receptors (FGFRs) [3,4].
Biomolecular interactions are governed by weak forces including hydrogen bonds, van der Waals forces, ionic interactions, and hydrophobic interactions. Biological systems are usually restricted to a narrow range of physical conditions, since biomacromolecules are functionally active only within a narrow range of environmental conditions, such as temperature, ionic strength, and pH. Extremes of these conditions can overcome the weak forces essential to maintaining the intricate structure of macromolecules [5]. The effect of temperature on heparin–protein interactions is, however, rarely discussed, although heparin can occupy new vibrational modes as the temperature increases [6]. In traditional binding assays, the affinity measurements of protein interactions are typically performed at room temperature or lower, with little or no reflection of the potential impact of the temperature on these interactions. In the present study, the effect of temperature on the binding of heparin and three representative bioactive proteins was evaluated, and the affinity and kinetics of the interactions were analyzed at these selected temperatures. Changes in the behavior of the interactions, particularly in the association and dissociation rates were observed.
Materials and Methods
Materials
Porcine mucosal heparin (~16 kDa) was from Celsus Laboratories, (Cincinnati, OH). Human antithrombin III (AT III) was from Haematologic Technologies (Essex Junction, Vermont). FGF1 and FGF2 were generously provided by Amgen (Thousand Oaks, CA). GE Healthcare Bio-Sciences AB (Uppsala, Sweden) was the source of the SA sensor chips. A BIAcore 3000, running under BIAcore 3000 control and Version 4.0.1 BIAevaluation software, was used for SPR measurements.
Heparin biochip preparation
Biotin-heparin conjugate was synthesized through the reaction of long-chain sulfo-N-hydroxysuccinimide biotin (Thermo Fisher, Rockford, IL) with the unsubstituted amino groups of the polysaccharide chain’s glucosamine residues based on published methods [7–9]. The biotin-heparin conjugate was then bound to a Streptavidin (SA) chip. A 20 μL solution of the biotin-heparin conjugate in HBS-EP running buffer (0.1 mg/mL) was injected over SA chip flow cell 2 at 10 μL/min. Immobilization of heparin was indicated through a ~250 resonance unit (RU) increase. Control Flow Cell (FC1) was prepared through a 1 min injection of saturated biotin.
Measuring heparin-protein interaction using SPR at different temperatures
Protein samples were made up in HBS-EP buffer (0.01 M 4-(2-hydroxyethyl)-1-piperazineethanesulfonic acid, 0.15 M sodium chloride, 3 mM ethylene diaminetetraacetic acid, 0.005% surfactant P20, pH 7.4). Protein samples at different concentrations were injected to the heparin chip at 30 μL/min. The HBS-EP buffer was flowed over the sensor surface to facilitate dissociation at the end of the sample injection. After dissociation over a 3 min, the surface of the sensor was completely regenerated with 30 μL of 2 M NaCl. Sensorgrams measured response as a function of time and were recorded at 10, 25 and 30 °C.
Results and Discussion
Kinetics measurement of protein-heparin interactions under different temperatures
The kinetics and affinity of the interactions between heparin and three biologically important heparin-binding proteins (HBP) were measured by SPR under different temperatures. AT III is a serine protease inhibitor that inactivates various activated coagulation serine proteases, including factors IXa, Xa, TF-VIIa complex, and thrombin (factor IIa) [10,11]. The anticoagulant activity of heparin is primarily mediated through its binding and regulation of AT III [12–14], making the interaction between heparin and AT III a crucial step in the anticoagulation process. FGF1 and FGF2, also known as acidic and basic fibroblast growth factor, respectively, belong to the FGF family having 23 members and play an important role in the cell proliferation, differentiation, morphogenesis and angiogenesis, with heparin binding events highly involved [15–18].
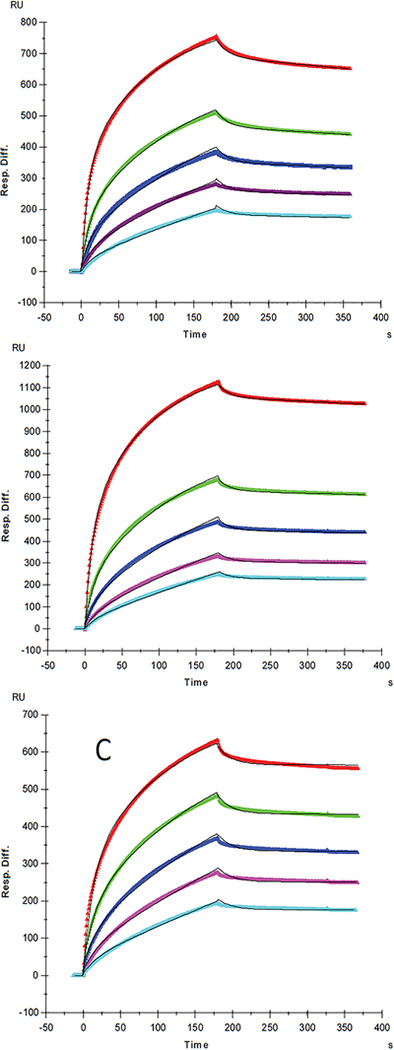
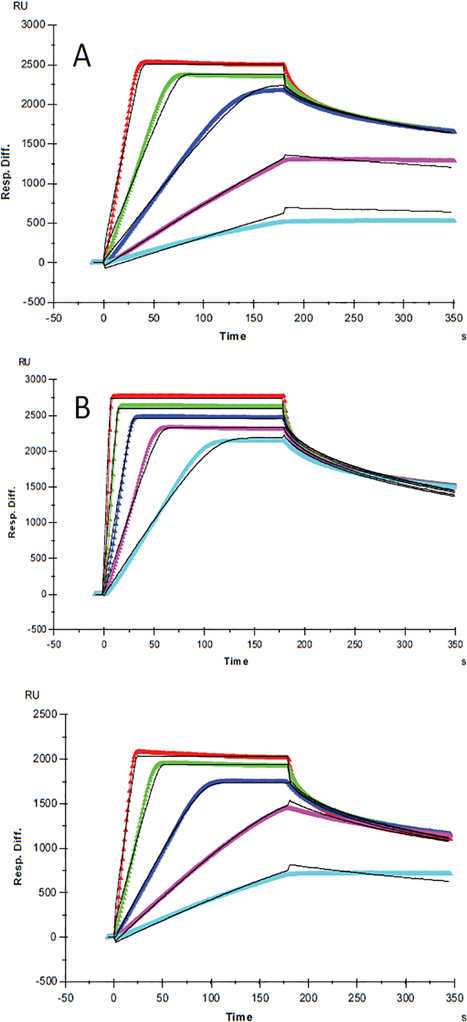
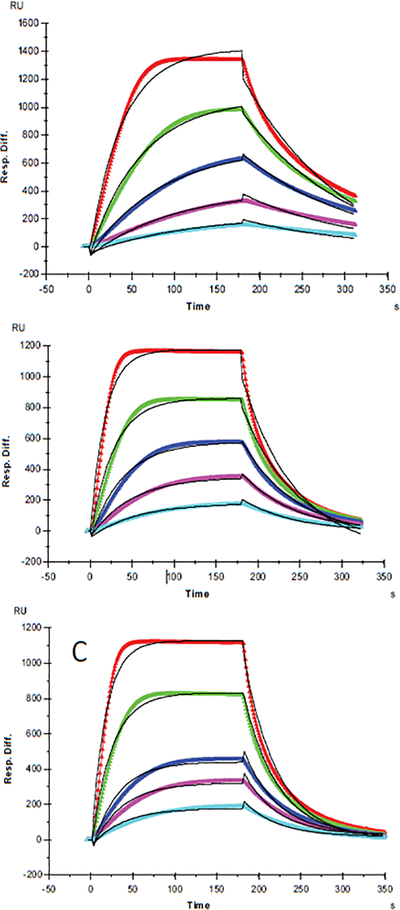
Evaluation of heparin interaction with AT III, FGF1 and FGF2 was conducted under 10˚C, 25˚C and 30˚C, and the association rates (ka), dissociation rates (kd) and dissociation constant (KD) were calculated. SPR sensorgrams of heparin-protein interactions at different temperatures were shown in Figures 1–3. Kinetics and affinity data are summarized in Table 1.
Figure 1:
SPR sensorgrams of ATIII-heparin interaction at different temperatures, A: 10°c; B: 25°c; C: 30°C. Concentrations of ATIII (from top to bottom): 200, 100, 50, 25, and 12.5 nM, respectively. The black curves are the fitting curves using two-state reaction (conformational change) model from BIAevaluate 4.0.1.
Figure 3:
SPR sensorgrams of FGF2-heparin interaction at different temperatures, A: 10°c; B: 25°c; C: 30°c. Concentrations of FGF2 (from top to bottom): 200, 100, 50, 25, and 12.5 nM, respectively. The black curves are the fitting curves using 1:1 Langmuir binding model from BIAevaluate 4.0.1.
Table 1:
Summary of kinetic data of heparin-protein interaction at different temperatures.
| Protein | Temperature | ka (1/MS) | kd (1/S) | Kd (M) |
|---|---|---|---|---|
| ATIII | 10°C | ka1 = 2.63 × 10⁵ (± 437) (1/MS) ka2 = 0.021(± 3.7 × 10⁻⁵) (1/S) |
kd1 = 0.047 (± 1.0 × 10⁻⁴) (1/S) kd2 = 4.78 × 10⁻⁴ (± 1.1 × 10⁻⁶) (1/S) |
|
| 25°C | ka1 = 2.4 × 10s (± 433) (1/MS) ka2 = 0.024 (± 5.1 × 10⁻⁵) (1/S) |
kd1 = 0.043 (± 1.1 × 10⁻⁴) (1/S) kd2 = 2.34 × 10⁻⁴ (± 6.7 × 10⁻⁷) (1/S) |
||
| 30°C | ka1 = 1.9 × 10⁵ (± 886) (1/MS) ka2 = 0.019 (± 8.1 × 10⁻⁵) (1/S) |
kd1 = 0.035 (± 2.4 × 10⁻⁴) (1/S) kd2 = 7.9 × 10⁻⁷(± 5.3 × 10⁻⁹) (1/S) |
||
| FGF1 | 10°C | 9.1 × 10⁴ (± 6.6 × 10³) |
7.6 × 10⁻³ (± 4.7 × 10⁻⁵) |
8.3 × 10⁻⁸ |
| 25°C | 2.0 × 10⁵ (± 6.6 × 10³) |
0.017 (± 4.7 × 10⁻⁵) |
8.3 × 10⁻⁸ | |
| 30°C | 2.0 × 10⁵ (± 6.6 × 10³) |
0.018 (± 4.7 × 10⁻⁵) |
1.1 × 10⁻⁷ | |
| FGF2 | 10°C | 4.6 × 10⁷ (± 6.6 × 10³) |
0.102 (± 4.7 × 10⁻⁵) |
2.2 × 10⁻⁹ |
| 25°C | 3.8 × 10⁸ (± 6.6 × 10³) |
0.406 (± 4.7 × 10⁻⁵) |
1.1 × 10⁻⁹ | |
| 30°C | 9.2 × 10⁷ (± 6.6 × 10³) |
0.296 (± 4.7 × 10⁻⁵) |
3.2 × 10⁻⁹ |
For AT III binding, the sensorgrams of heparin-ATIII interaction fit very well to a two-state binding model (Figure 1), indicating that ATIII undergoes a conformational change after it binding to heparin. The conformational change in ATIII on heparin binding is well established and is important in ATIII-mediated inhibition of many serine proteases and anticoagulant activity of heparin [19]. It appears that temperature has minimal effects on the ATIII binding to heparin (1st state reaction) since the measured ka1 and kd1 values were not obviously different at 10, 25, and 30°C. It is interesting to see that the conformational change process (2nd state reaction) was impacted by temperature apparently, since the kd2 decreased with the increased temperature with kd2 = 4.78 × 10⁻⁴ (± 1.1 × 10⁻⁶) (1/S) at 10 °C, kd2 = 2.34 × 10⁻⁴ ( ± 6.7 × 10⁻⁷) (1/S) at 25°C, and kd2 = 7.9 × 10⁻⁷(± 5.3 × 10⁻⁹) (1/S) at 30°C. These results suggest that a higher temperature favors conformational change and gives more stable ATIII-heparin complex. It was found that heparin produces a decrease in the β-structure of ATIII and a compensatory increase in random coil [20], which determines that the conformational change process is an entropy increased (ΔS>0) event. In such case, the increase of temperature would induce a lower Gibbs free energy (ΔG), giving higher tendency to form the conformation changed ATIII-heparin complex, which was testified by the significantly lower value of kd2 we got at 30°C. From another point of view, since hydrophobic interaction, which is the main force for protein folding, was found to be weaker at lower temperature [21], the stability of ATIII-heparin complex might be reduced at lower temperature, corresponding to the higher kd2 at 10°C and 25°C.
For FGF1 and FGF2, 1:1 Langmuir binding models were used for fitting. The lower reaction rates were expected at lower temperature since higher temperatures supply more energy, potentially leading to an accelerated interaction between heparin and proteins. An increase of both ka and kd was observed for FGF1 and FGF2 with temperature elevated from 10°C to 25°C or 30°C. For FGF1, ka was 9.1 × 10⁴ (1/MS) at 10°C, and 2.0 × 10⁵ (1/MS) at 25°C and 30°C, in the meantime kd increased from 7.6 × 10⁻³ (1/S) at 10°C to 0.017 (1/S) and 0.018 (1/S) at 25°C and 30°C, respectively. As ka and kd both increased by temperature, the affinity KD which was calculated by equation (KD = kd/ ka) became inestimable. For FGF1, the same value of KD (8.3 × 10⁻⁸ M) was obtained at 10°C and 25°C, implying a common binding affinity at different temperatures. This represents a good case to demonstrate that despite of the diverse kinetics between heparin and protein, binding affinity might be similar at different temperatures since the change of ka was compensated by the change of kd, when they were in the same direction. In contrast, it is interestingly noted that at 30 °C, KD of heparin-FGF1 binding was calculated to be 1.1 × 10⁻⁷ M, indicating a lower binding affinity than those at lower temperatures. This could be interpreted as the binding affinity was dominated by the faster dissociation rate at 30°C.
FGF2 had higher affinity with heparin and distinct binding kinetics, showing a “fast association and fast dissociation” mode (Table 1, Figures 2 and 3). The ka of FGF2 was approximately three orders of magnitudes larger than the ka of FGF1, while kd was only about two orders of magnitudes lower, resulting in a smaller KD (higher affinity) for FGF2. Similarly, an increase of both ka and kd was observed with temperature elevated from 10°C to higher. The ka for FGF2 was 4.6 × 10⁷ (1/MS) at 10°C, 3.8 × 10⁸ (1/MS) at 25°C and 9.2 × 10⁷ (1/MS) at 30°C, in the same time kd increased from 0.102 (1/S) at 10°C to 0.406 (1/S) and 0.296 (1/S) at 25°C and 30°C, respectively. However, FGF2 showed a significant decline of both ka and kd when temperature was increased from 25°C to 30°C, leading to the KD (3.2 × 10⁻⁹ M) at 30°C larger (lower affinity) than that at 25°C (1.1 × 10⁻⁹ M) and even 10°C (2.2 × 10⁻⁹ M). The dramatic changes of binding kinetics between FGF2 and heparin might be caused by the lower bioactivity and reduced stability of FGF2 at 30°C.
Figure 2:
SPR sensorgrams of FGF1-heparin interaction at different temperatures, A: 10°C; B: 25°C ; C: 30°C. Concentrations of FGF1 (from top to bottom): 200, 100, 50, 25, and 12.5 nM, respectively. The black curves are the fitting curves using 1:1 Langmuir binding model from BIAevaluate 4.0.1.
It is important to note that, for each of the protein tested, even though the kinetics and affinity were different at different temperatures, they were still in the same order of magnitude. Based on these results, we conclude that it is possible to conduct measurements of heparin-protein interaction at different temperatures by SPR, especially at low (ambient or lower) temperature and that influence of reduced temperature on the interaction behavior is likely to be low (less than one order of magnitude).
Effect of temperature on protein binding mass to heparin surface
The binding masses (RU) of three proteins to heparin surface were recorded at different protein concentrations and different temperatures. The binding mass corresponds to the maximum RU response achieved when certain amount of protein samples is flowed, for a fixed period of time, across the surface of a heparin-immobilized chip. Surprisingly, AT III showed highest binding mass to the chip at 25°C when compared to that obtained at lower (10°C) and higher (30°C) temperatures (Figure 4). Thus, one should carefully consider binding temperature when binding assays are performed under similar physicochemical conditions. As shown in Figure 5, the influence of temperature on binding mass of FGF1 to heparin surface was not significant. While FGF2 was observed to have notably largest RU at 25°C as shown in Figure 6, which was in consistent with the smallest KD (highest affinity) measured at ambient temperature.
Figure 4:
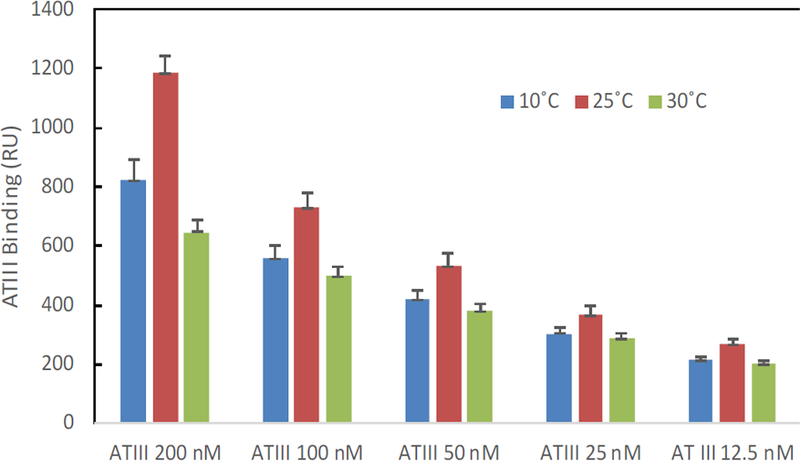
The effect of temperature on the ATIII binding mass (RU) to heparin surface.
Figure 5:
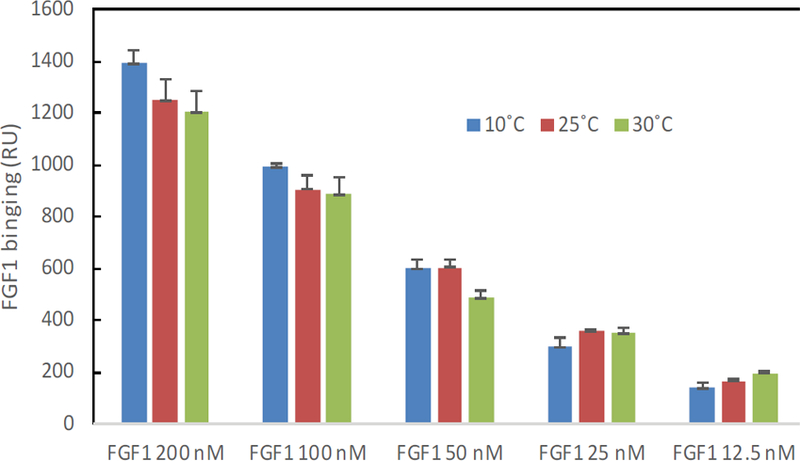
The effect of temperature on the FGF1 binding mass (RU) to heparin surface.
Figure 6:
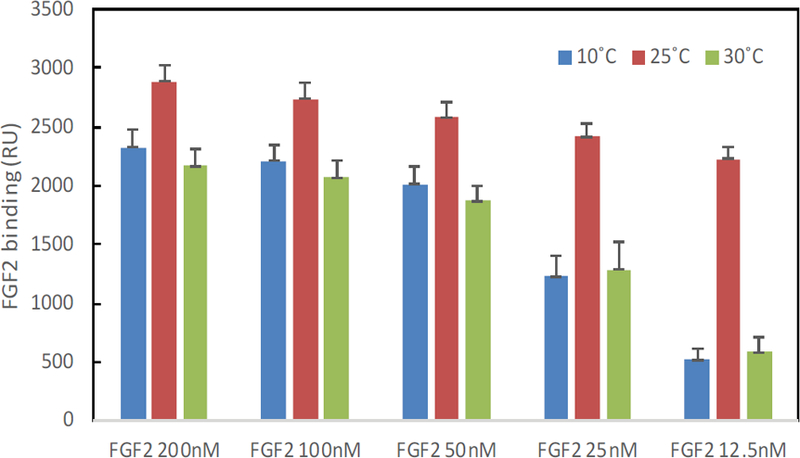
The effect of temperature on the FGF2 binding mass (RU) to heparin surface.
Acknowledgements
This work was supported by grants from the National Institutes of Health in the form of HL125371 and DK111958 (R.J.L.).
Abbreviations:
- GAG
Glycosaminoglycan
- SPR
Surface Plasmon Resonance
- HS
Heparan Sulfate
- ECM
Extracellular Matrix
- FGFs
Fibroblast Growth Factors
- FGFRs
Fibroblast Growth Factor Receptors
- AT III
Antithrombin III
- FGF1
Fibroblast Growth Factor-1
- FGF2
Fibroblast Growth Factor-2
- SA
Streptavidin
- FC
flow-Cell
- RU
Resonance Unit
- ka
Association Rates
- kd
Dissociation Rates
- KD
Dissociation Constant
- SD
Standard Deviations
References
- 1.Capila I, Linhardt RJ (2002) Heparin-protein interactions. Angew Chem Int Ed Engl 41: 391–412. [DOI] [PubMed] [Google Scholar]
- 2.Esko JD, Selleck SB (2002) Order out of chaos: Assembly of ligand binding sites in heparan sulfate. Annu Rev Biochem 71: 435–471. [DOI] [PubMed] [Google Scholar]
- 3.Powell AK, Yates EA, Fernig DG, Turnbull JE (2004) Interactions of heparin/heparan sulfate with proteins: Appraisal of structural factors and experimental approaches. Glycobiology 14: 17R–30R . [DOI] [PubMed] [Google Scholar]
- 4.Faham S, Hileman RE, Fromm JR, Linhardt RJ, Rees DC (1996) Heparin Structure and Interactions with basic fibroblast growth factor. Science 271: 1116–1120. [DOI] [PubMed] [Google Scholar]
- 5.Garrett RH, Grisham CM ( 2013) Biochemistry In: Brooks/Cole, Cengage Learning; (5th eds) Finch Mary,USA. [Google Scholar]
- 6.Meneghetti MC, Hughes AJ, Rudd TR, Nader HB, Powell AK, et al. (2015) Heparan sulfate and heparin interactions with proteins. J Royal Soc Interface 12: 0589. [DOI] [PMC free article] [PubMed] [Google Scholar]
- 7.Hernaiz M, Liu J, Rosenberg RD, Linhardt RJ (2000) Enzymatic modification of heparan sulfate on a biochip promotes its interaction with antithrombin III. Biochem.Biophys Res Commun 276: 292–297. [DOI] [PubMed] [Google Scholar]
- 8.Munoz E, Xu D, Kemp M, Zhang F, Liu J, et al. (2006) Affinity, kinetic, and structural study of the interaction of 3-O-sulfotransferase isoform 1 with heparan sulfate. Biochemistry 45: 5122–5128. [DOI] [PMC free article] [PubMed] [Google Scholar]
- 9.Zhang F, Liang X, Pu D, George KI, Holland PJ, et al. (2013) Biophysical characterization of glycosaminoglycan-IL-7 interactions using SPR. Biochimie 94: 242–249. [DOI] [PMC free article] [PubMed] [Google Scholar]
- 10.Bjork I (1989) Molecular mechanisms of the accelerating effect of heparin on the reactions between anti-thrombin and clotting proteinases. Heparin: Chemical and biological properties, clinical applications 229 . [Google Scholar]
- 11.Gray E, Hogwood J, Mulloy B (2012) The anticoagulant and antithrombotic mechanisms of heparin In: Heparin-A century of progress, Springer, Berlin, Heidelberg: pp 43–61. [DOI] [PubMed] [Google Scholar]
- 12.Rosenberg RD, Damus PS (1973) The purification and mechanism of action of human antithrombin-heparin cofactor. J Biol Chem 248: 6490–6505 . [PubMed] [Google Scholar]
- 13.Linhardt RJ (1991) Heparin: An important drug enters its seventh decade. Chem Ind 2: 45–50. [Google Scholar]
- 14.Atha DH, Lormeau JC, Petitou M, Rosenberg RD, Choay J (1985) Contribution of monosaccharide residues in heparin binding to antithrombin III. Biochemistry 24: 6723–6729. [DOI] [PubMed] [Google Scholar]
- 15.Ornitz DM (2000) FGFs, heparan sulfate and FGFRs: complex interactions essential for development. Bioessays 22: 108–112. [DOI] [PubMed] [Google Scholar]
- 16.Thompson LD, Pantoliano MW, Springer BA (1994) Energetic characterization of the basic fibroblast growth factor-heparin interaction: Identification of the heparin binding domain. Biochemistry 33: 3831–3840. [DOI] [PubMed] [Google Scholar]
- 17.Mach H, Volkin DB, Burke CJ, Middaugh CR, Linhardt RJ, et al. (1993) Nature of the interaction of heparin with acidic fibroblast growth factor. Biochemistry 32: 5480–5489. [DOI] [PubMed] [Google Scholar]
- 18.Kan M, Wang F, Xu J, Crabb JW, Hou J, et al. (1993) An essential heparin-binding domain in the fibroblast growth factor receptor kinase. Science 259: 1918–1921. [DOI] [PubMed] [Google Scholar]
- 19.Linhardt RJ (2003) Claude S Hudson Award address in carbohydrate chemistry. Heparin: Structure and activity. J Med Chem 46: 2551–2564. [DOI] [PubMed] [Google Scholar]
- 20.Danishefsky Villanueva GB I (1977) Evidence for a heparin-induced conformational change on antithrombin III. Biochem Biophys Res Commun 74: 803–809. [DOI] [PubMed] [Google Scholar]
- 21.Van Dijk E, Hoogeveen A, Abeln S (2015) The hydrophobic temperature dependence of amino acids directly calculated from protein structures. PLoS Comput Biol 11: e1004277. [DOI] [PMC free article] [PubMed] [Google Scholar]


