

Abstract
Background
Nerve grafting with an autograft is considered the gold standard. However, the functional outcomes of long (>3cm) nerve autografting are often poor. We hypothesized that a factor contributing to these outcomes is the graft microenvironment, where long compared to short autografts support axon regeneration to different extents.
Methods
A rat sciatic nerve defect model was used to compare regeneration within short (2cm) and long (6cm) isografts. Axon regeneration and cell populations within grafts were assessed using histology, retrograde labeling of neurons regenerating axons, immunohistochemistry, qRT-PCR, and electron microscopy at 4 and/or 8 weeks.
Results
At 8 weeks for distances of both 1 and 2cm from the proximal coaptation (equivalent regenerative distance), long isografts had reduced numbers of regenerated fibers compared to short isografts. Similarly, the number of motoneurons regenerating axons was reduced in the presence of long isografts compared to short isografts. Considering the regenerative microenvironments between short and long isografts, cell densities and general populations within both short and long isografts were similar. However, long isografts had significantly greater expression of senescence markers, which included senescence associated β-galactosidase, p21, and p16, as well as distinct chromatin changes within Schwann cells.
Conclusions
This study shows that axon regeneration is reduced within long compared to short isografts, where long isografts contained an environment with an increased accumulation of senescent markers. While autografts are considered the “gold standard” for grafting, these results demonstrate that we must continue to strive for improvements in the autograft regenerative environment.
Keywords: peripheral nerve, nerve grafts, nerve regeneration, nerve autograft, senescence
Introduction
Nerve grafting using an autograft has long been considered the “gold standard” for managing nerve defects. Despite donor site morbidity, such as skin numbness and an additional incision site, currently a nerve autograft provides the most complete regenerative environment for regenerating axons. However, the functional outcomes of nerve autografting are often merely adequate to poor, the latter especially as graft length increases. Sensory nerve grafting provides an ideal model to judge nerve grafts and nerve autograft substitutes, as time from injury and end-organ (i.e. muscle) wasting are not essential factors in success. Several series have examined outcomes of digital nerve grafting: Weber et al found an average of 12.9mm of moving 2 point discrimination (m2PD, normal= <6mm) in 8 autograft repairs of length 4-8mm and Eisenschenk reported only 30% of 96 digital nerve repairs of an average gap length of 22mm achieved sensory outcomes >S3 (S4= normal sensation and m2PD ≤5mm).1,2 The best reported outcomes are from Wang et al: an average of 4.3mm m2PD in 14 repairs of 15-60mm.3
Outcomes following long autografting of larger mixed motor-sensory nerves describe marginally acceptable results. In brachial plexus repairs of gap lengths >10cm, in a series of 47 patients, only 49% achieved ≥ M3 motor function.4 Wolfe et al. had significant success with axillary nerve grafting using sural cables ranging 11-15cm but still only 50% achieved ≥M4.5,6 While these studies introduce additional factors impacting recovery, including muscle atrophy and factors influencing axon growth found in the distal nerve,7–18 considerably less is known about the capabilities and limitations of autografts, especially for long defects. As autografts serve to facilitate axon regeneration to the distal nerve and end-organ targets, a loss of axons in this graft microenvironment could have a significant impact on recovery.
Animal models of grafting offer opportunities to examine the underlying principles of nerve regeneration across autografts. Previous animal studies have shown that increased nerve autograft length results in reduced functional outcome6,19 including reduced axon regeneration across the autograft.19 Importantly, these animal findings mirror clinical findings and are noteworthy given the superlative regenerative capabilities of rodents.20,21 Toward considering the autograft microenvironment, recent work in a nerve substitute, acellular nerve allografts (ANAs), showed that long compared to short ANAs yield different microenvironments, including an accumulation of stressed Schwann cells (SCs) expressing p16 within long ANAs. There is evidence that the persistence of accumulated stressed SCs does not promote axon regeneration as robustly as normal SCs.19,22 Therefore, we hypothesized that the autograft microenvironment contributes to the regenerative outcome, where long autografts do not support axon regeneration to the same extent as short autografts. To test this hypothesis, we examined regeneration across within short versus long autografts using a rat sciatic nerve defect reconstructed with the animal equivalent of an autograft: the isograft. We measured regeneration within the first 2cm of the grafts by 8 weeks to minimize the impact of regenerative distance and time as factors. We predicted that long compared to short isografts would not support axon regeneration to the same extent and the graft microenvironments would differ, including an accumulation of stressed cell populations in long isografts.
Materials and Methods
Animal Surgeries
Adult male Lewis rats (200-250g, Charles River Laboratories, Wilmington, MA) were randomized to autograft donor or experimental rats. The experimental rats consisted of short and long isograft groups distributed to two sets of animals to measure (A) the extent of axon regeneration at an 8-week endpoint (n=8 per group) and (B) the microenvironment within nerve and grafts at 4- and 8-week endpoints (n=4-6 per group per endpoint). Additionally, a set of rats received no injury (uninjured) serving as a baseline for perspective on reported metrics.
Surgical procedures and peri-operative care measures were conducted in compliance with the AAALAC accredited Washington University Institutional Animal Care and Use Committee (IACUC) and the National Institutes of Health guidelines. Procedure anesthesia was a solution of ketamine (75mg/kg, Fort Dodge Animal Health, Fort Dodge, IA) and dexmedetomidine (0.5mg/kg, Pfizer Animal Health, Exton, PA). Surgeries were done with aseptic technique using an operating microscope (JEDMED/KAPS, St.Louis, MO). Isograft nerve was obtained by exposing the sciatic nerve and dissecting to the spinal cord to achieve the needed length. The 6cm isografts were created by suturing two portions of nerve with 9-0 nylon microsuture. Previously, we did not observe that an additional suture line to “daisy-chain” nerve grafts in series had an impact on axon regeneration.23 In the animals randomized to the experimental groups, the right sciatic nerve was exposed and transected 5mm proximal to the distal trifurcation. The defect was reconstructed using 2cm (short) or 6cm (long) isografts with 9-0 nylon microsuture proximally and distally. In the grafts, 9-0 epineurial stitches were placed 1 and 2cm from the proximal coaptation to facilitate later harvest of the specific portions of the grafts. The repair was tension-free and a two layer closure of muscle and skin was performed. Atipamezole solution (0.1mg/kg; Zoetis, Florham Park, NJ) was administered for anesthesia reversal. The animals were recovered on a warming pad and monitored for postoperative complications before returning them to a central animal care facility. Postoperative pain was managed using Buprenorphine SR™ (0.05 mg/kg; ZooPharm, Windsor, CO) q 8-12 hrs prn. All animals were housed in a central animal care facility and provided with food (PicoLab rodent diet 20, Purina Mills Nutrition International, St. Louis, MO) and water ad libitum. Animals were monitored daily post-operatively for signs of infection and/or distress. At the appropriate end points, rats were euthanized using pentobarbital overdose (Somnasol, 150 mg/kg, Delmarva Laboratories, Des Moines, IA) and the grafts were excised, including the proximal and distal ends of the native nerve.
Histomorphometry and Electron Microscopy
Eight weeks following grafting, grafts underwent histomorphometric analysis.24 Grafts were harvested and stored in 3% glutaraldehyde (Polysciences Inc., Warrington, PA). The grafts were post-fixed in 1% osmium tetroxide, dehydrated, embedded in epoxy resin (Polysciences), and cross-sectioned at 1μm. Slides were counter-stained with 1% toluidine blue dye and analyzed at 1000× using a Leco IA32 Image Analysis System (Leco, St.Joseph, MI) to quantify myelinated axon counts, width, density, and percent neural tissue by a blinded observer. For electron microscopy, graft samples 1cm from the proximal coaptation and immediately adjacent to the distal coaptations were collected and processed as just described. These samples were sectioned at 90 nm and stained with uranyl acetate and lead citrate. Ultramicrographs were taken with a Joel 1200EX electron microscope at 10,000× magnification.
Retrograde Labeling
Eight weeks following grafting, rats underwent a second procedure under anesthesia. The grafts were divided 1cm from the proximal coaptation while uninjured rats as controls had nerve divided 1.5cm from the sciatic notch, such that all samples were equidistant to the spinal cord. The proximal cut end was placed in a silicone gel (Tyco, Mansfield, MA) well to isolate it and immersed in 4% Fluoro-Gold in sterile saline for 1hr. The dye was then removed and the incision closed in 2 layers as before. After 7d, the animals were euthanized as before and the lumbar region of the spinal cord was removed and placed in 4% paraformaldehyde. After 24hrs, the spinal cords were placed in 30% sucrose until frozen in OCT Compound (VWR) and cut into 50μm thick longitudinal sections on a cryostat (Leica, Buffalo Grove, IL). The number of Fluoro-Gold-positive cell nuclei in the lumbar ventral horns was counted on an Olympus IX81 microscope using both 10× and 20× objectives (100-200× overall magnification) with a DAPI (365nm) filter (Omega Optical, Brattleboro, VT).24,25
Graft Cell Populations
At 4 weeks following grafting, immunohistochemical staining was performed on the grafts. Tissue was flash frozen in OCT Compound (VWR) on dry ice and sectioned longitudinally into 10μm sections, where cross-sections were taken 2cm from the proximal suture line. Standard immunohistochemistry was performed using primary antibodies to S100 (Dako 70311), CD68 (Abcam 31630), Ki-67 (Cell Signaling Technologies 9129S), and α-SMA (Abcam 5694) with appropriate secondary antibody labeling. The average of 3 sections was taken for each animal specimen per group, where DAPI staining served to co-localize cell nuclei with each marker to count a positive cell.
Analysis of Senescence-associated β-galactosidase (SAβ-gal)
At 4 and 8 weeks following grafting, SAβ-gal activity was measured on nerve proximal to the grafts and the grafts. Tissue was flash frozen in OCT Compound (VWR) on dry ice and sectioned longitudinally into 20μm thick slices. Immediately following sectioning, SAβ-gal was measured using a Senescence Detection Kit according to the manufacturer’s protocol (Abcam). Sections were imaged at 20× overall magnification using a Nanozoomer HT (Hamamatsu, Bridgewater, NJ). To compare staining between groups, the average staining intensity was measured from the grafts using ImageJ (NIH). Stressed cells and the area they occupied were defined positive if SAβ-gal staining was at least two standard deviations greater than the average staining intensity for uninjured nerve. The total area of positive staining was normalized to the total area of the tissue and reported as a percentage of the tissue area positive for SAβ-gal.
qRT-PCR of Graft Gene Expression
At 4 and 8 weeks following grafting, graft segment RNA was extracted using Trizol (Life Technologies), chloroform and RNeasy Mini Kit (Qiagen, Valencia, CA) according to manufacturer’s instructions. RNA concentration was determined on a NanoDrop 1000 Spectrophotometer (Thermo Scientific, Wilmington, DE) and purity and integrity were assessed on an Agilent 2100 Bioanalyser RNA 6000 using an Agilent Nano total RNA Kit (Agilent Technologies, Santa Clara, CA). Genomic DNA contamination was removed through treatment with gDNA Wipeout Buffer (Qiagen) at 42°C for 2min. RNA was then reverse transcribed into complementary DNA per manufacturer’s instructions for the High Capacity RNA to DNA by RT2 First Strand Kit (Qiagen). Gene expression levels of p16 (Thermo-Fisher, RN 00580664) and p21 (Thermo-Fisher, RN 01427989) were examined with normalization to a housekeeping gene: β-actin (Thermo-Fisher, RN 00667869). PCR arrays were performed on a Step One Plus thermocycler (Applied Biosystems, Foster City, CA) and the data analyzed on Step One Software v2.2.2 (Applied Biosystems).
Statistical Analysis
All data were compiled as mean ± standard deviation. Unpaired, two-tailed Student’s T test was used to compare data sets. A significance level of p<0.05 was used in all statistical tests performed to establish if groups were statistically different.
Results
Gross Description
Grafts were explanted from rats including 1cm of proximal native nerve with the entire graft and 1cm of distal nerve. Macroscopically, at 8 weeks, the grafts appeared healthy, but grossly shortened, and were measured to analyze this length change. The 2cm isografts largely maintained their length: 89±8% of the original length, while the 6cm grafts shrank to 67±6% of their original length. However, this contraction of the grafts did not place any stress on the coaptation sites, as both grafting scenarios were tension free.
Nerve regeneration within isografts
To consider nerve regeneration within the grafts, histomorphometric measurements were made at 8 weeks at distances of 1 and 2cm from the proximal coaptation (Figure 1A), which both maintains a consistent distance from the regenerating neurons in the spinal cord and from the proximal nerve containing the regenerating axons to enter the isografts. Long isografts had reduced fiber counts compared to short isografts, where long compared to short isografts at 1cm contained 11,878±2,399 fibers vs 20,501±4,081 fibers and at 2cm contained 12,701±4,154 fibers versus 18,717±5,064 fibers, respectively (Fig 1B). As expected, the number of regenerated axons is higher than that of uninjured nerve secondary to sprouting.26 The percent nerve did not differ at either of the two distances between the isograft groups (range: 17-27%; Fig 1C). The percent debris did not differ at 1cm between the isograft groups: the long compared to short isografts were 6±2% versus 10±6%. However, at 2cm there was increased percent debris in the long compared to short isograft, 21±8% versus 11±5%, respectively (Fig 1D).
Figure 1. Nerve regeneration within long and short isografts.
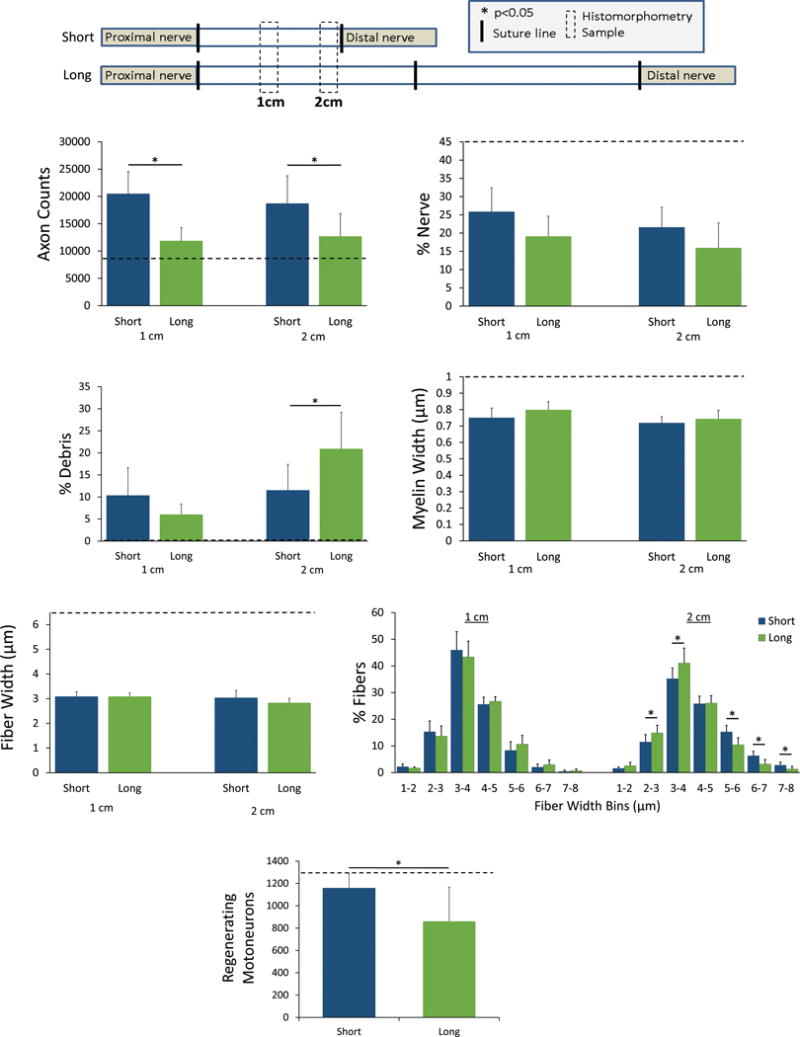
A) Analysis was performed at consistent distances (1 & 2cm) from the spinal cord and proximal suture site to compare regeneration within grafts after 8 weeks, such that the only variable was graft length. B) Axon counts were reduced in the long (6cm) compared to short (2cm) grafts. C) While percent nerve did not differ based on graft length, long grafts had greater percent debris (D) compared to short grafts. Myelin width (E) and fiber width (F) did not differ between grafts. G) Binning of fiber widths showed that long grafts shifted toward smaller widths compared to short grafts. H) Applying retrograde tracer at the 2cm distance, the number of regenerating motoneurons labeled was decreased in long compared to short grafts; the uninjured nerve metric denotes the baseline number of motoneurons. * p<0.05, n=8 per group, dashed line indicates the uninjured nerve metric.
Considering fiber size, there was a shift toward more immature fibers in long isografts compared to short isografts. While the mean myelin width was not different between the isograft groups (range: 0.70-0.80μm; Fig 1E), the mean axon width was decreased for long isografts compared to short isografts at the 2cm distance: 1.35±0.12μm versus 1.60±0.23μm, respectively (Fig 1F). Binning the fiber widths and comparing the percentage within each width range showed a shift at the 2cm distance toward lower widths in the long isograft (Fig 1G).
Using a fluorescent tracer placed 1cm from the proximal coaptation in the isograft groups, the number of motoneurons extending axons to this distance was measured. Similar to the histomorphometric analysis, the long isografts had fewer motoneurons regenerate their axons to the 1cm distance compared to short isografts, as 862±305 motoneurons compared to 1,160±129 motoneurons were labeled with tracer, respectively (Fig 1H). Overall, the data demonstrate long isografts do not support axon regeneration within the graft environment to the same extent as short isografts.
Cell populations within isografts
General nerve support cell populations were assessed 2cm from the proximal suture line at a 4 week endpoint. Cell density amongst the groups was similar, so data was represented as percentage of cell populations (Table 1). There were similar amounts of SCs (S100β+) in the grafts (~80%), although both were lower than that in normal nerve (~90%). The percent of proliferative SCs (S100β+, Ki67+) was higher in both grafts (~30%) compared to normal nerve but not different between graft lengths. Similarly, the percent of macrophages (CD68+) and activated stromal cells (α-SMA+) was not different between either graft (~8% and ~20%, respectively), but both grafts were higher than normal nerve. Overall, the data demonstrated that both grafts had pro-regenerative environments, but there were no differences in general nerve support cell populations within graft microenvironments.
Table I.
Cell populations within nerve grafts 2cm distal from the proximal graft coaptation at the 4 week endpoint (n=4 per group)
| Group | % SCs (S100+) of total cells | % Proliferative SCs (S100+/Ki-67+) of total SCs | % Macrophages (CD68+) of total cells | % Activated stromal cells (α-SMA+) of total cells |
|---|---|---|---|---|
| Short (2cm) | 79 ± 5 | 35 ± 8 | 7 ± 2 | 20 ± 7 |
| Long (6cm) | 77 ± 4 | 28 ± 5 | 8 ± 1 | 22 ± 5 |
| Uninjured Nerve | 90 ± 6 | 1 ± 2 | 3 ± 1 | 1 ± 1 |
Onset of senescence near and within isografts
To further assess the graft microenvironments, portions of the grafts and proximal nerve were assessed for markers of stress and cell senescence. At 4 weeks, the proximal native nerve and grafts had differential staining for SAβ-gal based on the graft length (Fig 2A). Long isografts had increased SAβ-gal positive areas (+), where proximal nerve contained 39±25% compared to 5±4% SAβ-gal(+) areas and graft contained 56±19% compared to 26±6% SAβ-gal(+) areas (Fig 2A). By 8 weeks, the differences in Saβ-gal(+) staining amongst the groups was diminished (Fig 2A).
Figure 2. Senescence markers associated with long and short isografts.
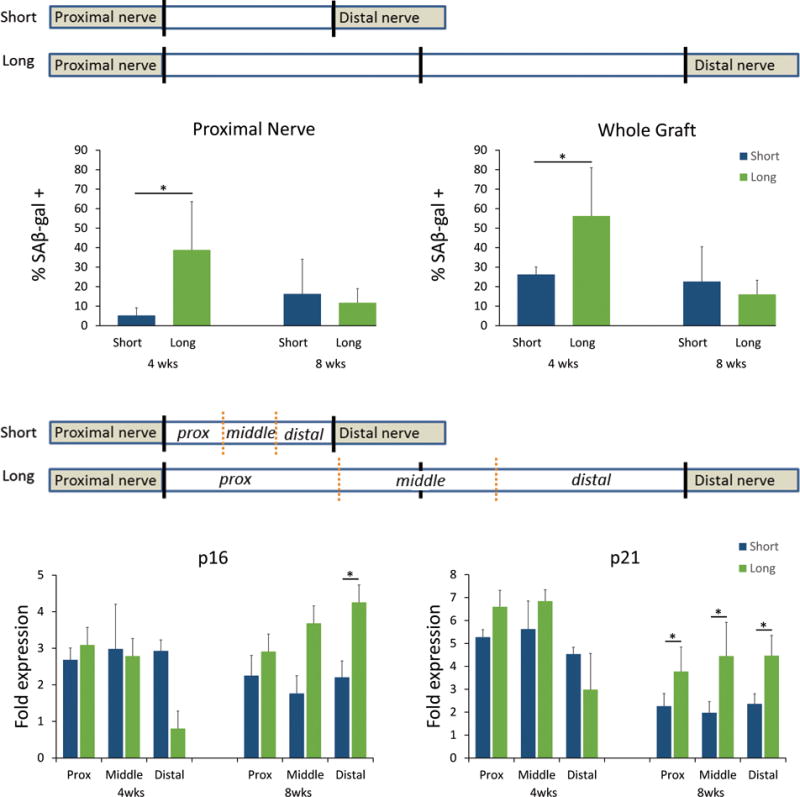
At an early 4 week endpoint, long isografts had an impact on SAβ-gal activity in the nerve proximal to the graft and as well as in the graft (A). Gene expression for senescence markers, p16 and p21 (B), were elevated compared to normal nerve but not different between grafts at 4 weeks. However, by 8 weeks, regions of the long graft had elevated p16 and p21 expression compared to the short graft. * p<0.05, n=4-6 per group.
To more precisely quantify the onset of senescence, grafts were divided into proximal, middle, and distal portions for quantitative gene analysis relative to uninjured nerve. Two markers of cellular stress and senescence, p16 and p21, were elevated in either graft at 4 weeks (Fig 2B). However, after 8 weeks, all portions of the long graft had higher expression of p21 compared to the short graft and the distal portion of the long graft also had significantly elevated p16 (Fig 2B). Furthermore, high resolution histology revealed that the proximal and distal portions of the short graft demonstrated relatively normal SCs, as nuclei displayed evenly spaced compact chromatin around the nuclear edges (Fig 3A). While these characteristics are maintained in SCs within the proximal aspect of the long graft, in the distal long graft, the SC chromatin is enlarged and clumped, consistent with stress related changes (Fig 3B).27 Overall, the data demonstrate that long isografts accumulated greater quantities of senescent markers and atypical SCs compared to short isografts.
Figure 3. Schwann cell associated changes within long and short isografts.
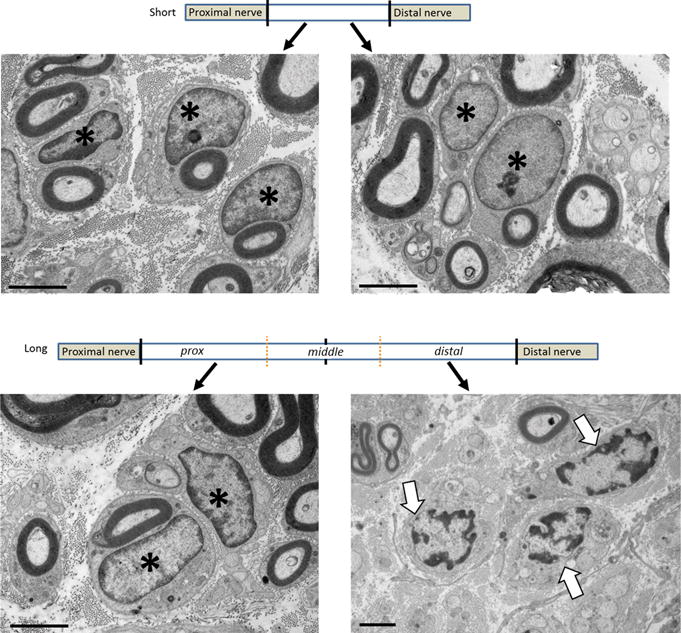
Eight weeks following grafting, electron micrographs of both the proximal and distal portions of the short graft show SCs with normally distributed chromatin around the edges of the nuclei (A). While this chromatin structure is maintained in the proximal aspect of the long graft, the chromatin becomes clumped and scattered within SCs in the distal long graft (B). Scale bar = 200μm. * indicates normal SCs, arrows denote abnormal chromatin
Discussion
Although considered the “gold standard” treatment for nerve defects, outcomes with nerve autografts often do not achieve original levels of function. To determine contributing factors to outcomes from autografting, we assessed the impact of the graft microenvironment on axon regeneration. We examined axon regeneration across short versus long isografts reconstructing a rat sciatic nerve defect, where we found that long compared to short isografts support disproportionately reduced regeneration when measuring regeneration at the same distance to the proximal coaptation site. While much research has established that fewer axons regenerate across longer grafts6,19, we have determined that axon regeneration within the autograft is not supported to the same extent based on the graft length. We also found that stressed cells accumulated and persisted in long compared to short grafting scenarios, which was associated with this decreased axon regeneration.
We first quantified regeneration in grafts by measuring axon numbers at the same distance from the proximal coaptation. These measurements showed a ~40% decrease in the number of fibers within long compared to short grafts when controlling for regenerative time and location. Moreover, retrograde labeling shows fewer motoneurons regenerated axons within the long compared to short graft. Additionally, axon regeneration in the longer grafts resulted in greater numbers of immature fibers compared to short grafts. Therefore, these data provide additional factors to explain why fewer axons regenerate across long nerve grafts. In addition to diminished axon regeneration across grafts due to the greater regenerative distance to reach the distal nerve and end-organ target, our data demonstrate longer grafts impact axon regeneration at even short distances within the graft.
To begin looking for a mechanism responsible for decreased axon regeneration within long isografts, we considered changes to the graft microenvironment, including differing cell populations and their status. Surprisingly, the cell density and relative percentages of major nerve cell types within the grafts were similar regardless of graft length. However, long grafts accumulated a greater proportion of stressed markers relatively early in regeneration. Additionally, the length of the graft affected the proportion of the proximal native nerve showing markers of stress suggesting the graft microenvironment may affect the process of regeneration proximal to the graft itself. SAβ-gal staining is a colorimetric assay specific to stressed cells undergoing senescence28,29 while p16 and p21 are kinases that are upregulated in cellular stress.29,30 Stress induced by DNA damage-related processes increases p21 expression and this marker was significantly elevated compared to the short graft at the longer time point. In contrast, p16, showed greater expression in only the distal long graft at the later time point. These markers are associated with different transcription pathways of cellular stress and could indicate different therapeutic interventions to improve regeneration.28–30
An increase in cells expressing markers of stress, and stress markers in general, has previously been associated with poor outcomes, where this relationship is established for acellular nerve allografts.19,22 Additionally, cells expressing stress markers do not function as normal cells.28,29 While the impact of senescent cells in nerve is unclear, these results provide additional evidence suggesting that senescent cells in nerve have a causal role in reduced regeneration.
While the increased cellular stress in a nerve graft is likely multifactorial, a probable significant component is ischemic stress, which can induce cellular stress. Prior work has shown that long isografts (6cm) revascularize throughout the graft by 5 days in vivo,31 but even that short period may be sufficient for stress-related changes in the SCs and deleterious effects on regeneration. In animal studies, the use of vascularized as opposed to non-vascularized nerve grafts showed faster return of motor unit potentials as well as a greater number of mature myelinated axons earlier in the regenerative process.32–34 In a case report, Mackinnon et al found that vascularized grafting of the median nerve resulted in greater histologic regeneration and sensory recovery compared to a non-vascularized cable in the same reconstruction.35 Furthermore, a randomized study of large nerve reconstructions (median, ulnar, radial, axillary) over lengths up to 10cm did show faster regeneration and improved clinical outcomes with vascularized sural grafts.36 Overall, these data indicate that vascularization of graft is critical. Additionally, factors such as age, quality of the wound bed, and even time from denervation likely play a role in affecting regeneration across vascularized versus conventional grafts. Linking cellular stress to graft length and vascularity, in addition to these other variables may help elucidate these clinical decisions.
In conclusion, these data indicate a factor contributing to regeneration across long autografts is not just the longer time needed for axons to cross the long graft, but that long grafts create a graft microenvironment that immediately impacts axon regeneration. Thus, in addition to muscle atrophy and chronic denervation of the distal nerve, graft length should be considered a factor affecting recovery after nerve injury treatments. These results demonstrate that cell changes within the autograft secondary to length in this study impact axon and motoneuron regeneration.
Acknowledgments
This work was supported in part by the National Institutes of Neurological Disorders and Stroke of the National Institutes of Health (NIH) under award number R01 NS086773 to Washington University and in part by the Plastic Surgery Foundation under award ID 346670 to Wood through Washington University. The content is solely the responsibility of the authors and does not represent the views of the NIH, the Plastic Surgery Foundation, or Washington University.
Footnotes
Financial Disclosure Statement: The authors have the following to disclose: None
Presented at: American Society for Surgery of the Hand 2016 meeting in Austin, Tx and the Plastic Surgery Research Council 2017 meeting in Durham, NC.
Disclosures
None of the authors has a financial interest in any of the products, devices, or drugs mentioned in this manuscript.
References
- 1.Weber RA, Breidenbach WC, Brown RE, Jabaley ME, Mass DP. A randomized prospective study of polyglycolic acid conduits for digital nerve reconstruction in humans. Plast Reconstr Surg. 2000;106(5):1036–1045. doi: 10.1097/00006534-200010000-00013. discussion 1046-1038. [DOI] [PubMed] [Google Scholar]
- 2.Eisenschenk A, Lehnert M. Sensory recovery after finger replantation. Handchir Mikrochir Plast Chir. 1993;25(4):191–195. [PubMed] [Google Scholar]
- 3.Wang WZ, Crain GM, Baylis W, Tsai TM. Outcome of digital nerve injuries in adults. J Hand Surg Am. 1996;21(1):138–143. doi: 10.1016/s0363-5023(96)80167-5. [DOI] [PubMed] [Google Scholar]
- 4.Socolovsky M, Di Masi G, Battaglia D. Use of long autologous nerve grafts in brachial plexus reconstruction: factors that affect the outcome. Acta Neurochir (Wien) 2011;153(11):2231–2240. doi: 10.1007/s00701-011-1131-1. [DOI] [PubMed] [Google Scholar]
- 5.Wolfe SW, Johnsen PH, Lee SK, Feinberg JH. Long-nerve grafts and nerve transfers demonstrate comparable outcomes for axillary nerve injuries. J Hand Surg Am. 2014;39(7):1351–1357. doi: 10.1016/j.jhsa.2014.02.032. [DOI] [PubMed] [Google Scholar]
- 6.Bertelli JA, Taleb M, Mira JC, Ghizoni MF. Functional recovery improvement is related to aberrant reinnervation trimming. A comparative study using fresh or predegenerated nerve grafts. Acta neuropathologica. 2006;111(6):601–609. doi: 10.1007/s00401-005-0005-0. [DOI] [PubMed] [Google Scholar]
- 7.Fu SY, Gordon T. Contributing factors to poor functional recovery after delayed nerve repair: prolonged denervation. The Journal of neuroscience : the official journal of the Society for Neuroscience. 1995;15(5 Pt 2):3886–3895. doi: 10.1523/JNEUROSCI.15-05-03886.1995. [DOI] [PMC free article] [PubMed] [Google Scholar]
- 8.Gordon T, Yang JF, Ayer K, Stein RB, Tyreman N. Recovery potential of muscle after partial denervation: a comparison between rats and humans. Brain research bulletin. 1993;30(3-4):477–482. doi: 10.1016/0361-9230(93)90281-f. [DOI] [PubMed] [Google Scholar]
- 9.Gordon T, Tyreman N, Raji MA. The basis for diminished functional recovery after delayed peripheral nerve repair. The Journal of neuroscience : the official journal of the Society for Neuroscience. 2011;31(14):5325–5334. doi: 10.1523/JNEUROSCI.6156-10.2011. [DOI] [PMC free article] [PubMed] [Google Scholar]
- 10.Kobayashi J, Mackinnon SE, Watanabe O, et al. The effect of duration of muscle denervation on functional recovery in the rat model. Muscle & nerve. 1997;20(7):858–866. doi: 10.1002/(sici)1097-4598(199707)20:7<858::aid-mus10>3.0.co;2-o. [DOI] [PubMed] [Google Scholar]
- 11.Brushart TM, Tarlov EC, Mesulam MM. Specificity of muscle reinnervation after epineurial and individual fascicular suture of the rat sciatic nerve. J Hand Surg Am. 1983;8(3):248–253. doi: 10.1016/s0363-5023(83)80152-x. [DOI] [PubMed] [Google Scholar]
- 12.Brushart TM. Neurotropism and neurotrophism. J Hand Surg Am. 1987;12(5 Pt 1):808–809. doi: 10.1016/s0363-5023(87)80078-3. [DOI] [PubMed] [Google Scholar]
- 13.Brushart TM. Preferential reinnervation of motor nerves by regenerating motor axons. The Journal of neuroscience : the official journal of the Society for Neuroscience. 1988;8(3):1026–1031. doi: 10.1523/JNEUROSCI.08-03-01026.1988. [DOI] [PMC free article] [PubMed] [Google Scholar]
- 14.Hoke A, Redett R, Hameed H, et al. Schwann cells express motor and sensory phenotypes that regulate axon regeneration. The Journal of neuroscience : the official journal of the Society for Neuroscience. 2006;26(38):9646–9655. doi: 10.1523/JNEUROSCI.1620-06.2006. [DOI] [PMC free article] [PubMed] [Google Scholar]
- 15.Madison RD, Archibald SJ, Brushart TM. Reinnervation accuracy of the rat femoral nerve by motor and sensory neurons. The Journal of neuroscience : the official journal of the Society for Neuroscience. 1996;16(18):5698–5703. doi: 10.1523/JNEUROSCI.16-18-05698.1996. [DOI] [PMC free article] [PubMed] [Google Scholar]
- 16.Robinson GA, Madison RD. Preferential motor reinnervation in the mouse: comparison of femoral nerve repair using a fibrin sealant or suture. Muscle & nerve. 2003;28(2):227–231. doi: 10.1002/mus.10422. [DOI] [PubMed] [Google Scholar]
- 17.Madison RD, Robinson GA, Chadaram SR. The specificity of motor neurone regeneration (preferential reinnervation) Acta physiologica. 2007;189(2):201–206. doi: 10.1111/j.1748-1716.2006.01657.x. [DOI] [PubMed] [Google Scholar]
- 18.Madison RD, Robinson GA. Accuracy of regenerating motor neurons: influence of diffusion in denervated nerve. Neuroscience. 2014;273:128–140. doi: 10.1016/j.neuroscience.2014.05.016. [DOI] [PMC free article] [PubMed] [Google Scholar]
- 19.Saheb-Al-Zamani M, Yan Y, Farber SJ, et al. Limited regeneration in long acellular nerve allografts is associated with increased Schwann cell senescence. Experimental neurology. 2013;247C:165–177. doi: 10.1016/j.expneurol.2013.04.011. [DOI] [PMC free article] [PubMed] [Google Scholar]
- 20.Mackinnon SE, Hudson AR, Hunter DA. Histologic assessment of nerve regeneration in the rat. Plast Reconstr Surg. 1985;75(3):384–388. doi: 10.1097/00006534-198503000-00014. [DOI] [PubMed] [Google Scholar]
- 21.Keune JD, Brenner MJ, Schwetye KE, et al. Temporal factors in peripheral nerve reconstruction with suture scaffolds: an experimental study in rodents. Restorative neurology and neuroscience. 2006;24(3):181–190. [PubMed] [Google Scholar]
- 22.Poppler L, Ee X, Schellhardt L, et al. Axonal growth arrests after an increased accumulation of Schwann cells expressing senescence markers and stromal cells in acellular nerve allografts. Tissue Eng Part A. 2016 doi: 10.1089/ten.tea.2016.0003. [DOI] [PMC free article] [PubMed] [Google Scholar]
- 23.Yan Y, Wood MD, Hunter DA, Ee X, Mackinnon SE, Moore AM. The Effect of Short Nerve Grafts in Series on Axonal Regeneration Across Isografts or Acellular Nerve Allografts. J Hand Surg Am. 2016;41(6):e113–121. doi: 10.1016/j.jhsa.2016.01.009. [DOI] [PubMed] [Google Scholar]
- 24.Hayashi A, Moradzadeh A, Hunter DA, et al. Retrograde labeling in peripheral nerve research: it is not all black and white. J Reconstr Microsurg. 2007;23(7):381–389. doi: 10.1055/s-2007-992344. [DOI] [PubMed] [Google Scholar]
- 25.Choi D, Li D, Raisman G. Fluorescent retrograde neuronal tracers that label the rat facial nucleus: a comparison of Fast Blue, Fluoro-ruby, Fluoro-emerald, Fluoro-Gold and Dil. Journal of neuroscience methods. 2002;117(2):167–172. doi: 10.1016/s0165-0270(02)00098-5. [DOI] [PubMed] [Google Scholar]
- 26.Mackinnon SE, Dellon AL, O’Brien JP. Changes in nerve fiber numbers distal to a nerve repair in the rat sciatic nerve model. Muscle & nerve. 1991;14(11):1116–1122. doi: 10.1002/mus.880141113. [DOI] [PubMed] [Google Scholar]
- 27.Narita M, Nunez S, Heard E, et al. Rb-mediated heterochromatin formation and silencing of E2F target genes during cellular senescence. Cell. 2003;113(6):703–716. doi: 10.1016/s0092-8674(03)00401-x. [DOI] [PubMed] [Google Scholar]
- 28.Ben-Porath I, Weinberg RA. The signals and pathways activating cellular senescence. The international journal of biochemistry & cell biology. 2005;37(5):961–976. doi: 10.1016/j.biocel.2004.10.013. [DOI] [PubMed] [Google Scholar]
- 29.Campisi J, d’Adda di Fagagna F. Cellular senescence: when bad things happen to good cells. Nature reviews Molecular cell biology. 2007;8(9):729–740. doi: 10.1038/nrm2233. [DOI] [PubMed] [Google Scholar]
- 30.Atanasoski S, Boller D, De Ventura L, et al. Cell cycle inhibitors p21 and p16 are required for the regulation of Schwann cell proliferation. Glia. 2006;53(2):147–157. doi: 10.1002/glia.20263. [DOI] [PubMed] [Google Scholar]
- 31.Farber SJ, Hoben GM, Hunter DA, et al. Vascularization is delayed in long nerve constructs compared with nerve grafts. Muscle & nerve. 2016;54(2):319–321. doi: 10.1002/mus.25173. [DOI] [PMC free article] [PubMed] [Google Scholar]
- 32.Donzelli R, Capone C, Sgulo FG, Mariniello G, Maiuri F. Vascularized nerve grafts: an experimental study. Neurological research. 2016;38(8):669–677. doi: 10.1080/01616412.2016.1198527. [DOI] [PubMed] [Google Scholar]
- 33.Iwai M, Tamai S, Yajima H, Kawanishi K. Experimental study of vascularized nerve graft: evaluation of nerve regeneration using choline acetyltransferase activity. Microsurgery. 2001;21(2):43–51. doi: 10.1002/micr.1007. [DOI] [PubMed] [Google Scholar]
- 34.Koshima I, Harii K. Experimental study of vascularized nerve grafts: multifactorial analyses of axonal regeneration of nerves transplanted into an acute burn wound. J Hand Surg Am. 1985;10(1):64–72. doi: 10.1016/s0363-5023(85)80249-5. [DOI] [PubMed] [Google Scholar]
- 35.Mackinnon SE, Kelly L, Hunter DA. Comparison of regeneration across a vascularized versus conventional nerve graft: case report. Microsurgery. 1988;9(4):226–234. doi: 10.1002/micr.1920090403. [DOI] [PubMed] [Google Scholar]
- 36.Doi K, Tamaru K, Sakai K, Kuwata N, Kurafuji Y, Kawai S. A comparison of vascularized and conventional sural nerve grafts. J Hand Surg Am. 1992;17(4):670–676. doi: 10.1016/0363-5023(92)90315-g. [DOI] [PubMed] [Google Scholar]