

Abstract
Infant feeding is a well‐established topic of interest in obesity research, yet few studies have focused on contributions of nonmaternal caregivers (NMCs)—such as fathers, grandparents, and daycare providers—to infant feeding. Data from the Infant Care, Feeding and Risk of Obesity Project in North Carolina were used to investigate (a) which factors were associated with NMC feeding styles and (b) how NMCs' and mothers' feeding styles compared. Multivariate regression models utilizing random effects were used to analyse data from 108 NMCs who were identified by mothers as being heavily involved in infant feeding. Feeding styles were measured using the Infant Feeding Style Questionnaire. Several individual characteristics were important. Higher laissez faire‐attention scores were reported by men and NMCs who lived in the same household as infant. Men reported higher indulgent‐coax and indulgent‐pamper scores. Perceptions of fussier infants, older infant age, and higher infant weight‐for‐length z‐scores were also important. Mothers' and NMCs' feeding styles differed. Compared with mothers, grandparents reported lower laissez faire and indulgent‐permissive scores. Fathers reported higher pressure‐soothe and indulgent scores. Daycare providers reported higher restriction‐diet quality and responsive satiety. Feeding styles were also predicted to change over time for all caregiver types. These findings highlight the importance of helping all caregivers develop skills that will promote optimal infant feeding outcomes. Given the paucity of research in this area, it is important to improve our understanding of what influences caregivers' feeding styles, especially among diverse populations, and how exposure to different feeding styles may shape children's obesity risk.
Keywords: daycare providers, fathers, feeding styles, grandparents, infant feeding
Key messages.
Nonmaternal caregivers and mothers report different feeding styles. Understanding how exposure to these different feeding styles influences longer term eating habits and nutritional outcomes is needed.
Caregiver characteristics, such as sex and living in the same household as infants, are associated with caregiver infant feeding styles. Future research should investigate why and how these may be related.
Interventions aimed at improving feeding styles should aim to reach all types of caregivers.
1. INTRODUCTION
Childhood obesity is a major health concern in the United States and worldwide, and feeding styles have become a well‐established topic of interest in obesity research (Birch & Fisher, 1998; Black & Aboud, 2011; Savage, Fisher, & Birch, 2007). Maternal use of food as a reward has been associated with higher unhealthy food consumption among children, whereas modelling has been associated with increased healthy food intake (Kröller & Warschburger, 2009). Higher levels of parental control have been associated with less desirable eating behaviours among children that may influence later eating habits and weight status, such as higher dietary restraint and disinhibition (Carper, Fisher, & Birch, 2000), higher levels of emotional eating (Haycraft & Blissett, 2012), higher levels of pickiness (Moroshko & Brennan, 2013), and more unhealthy snacking and higher body dissatisfaction (Brown & Ogden, 2004; Fisher & Birch, 1999a, 1999b). Parental control has been found to have complex associations with child body mass index (BMI) scores (Lloyd, Lubans, Plotnikoff, Collins, & Morgan, 2014; Vollmer, Adamsons, Foster, & Mobley, 2015) that highlight the importance of understanding more clearly the role feeding styles play in child development. Defined here as encompassing caregivers' beliefs and practices, feeding styles have been identified as both responses to and influences of infant and child weight status (Jansen et al., 2014; Thompson, Adair, & Bentley, 2013b). Although long‐term associations between infant feeding styles and growth outcomes have not been investigated thoroughly, some research has shown that feeding styles develop in infancy and can remain stable as children age (Blissett & Farrow, 2007; Duke, Bryson, Hammer, & Agras, 2004). It is important to understand how these feeding styles develop.
The vast majority of infant feeding research focuses on mothers and their children. Although mothers often are the primary caretakers responsible for feeding, nonmaternal caregivers (NMCs), such as fathers, grandmothers, and daycare providers, are frequently involved and are underrepresented in research. Given the literature that mothers' feeding styles are important and often have room for improvement, feeding styles of other caregivers who are heavily involved in feeding infants may also be important to understand. Fathers are among the most involved NMCs and report sharing the responsibility of feeding their children far more often than not (Khandpur, Blaine, Fisher, & Davison, 2014; Mallan et al., 2013; Wasser et al., 2013), and one study found that emotional overeating was associated with higher child BMI z‐scores when fathers reported higher restriction (Vollmer et al., 2015). However, there is little research dedicated to understanding how they feed their infants. Grandmothers are frequently cited as important advisors when it comes to infants' and children's nutrition (Aubel, 2012; Bentley, Gavin, Black, & Teti, 1999; Wasser et al., 2013), but their direct involvement in infant feeding is not well characterized. Finally, nearly one third of children under the age of five are in care provided by a nonrelative (Laughlin, 2013). Despite evidence that childcare providers can impact children's nutritional intake (Hughes et al., 2007) and growth (Benjamin et al., 2009; Kim & Peterson, 2008), the feeding styles employed by childcare providers have not been well researched.
It is important to understand how NMCs' feeding styles compare with mothers, particularly given evidence that co‐parenting and intergenerational conflicts can lead to overcompensation in feeding styles, such as firm restriction of palatable foods to counterbalance a caregiver who is perceived to be more indulgent of their child's food preferences (Eli, Howell, Fisher, & Nowicka, 2016; Khandpur, Charles, & Davison, 2016). Although one study has shown that maternal and paternal controlling and monitoring feeding styles may be correlated, there is a need to understand how these feeding styles compare in different populations (Lloyd et al., 2014). To fill this gap, the current study attempts to answer two primary research questions: (a) What kinds of factors are associated with the feeding styles of NMCs during infancy and (b) how do NMC feeding styles compare with those reported by mothers? To answer these questions, we used data from the Infant Care, Feeding and Risk of Obesity Project, a cohort study of African‐American mothers and their infants in central North Carolina. African‐American children are at higher risk of obesity throughout the life course compared with non‐Hispanic White and Asian‐American children (Flegal, Kruszon‐Moran, Carroll, Fryar, & Ogden, 2016; Ogden et al., 2016), and understanding how infant feeding occurs is one important step toward identifying ways to reduce this disparity.
2. METHODS
2.1. Study design and population
The Infant Care, Feeding and Risk of Obesity Project was a prospective cohort study of African‐American mother–infant dyads conducted between 2003 and 2007 in Orange, Wake, and Durham counties in central North Carolina (Slining, Adair, Goldman, Borja, & Bentley, 2009; Thompson et al., 2013b; Wasser et al., 2011; Wasser et al., 2013). This observational study was designed to assess household factors that influence infant feeding patterns, such as infant feeding styles and diet, and the risk of obesity. Healthy, first‐time mothers aged 18 to 35 years who were pregnant or had healthy infants less than 3 months of age (n = 217) were recruited from local Special Supplemental Food Program for Women, Infants, and Children clinics. Because some women were pregnant at the time of recruitment, age 35 was used as a cut point to exclude women who had a higher risk of delivering a baby with a congenital anomaly. Healthy mothers were identified as those who had no serious health problems requiring regular treatment and no history of substance abuse. Healthy infants were identified as those who completed at least 35 weeks of gestation, did not have a chronic or congenital illness, were not diagnosed with failure to thrive, and were not receiving medical treatment that might interfere with dietary intake or growth. The study consisted of in‐home interviews conducted when infants were 3, 6, 9, 12, and 18 months old.
2.2. Data collection
All study assessments were conducted face‐to‐face in the home by trained African‐American interviewers. During each interview, NMCs were identified through a series of three questions. Mothers were asked how many times the infant was usually fed in a day. Fifty percent of that number was calculated, and mothers were asked if anyone other than herself was involved in feeding the infant at least that many times per day. If mothers answered yes, they were asked to identify how that person was related to the infant. If both mothers and caregivers agreed, NMCs were interviewed in person. NMCs were categorized as fathers (biological and step‐fathers), grandparents (maternal and paternal grandmothers, great‐grandmothers, and grandfathers), daycare providers (licensed daycare centres and family daycare homes), and other caregivers (includes primarily extended family members and close friends but also a few babysitters and other types of childcare centres ). Because the “other caregivers” group includes many different types of caregivers, the results are presented in each figure and table but are not explored further in the discussion. Interviews (n = 180) were completed with 115 NMCs over the course of the study. Seven NMCs were excluded for incomplete or missing feeding style measures, yielding a final analytic sample of 108 NMCs and 167 interviews. Thirty‐eight NMCs in the final sample completed multiple visits.
2.3. Caregiver demographics and anthropometrics
Multiple demographic and anthropometric measures were collected for each adult participant and included in bivariate and multivariate analyses. Marital status was categorized as single (unmarried), married (including cohabiting with a partner), and other (such as divorced, separated, or widowed). Education was categorized as less than high school, high school degree, some college, and 4‐year college degree or higher. Maternal and caregiver height and weight were collected using standard methods and are described in detail elsewhere (Barrett, Thompson, & Bentley, 2016). NMCs' height and weight were collected during the first interview. These measurements were used to calculate BMI and BMI category (obesity categorized as BMI ≥ 30). Although it is also important to understand how age, race, and ethnicity may influence caregiver feeding styles, these measures were excluded due to incomplete data. Among the 71 participants for whom data were available, 66 (93%) self‐identified as African‐American or African‐American and some other race.
2.4. Infant anthropometrics
Infant anthropometric measurements were collected at each home visit with the infant's mother. Measurements were obtained using standard methods and are described in detail elsewhere (Barrett et al., 2016). Infant weight‐for‐length z‐scores (WLZ) were calculated using the Centers for Disease Control and Prevention and National Center for Health Statistics growth reference (Ogden et al., 2002) because the sample consisted of predominantly nonbreastfed infants and for consistency with previously published papers (Slining et al., 2009; Thompson et al., 2013b). Results did not differ when WLZ was calculated from the World Health Organization Multicenter Growth Reference Study (de Onis, Onyango, Van den Broeck, Chumlea, & Martorell, 2004).
2.5. Infant temperament
Infant activity, fussiness, and soothability were included as measures of infant temperament given their associations with feeding (Wasser et al., 2011) and growth outcomes (Slining et al., 2009). Mothers and NMCs were asked to rate infant activity and fussiness on a Likert‐type scale from 0 (not active/fussy at all) to 4 (excessively active/fussy) and soothability on a Likert‐type scale from 1 (very easy to soothe) to 6 (extremely difficult to soothe).
2.6. Infant feeding styles
Infant feeding styles were measured using the Infant Feeding Style Questionnaire (Thompson et al., 2009), which was administered orally to each caregiver during each interview. The Infant Feeding Style Questionnaire measured five constructs and 13 subconstructs presented in Table 1 and included questions that evaluated feeding beliefs and behaviours. Each item was measured on a 5‐point Likert‐type scale. The score for each subconstruct was calculated using the mean score for the items loading on each factor. Higher scores indicated higher levels of each feeding style. Cronbach's alpha coefficients were calculated for each subconstruct by each caregiver type. Similarly to those previously reported for mothers (range: 0.33–0.89; Thompson et al., 2013b), all but one subconstruct exceeded 0.60 (range: 0.51–0.76; restriction amount = 0.51), considered the threshold adequate for internal consistency (DeVellis, 1991), for NMCs as a group. Individually, each type of NMC generally exhibited adequate internal consistency: The range of scores for fathers was 0.40–0.83; for grandparents 0.35–0.80 (pressure soothe = 0.35; laissez faire‐diet quality = 0.36); for daycare providers 0.28–0.91 (indulgent permissive = 0.28); and for other caregivers 0.45–0.79.
Table 1.
Infant feeding styles measured by the Infant Feeding Style Questionnaire (Thompson et al., 2009)
| Feeding construct | Description | Subconstruct | Sample item |
|---|---|---|---|
| Pressure | Feeds child due to concerns that child is undereating. Feeds child to soothe. | Cereal | I give the child cereal in the bottle. |
| Finish | I try to get child to finish his/her food. | ||
| Soothe | The best way to make an infant stop crying is to feed him/her. | ||
| Restriction | Limits quantities of foods. Limits child to healthy foods. | Amount | I am careful not to feed him/her too much. |
| Diet quality | A toddler should never eat fast food. | ||
| Responsive | Attentive to child cues. Sets appropriate limits. Encourages exploration. | Attention | I talk to the child to encourage him/her to eat. |
| Satiety | I let the child decide how much to eat. | ||
| Laissez faire | Little or no interaction with child during feeding. No limits on food amount or type. | Attention | Child watches TV while eating. |
| Diet quality | A toddler should be able to eat whatever she/he wants for snacks. | ||
| Indulgent | Uses food instrumentally. Does not set demands or limits on child during feeding. | Coax | I allow the child to drink soda to make sure she/he gets enough. |
| Pamper | I allow the child to eat fast food to keep him/her happy. | ||
| Permissive | I allow the child to eat sweets if she/he wants. | ||
| Soothe | I allow the child to watch TV to keep him/her from crying. |
2.7. Statistical methods
Statistical analyses were conducted in STATA software (version 13.1; STATA Corporation, College Station, TX). Descriptive statistics examined variable distributions at each time point (3, 6, 9, 12, and 18 months). Cross‐sectional differences in sample characteristics and infant feeding styles between mothers and NMCs were first compared using t tests and Chi‐square tests for continuous and categorical variables, respectively. To answer the first research question, which characteristics are associated with NMC feeding styles, we tested for cross‐sectional associations between sample characteristics and NMC infant feeding styles using t tests or one‐way analysis of variance for categorical variables and Pearson's r for continuous variables. Sample characteristics that were significantly associated with NMC infant feeding styles at the p < .05 level included caregiver sex, education, obesity status, living in the same household as the infant, infant age, infant WLZ, and ratings of fussiness and hard to soothe (results not shown). These variables were included in multivariable random effects models. Any breastfeeding was tested but did not predict NMC feeding styles and was excluded from the final models.
To answer the second research question, how did NMC and maternal feeding styles differ, multivariable random effects models assessed how NMC infant feeding styles compared with maternal infant feeding styles. These models controlled for caregiver education, caregiver marital status, caregiver obesity status, if the caregiver lived in the household, visit, infant WLZ, activity and fussiness ratings, and repeated measure by infant. Control variables were selected based on previous literature (Thompson, 2013; Wasser et al., 2011) or if the difference between mothers and NMCs differed at the p < .05 level of significance. Caregiver sex (male or female) was omitted for collinearity with being a member of the household. The margins command in STATA was used to estimate predicted feeding style scores by caregiver type and visit adjusted for covariates.
For all models, significance is reported at p < .05. Because of the small sample size, the most parsimonious longitudinal models were selected based on the significance of bivariate assessments of covariates. Results should be considered exploratory for this small sample.
2.8. Ethics approval
The study and current analyses were approved by the School of Public Health Institutional Review Board at the University of North Carolina at Chapel Hill. Written informed consent was obtained in‐person from all participants. Data were de‐identified prior to analysis.
3. RESULTS
Sample characteristics for mothers, NMCs, and infants are presented in Table 2. The most frequent type of NMC was grandparents (39%), including one grandfather and nine great‐grandmothers. The remaining NMCs were distributed among fathers (19%), daycare providers (24%), and other caregivers (17%). Collectively, NMCs were generally older than mothers, had higher levels of education (the majority had some college or a college degree), and were more likely to be married or cohabiting with a partner. At 6 and 9 months, there were also significant differences between mothers and NMCs in their ratings of infant temperament, with NMCs generally rating infants as less active or less fussy. There were no significant differences in maternal age, education, marital status, or obesity between mothers who included an NMC in the study and those who did not (Table S1). The average age of fathers was 23 years, grandparents 54 years, daycare providers 36 years, and other caregivers 43 years (Table S2). More than half of grandparents and daycare providers were obese. Table S3 describes the number of NMCs who were identified at each time point and the percentage who participated in a visit.
Table 2.
Sample characteristics of mothers and nonmaternal caregivers (NMCs) by study visit (infant age)a
| Total sample | Study visit 3 months | 6 months | 9 months | 12 months | 18 months | |||||||
|---|---|---|---|---|---|---|---|---|---|---|---|---|
| Total (n) | Momsb 217 | NMCs 108b | Moms 58 | NMCs 58 | Moms 41 | NMCs 41 | Moms 28 | NMCs 28 | Moms 29 | NMCs 29 | Moms 15 | NMCs 15 |
| Mean ± SD/n (%) | ||||||||||||
| Infant characteristics | ||||||||||||
| Age (months) | 3.3 ± 0.3 | 6.4 ± 0.5 | 9.3 ± 0.4 | 12.6 ± 0.6 | 18.7 ± 1.3 | |||||||
| Female | 116 (53) | 25 (39) | 20 (46) | 14 (50) | 18 (60) | 10 (67) | ||||||
| Current WLZ | 0.7 ± 1.0 | 0.6 ± 0.9 | 0.4 ± 1.1 | 0.5 ± 1.1 | −0.1 ± 1.2 | |||||||
| Ever breastfed | 148 (68) | 34 (59) | 41 (100) | 28 (100) | 29 (100) | 15 (100) | ||||||
| Still breastfeeding | 6 (10) | 4 (10) | 3 (11) | 1 (3) | 1 (7) | |||||||
| Early complementary feeding | 167 (77) | 46 (79) | 32 (78) | 24 (86) | 24 (83) | 12 (80) | ||||||
| Activity rating | 2.8 ± 0.7 | 2.9 ± 0.7 | 3.1 ± 0.7 | 2.8 ± 0.6* | 3.2 ± 0.7 | 2.9 ± 0.5 | 3.2 ± 0.6 | 3.1 ± 0.5 | 3.5 ± 0.5 | 2.9 ± 0.6* | ||
| Fussiness rating | 1.2 ± 0.7 | 1.4 ± 0.9 | 1.1 ± 0.7 | 1.2 ± 0.9 | 1.1 ± 0.6 | 0.8 ± 0.8 | 1.2 ± 0.8 | 1.2 ± 0.8 | 1.0 ± 0.5 | 1.1 ± 0.8 | ||
| Difficult to soothe rating | 2.3 ± 1.0 | 2.2 ± 1.0 | 2.0 ± 0.9 | 1.8 ± 0.7 | 2.0 ± 0.9 | 1.8 ± 0.9 | 2.2 ± 1.1 | 1.9 ± 0.8 | 2.0 ± 0.9 | 1.5 ± 0.5 | ||
| Maternal and NMC characteristics | ||||||||||||
| Age (years) | 22.6 ± 3.8 | 41.1 ± 15.3 | 22.0 ± 3.5 | 45.6 ± 16.4*** | 22.8 ± 4.1 | 41.7 ± 13.9*** | 23.4 ± 3.7 | 34.7 ± 13.2*** | 24.7 ± 3.7 | 37.6 ± 13.2*** | 26.8 ± 6.1 | 35.7 ± 17.1 |
| Some college education or higher | 20 (34) | 37 (64)*** | 20 (49) | 37 (90)*** | 15 (54) | 25 (89)** | 20 (69) | 25 (86) | 7 (46) | 12 (80) | ||
| Married or cohabiting | 14 (24) | 21(36) | 8 (20) | 15 (37) | 6 (21) | 10 (36) | 8 (28) | 11 (38) | 6 (40) | 5 (33) | ||
| Obese (BMI ≥ 30) | 96 (44) | 61 (56) | 22 (38) | 23 (40) | 17 (41) | 24 (59) | 15 (54) | 16 (57) | 15 (52) | 16 (55) | 7 (47) | 12 (80) |
| Relationship to infant | ||||||||||||
| Father or step‐father | 23 (21) | 10 (17) | 7 (17) | 8 (29) | 7 (24) | 4 (27) | ||||||
| Grandparentc | 41 (38) | 22 (38) | 18 (44) | 11 (39) | 8 (28) | 4 (27) | ||||||
| Daycare provider | 23 (21) | 8 (14) | 10 (27) | 4 (14) | 9 (31) | 4 (27) | ||||||
| Other caregivers | 21 (20) | 10 (17) | 6 (15) | 5 (18) | 5 (17) | 3 (20) | ||||||
| NMC lives in household | 43 (40) | 26 (45) | 18 (44) | 12 (43) | 15 (52) | 3 (20) | ||||||
| NMC has children | 96 (89) | 55 (95) | 40 (98) | 28 (100) | 24 (83) | 12 (80) | ||||||
| Pressure feeding style scores | ||||||||||||
| Pressure‐cereal | 2.7 ± 0.9 | 2.7 ± 1.0 | 2.8 ± 1.0 | 2.8 ± 1.0 | 2.7 ± 0.9 | 2.9 ± 0.9 | 2.8 ± 1.1 | 2.6 ± 1.1 | 2.9 ± 1.0 | 2.8 ± 1.1 | 2.8 ± 1.0 | 2.0 ± 0.6* |
| Pressure‐finish | 2.5 ± 0.7 | 2.4 ± 0.8 | 2.1 ± 0.7 | 2.3 ± 0.9 | 2.2 ± 0.7 | 2.5 ± 0.9 | 2.4 ± 0.6 | 2.6 ± 0.8 | 2.5 ± 0.7 | 2.4 ± 0.7 | 2.7 ± 1.0 | 2.8 ± 0.9 |
| Pressure‐soothe | 2.1 ± 0.8 | 2.2 ± 0.9 | 2.2 ± 0.8 | 2.3 ± 0.8 | 1.9 ± 0.7 | 2.1 ± 1.0 | 2.1 ± 0.7 | 1.9 ± 0.7 | 2.2 ± 0.8 | 2.0 ± 0.9 | 2.3 ± 0.8 | 1.9 ± 0.8 |
| Restriction feeding style scores | ||||||||||||
| Restriction‐amount | 3.6 ± 0.9 | 4.0 ± 0.8 | 3.6 ± 0.9 | 4.1 ± 0.9** | 3.6 ± 1.0 | 4.0 ± 0.9 | 3.1 ± 0.9 | 3.9 ± 1.0** | 3.7 ± 0.9 | 3.9 ± 0.8 | 3.7 ± 0.7 | 3.7 ± 0.8 |
| Restriction‐diet quality | 2.9 ± 0.7 | 3.5 ± 0.8 | 3.3 ± 0.9 | 3.5 ± 0.7 | 2.6 ± 0.6 | 3.5 ± 1.0*** | 2.7 ± 0.6 | 3.7 ± 0.8*** | 2.7 ± 0.5 | 3.6 ± 0.7*** | 2.8 ± 0.5 | 3.8 ± 0.8** |
| Responsive feeding style scores | ||||||||||||
| Responsive‐attention | 3.5 ± 0.8 | 3.8 ± 0.9 | 3.5 ± 1.1 | 3.9 ± 0.9* | 3.2 ± 0.8 | 3.6 ± 1.0* | 3.3 ± 0.9 | 3.8 ± 0.8* | 3.4 ± 0.8 | 3.7 ± 0.8 | 3.7 ± 0.6 | 3.8 ± 1.0 |
| Responsive‐satiety | 4.4 ± 0.5 | 4.4 ± 0.5 | 4.5 ± 0.5 | 4.4 ± 0.4 | 4.3 ± 0.6 | 4.4 ± 0.6 | 4.3 ± 0.7 | 4.3 ± 0.6 | 4.4 ± 0.5 | 4.3 ± 0.6 | 4.5 ± 0.3 | 4.4 ± 0.3 |
| Laissez‐faire feeding style scores | ||||||||||||
| Laissez faire‐attention | 2.2 ± 0.7 | 1.8 ± 0.8 | 2.3 ± 0.7 | 1.8 ± 0.7*** | 2.3 ± 0.7 | 1.8 ± 0.8** | 2.2 ± 0.8 | 1.8 ± 0.9 | 2.3 ± 0.9 | 1.8 ± 0.9* | 2.7 ± 0.7 | 1.6 ± 0.7** |
| Laissez faire‐diet quality | 2.9 ± 0.6 | 1.8 ± 0.8 | 3.1 ± 0.5 | 1.6 ± 0.5*** | 2.7 ± 0.6 | 1.9 ± 0.9*** | 3.0 ± 0.7 | 2.0 ± 0.9*** | 3.1 ± 0.5 | 2.1 ± 0.8*** | 2.7 ± 0.7 | 2.0 ± 0.8a |
| Indulgent feeding style scores | ||||||||||||
| Indulgent‐coax | 1.4 ± 0.7 | 1.3 ± 0.5 | 1.3 ± 0.4 | 1.3 ± 0.4 | 1.3 ± 0.5 | 1.3 ± 0.4 | 1.4 ± 0.4 | 1.4 ± 0.6 | 1.5 ± 0.5 | 1.3 ± 0.4 | 1.6 ± 0.5 | 1.5 ± 0.7 |
| Indulgent‐pamper | 1.5 ± 0.5 | 1.3 ± 0.5 | 1.5 ± 0.5 | 1.3 ± 0.6 | 1.3 ± 0.5 | 1.3 ± 0.4 | 1.4 ± 0.4 | 1.3 ± 0.5 | 1.6 ± 0.6 | 1.2 ± 0.3*** | 1.6 ± 0.5 | 1.4 ± 0.6 |
| Indulgent‐permissive | 1.9 ± 0.7 | 1.7 ± 0.6 | 2.0 ± 0.7 | 1.8 ± 0.6* | 1.7 ± 0.7 | 1.7 ± 0.6 | 1.7 ± 0.5 | 1.6 ± 0.7 | 2.0 ± 0.6 | 1.8 ± 0.6 | 1.9 ± 0.5 | 1.6 ± 0.7 |
| Indulgent‐soothe | 1.4 ± 0.5 | 1.3 ± 0.4 | 1.4 ± 0.4 | 1.3 ± 0.4 | 1.3 ± 0.4 | 1.3 ± 0.4 | 1.4 ± 0.5 | 1.3 ± 0.5 | 1.5 ± 0.5 | 1.2 ± 0.3* | 1.5 ± 0.5 | 1.3 ± 0.6 |
Note. BMI = body mass index; WLZ = weight‐for‐length z‐scores.
Characteristics of and measures reported by mothers and NMCs were compared. Fisher's exact tested comparisons with categorical outcomes. T tests assessed comparisons with continuous outcomes. Sample characteristics of NMCs are available in Table S2.
All mothers enrolled at baseline (3‐month visit), inclusive of mothers with and without a NMC enrolled in the study.
Represents unique NMCs who completed an interview at one or more time points during the course of the study.
Includes great‐grandparents.
p < .05.
p < .01.
p < .001.
Several caregiver characteristics were significantly associated with feeding style subconstructs when adjusted for covariates (Table 3). These included being a male caregiver (higher laissez faire attention, indulgent coax, and indulgent pamper), caregiver obesity (lower laissez faire attention and indulgent permissive), and being a member of the household (higher laissez faire attention). Caring for older infants predicted higher laissez faire‐diet quality and lower pressure‐soothe scores. There were several differences in NMC feeding styles associated with infant characteristics in adjusted models. NMCs reported lower responsive‐attention scores when infants had higher WLZ scores and higher pressure‐soothe, laissez faire‐attention, and indulgent‐soothe feeding styles when they rated infants at higher levels of fussiness.
Table 3.
Predictors of nonmaternal caregiver (NMC) infant feeding stylesa
| PR‐cerealb | PR‐finish | PR‐soothe | RT‐amount | RT‐diet quality | RP‐attention | RP‐satiety | LF‐attention | LF‐diet quality | IN‐coax | IN‐pamper | IN‐permissive | IN‐soothe | |
|---|---|---|---|---|---|---|---|---|---|---|---|---|---|
| Coefficient (95% CI) | |||||||||||||
| NMC predictors | |||||||||||||
| Male | −0.06 (−0.52, 0.40) | 0.28 (−0.10, 0.66) | 0.37 (< −0.01, 0.74) | −0.03 (−0.42, 0.35) | 0.27 (−0.12, 0.68) | −0.35 (−0.74, 0.04) | −0.05 (−0.29, 0.18) | 0.62*** (0.30, 0.92) | 0.16 (−0.20, 0.53) | 0.38** (0.13, 0.62) | 0.37** (0.15, 0.59) | 0.21 (−0.09, 0.51) | 0.15 (−0.04, 0.34) |
| Education | −0.06 (−0.32, 0.20) | 0.07 (−0.15, 0.30) | −0.04 (−0.25, 0.16) | −0.10 (−0.32, 0.12) | −0.01 (−0.25, 0.22) | 0.13 (−0.10, 0.35) | −0.03 (−0.18, 0.12) | −0.16 (−0.35, 0.02) | −0.13 (−0.35, 0.08) | 0.04 (−0.09, 0.17) | −0.04 (−0.16, 0.09) | −0.07 (−0.23, 0.09) | −0.04 (−0.15, 0.06) |
| Obesity | −0.29 (−0.65, 0.07) | −0.02 (−0.32, 0.29) | −0.16 (−0.45, 0.13) | −0.06 (−0.37, 0.25) | 0.12 (−0.20, 0.44) | −0.04 (−0.35, 0.27) | −0.05 (−0.24, 0.15) | −0.28* (−0.53, −0.02) | −0.03 (−0.26, 0.32) | −0.07 (−0.26, 0.12) | −0.13 (−0.31, 0.05) | −0.25* (−0.49, −0.02) | −0.01 (−0.17, 0.14) |
| Household member | 0.37 (−0.13, 0.87) | −0.27 (−0.69, 0.16) | 0.11 (−0.29, 0.52) | 0.17 (−0.26, 0.59) | −0.10 (−0.54, 0.35) | −0.15 (−0.59, 0.28) | −0.01 (−0.28, 0.26) | 0.35* (0.01, 0.70) | −0.02 (−0.42, 0.39) | −0.04 (−0.30, 0.21) | −0.03 (−0.31, 0.05) | 0.03 (−0.30, 0.35) | 0.05 (−0.16, 0.26) |
| Infant predictors | |||||||||||||
| Visit (age) | −0.04 (−0.16, 0.09) | 0.05 (−0.06, 0.17) | −0.11* (−0.21, −0.01) | −0.11 (−0.22, 0.01) | −0.01 (−0.13, 0.10) | −0.05 (−0.16, 0.06) | −0.04 (−0.11, 0.04) | 0.02 (−0.07, 0.12) | 0.14* (0.03, 0.24) | 0.03 (−0.32, 0.10) | < 0.01 (−0.06, 0.07) | < 0.01 (−0.08, 0.08) | 0.02 (−0.03, 0.08) |
| WLZ | −0.01 (−0.20, 0.18) | −0.11 (−0.27, 0.04) | −0.12 (−0.27, 0.04) | −0.02 (−0.18, 0.14) | −0.01 (−0.17, 0.16) | −0.16* (−0.33, < −0.01) | 0.01 (−0.09, 0.11) | −0.10 (−0.22, 0.03) | −0.04 (−0.20, 0.16) | −0.09 (−0.19, 0.01) | −0.03 (−0.12, 0.05) | −0.06 (−0.18, 0.06) | −0.05 (−0.13, 0.03) |
| Fussiness | −0.02 (−0.24, 0.19) | 0.15 (−0.03, 0.34) | 0.18* (0.02, 0.35) | 0.10 (−0.09, 0.28) | −0.11 (−0.30, 0.08) | 0.18 (−0.01, 0.37) | 0.09 (−0.03, 0.21) | 0.23** (0.07, 0.39) | −0.02 (−0.20, 0.16) | 0.09 (−0.02, 0.20) | 0.09 (−0.02, 0.20) | 0.12 (−0.02, 0.25) | 0.11* (0.01, 0.21) |
|
Hard to soothe |
0.13 (−0.08, 0.34) | −0.12 (−0.30, 0.06) | 0.06 (−0.11, 0.23) | 0.04 (−0.14, 0.22) | −0.01 (−0.17, 0.20) | −0.08 (−0.26, 0.10) | −0.02 (−0.14, 0.10) | 0.07 (−0.08, 0.22) | < 0.01 (−0.17, 0.17) | 0.01 (−0.10, 0.12) | 0.07 (−0.04, 0.18) | 0.03 (−0.11, 0.17) | 0.04 (−0.05, 0.14) |
Note. WLZ = weight‐for‐length z‐scores.
Random effects models tested longitudinal associations.
PR = Pressure; RT = Restrictive; RP = Responsive; LF = Laissez faire; IN = Indulgent.
p < .05.
p < .01.
p < .001.
When comparing feeding styles between mothers and NMCs, multiple feeding style subconstructs differed significantly at each visit (Table 2). NMCs collectively reported lower pressure‐cereal, laissez faire‐attention, laissez faire‐diet quality, indulgent‐pamper, indulgent‐permissive, and indulgent‐soothe feeding style scores compared with mothers. They also reported higher restriction‐amount, restriction‐diet quality, and responsive‐attention scores. The differences in restriction amount (β = 0.47; 95% CI [0.14, 0.81]), restriction‐diet quality (β = 0.53; 95% CI [0.22, 0.83]), and laissez faire‐diet quality (β = −1.19; 95% CI [−1.45, −0.93]) remained in models adjusted for covariates (Table S4).
There were also many significant differences between mothers and different types of NMCs in the adjusted models (see Table S4 for complete results). Compared with mothers, higher restriction‐diet quality scores were reported by all NMC types: fathers (β = 0.75; 95% CI [0.40, 1.09]), grandparents (β = 0.34; 95% CI [0.01, 0.66]), daycare providers (β = 0.67; 95% CI [0.18, 1.17]), and other caregivers (β = 0.59; 95% CI [0.14, 1.03]; Figure 1). For all caregivers, predicted restriction‐diet quality scores were highest at the 3‐month visit and declined at later visits. Lower laissez faire‐attention scores were reported by grandparents (β = −0.54; 95% CI [−0.83, −0.24]) and daycare providers (β = −0.72; 95% CI [−1.15, −0.28]; Figure 2). Predicted laissez faire‐attention scores rose for all caregivers between the 12‐ and 18‐month visits. Lower laissez faire‐diet quality scores were associated with all NMC types: fathers (β = −1.10; 95% CI [−1.40, −0.80]), grandparents (β = −1.26; 95% CI [−1.55, −0.97]), daycare providers (β = −1.17; 95% CI [−1.61, −0.74]), and other caregivers (β = −1.21; 95% CI [−1.60, −0.82]; Figure 3). For all caregivers, predicted laissez faire‐diet quality scores declined from the 3‐ to 6‐month visit and rose again before declining at the 18‐month visit. Indulgent‐coax scores were higher among fathers (β = 0.21; 95% CI [0.01, 0.41]) and lower among daycare providers (β = −0.33; 95% CI [−0.62, −0.04]) compared with mothers (Figure 4). Predicted indulgent‐coax scores were lowest between the 3‐ and 6‐month visits and rose gradually thereafter for all caregivers.
Figure 1.
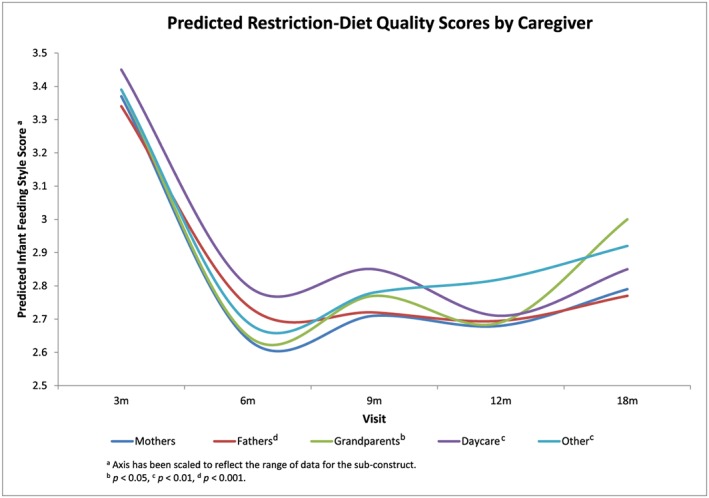
Predicted restriction‐diet quality scores by caregiver
Figure 2.
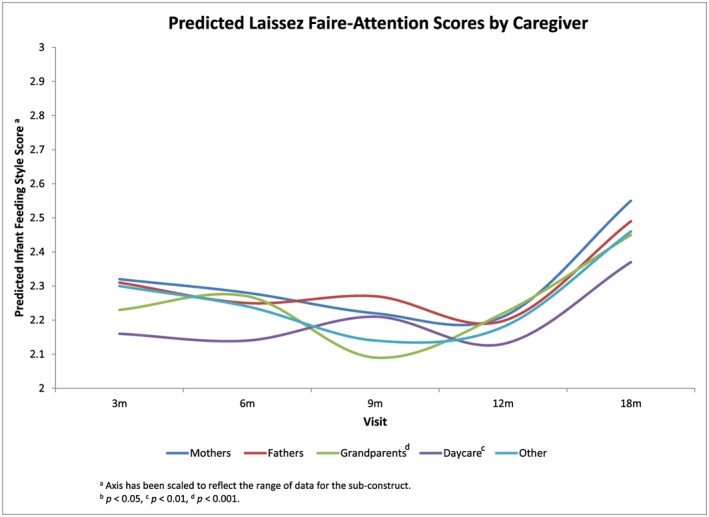
Predicted laissez faire‐attention scores by caregiver
Figure 3.
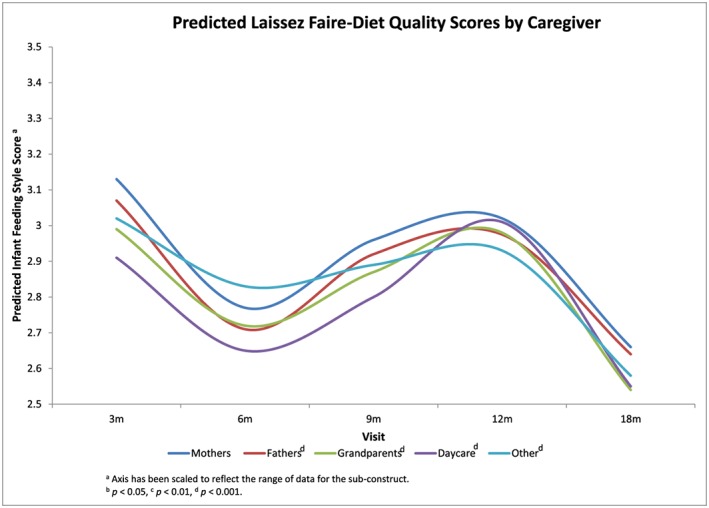
Predicted laissez faire‐diet quality scores by caregiver
Figure 4.
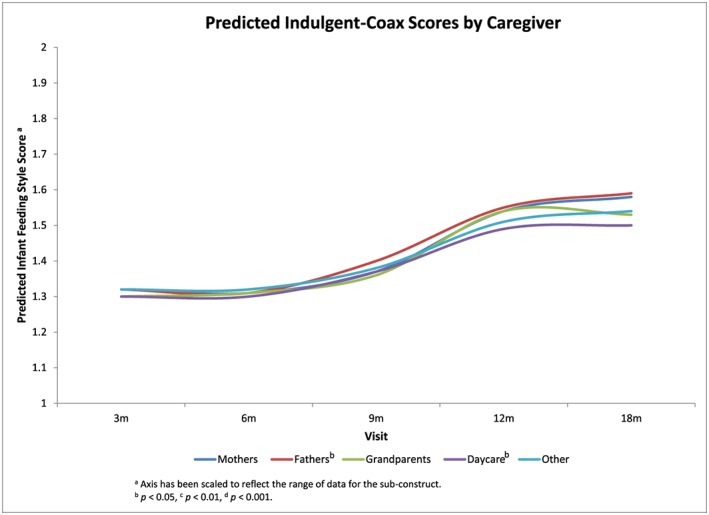
Predicted indulgent‐coax scores by caregiver
Additionally, fathers reported higher pressure‐soothe (β = 0.48; 95% CI [0.15, 0.82]), restriction‐amount (β = 0.48; 95% CI [0.15, 0.82]), indulgent‐coax (β = 0.48; 95% CI [0.15, 0.82]), and indulgent‐pamper (β = 0.48; 95% CI [0.15, 0.82]) feeding style scores compared with mothers. Grandparents also reported lower indulgent‐permissive feeding styles (β = −0.31; 95% CI [−0.59, −0.04]). Daycare providers reported higher responsive‐satiety scores (β = 0.42; 95% CI [0.08, 0.77]). Other caregivers reported higher restriction‐amount scores (β = 0.64; 95% CI [0.15, 1.13]).
4. DISCUSSION
In this study, we identified that several NMC and infant characteristics, such as caregiver sex, education, obesity status, living in the same household as the infant, and infant age, size, and temperament, were associated with NMC infant feeding styles. We also documented multiple differences in the infant feeding styles of NMCs and mothers. NMCs tended to report lower laissez‐faire and higher restriction feeding styles, and the differences among subconstructs varied by type of caregiver.
Several caregiver characteristics predicted NMC feeding styles. Being a male caregiver predicted higher laissez faire‐attention, indulgent‐coax, and indulgent‐pamper scores. The vast majority of male caregivers were fathers, and our findings are similar to reports from qualitative studies in which fathers have reported incentivizing consumption and rewarding with food (Khandpur, Charles, Blaine, Blake, & Davison, 2016; Khandpur, Charles, & Davison, 2016). Although less commonly reported than other feeding strategies, some fathers have stated they allow distractions such as watching TV during mealtimes (Khandpur, Charles, Blaine, et al., 2016). Being a member of the household was associated with higher laissez faire‐attention scores. This may be explained by the fact that household members excluded daycare centre providers, who were more likely to have received training in child development. Surprisingly, education was not associated with feeding styles in this study even though it is commonly associated with variations in feeding styles (Fisher & Birch, 1999b; Hodges et al., 2013). The high levels of education among NMCs, with more than three‐quarters having at least some college education, may account for the lack of a strong effect.
This study found several differences between feeding styles reported by NMCs and mothers. Grandparents were the most common type of NMC, and they generally reported lower laissez faire‐attention, laissez faire‐diet quality, and indulgent‐permissive scores compared with mothers. In other studies, some grandparents have been critical of parents for allowing children to snack before meals, not providing nutritionally balanced meals, and allowing inappropriate behaviour during mealtimes (Eli et al., 2016). Grandparents also may be more attentive to nutrition than they were when raising their own children, especially as they learn more about nutrition through their own experiences living with chronic diseases such as diabetes and hypertension (Higgins & Murray, 2010). Taken together, these findings may help explain why grandparents in this study are less laissez faire about infants' diet quality and attention during mealtime interactions. However, given the low Cronbach's alpha coefficient for laissez faire‐diet quality, these specific results should be interpreted with caution. More than half of the grandparent caregivers in this study lived in multigenerational households with the infant (n = 24; 57%). Previous studies have found that grandparents who live in multigenerational households or are more involved in childcare tend to report feeding practices similar to parents and less indulgence compared with grandparents who spend less time with their grandchildren (Eli et al., 2016; Farrow, 2014; Higgins & Murray, 2010).
In this cohort, fathers were more likely to report the use of food to modify infants' behaviour, as exhibited by higher pressure‐soothe, indulgent‐coax, and indulgent‐pamper scores. These findings may be supported by qualitative work that has shown that fathers are likely to report incentivizing consumption at mealtimes, including rewarding children with foods they like (Khandpur, Charles, Blaine, et al., 2016). Fathers in this study were also more likely to report higher restriction and lower laissez faire‐diet quality styles. The scant research that has investigated fathers' feeding beliefs and practices describes a wide range of experiences; consequently, findings on fathers' use of restriction are inconsistent. For example, studies conducted among caregivers of older children have reported that fathers monitor children's food intake quantity and quality less than mothers, and others have reported that fathers exert more control—including restriction—during mealtimes (Khandpur et al., 2014). In this study, fathers' reports of higher restriction and lower laissez faire‐diet quality may reflect efforts to promote children's consumption of healthy foods. Concern that snacking reduces children's appetite and consumption of healthy foods may lead some fathers to pay closer attention to snacking behaviour specifically (Haycraft & Blissett, 2012). Additionally, conflicts between fathers' and mothers' feeding practices, especially when it comes to nutrition, may lead to overcompensation by some fathers in an effort to reduce the intake of refined sugars or snack foods (Khandpur, Charles, & Davison, 2016). More research needed to understand what may be driving these behaviours among fathers.
Daycare providers reported higher responsive‐satiety and restriction‐diet quality, and lower laissez faire‐diet quality, laissez faire‐attention, and indulgent‐coax scores compared with mothers. A study of daycare centres in the western United States found that most included adults at the table with young children during mealtime and mealtime interactions were an important part of childcare providers' roles (Sigman‐Grant, Christiansen, Branen, Fletcher, & Johnson, 2008). A study of family daycare providers in New York found that providers reported a high sense of responsibility for feeding children and monitoring the nutritional quality of meals (Brann, 2010). These reports may help to explain more attention paid to mealtime interactions and diet quality reported in this study. Additionally, most daycare providers had a higher than high school level of education (n = 21; 81%), and several reported training specifically in child development. Therefore, they may have had more knowledge about how to soothe infants with things other than food, accounting for lower reported indulgent‐coax feeding styles.
Interesting changes over time were observed for all caregivers. Among NMCs, lower pressure‐soothe scores were associated with older infant age. Pressure‐soothe feeding styles may decline over time as caregivers identify other ways to soothe infants. For example, fathers have reported that when using food to calm infants failed, they tried other strategies (Anderson, Nicklas, Spence, & Kavanagh, 2010). As new strategies are identified over time, they may be employed more readily than the use of food to modify behaviour. Pressure soothe was also associated with higher NMC ratings of infant fussiness. The use of food to modify “fussy” behaviour is a commonly reported strategy (Anderson et al., 2010; Heinig et al., 2006; Wasser et al., 2011), which may help to explain higher pressure‐soothe and higher indulgent‐soothe scores among NMCs.
Based on the predicted scores, restriction‐diet quality declined among mothers and NMCs once infants were eating solid foods more consistently. As infants started eating more solid foods, it is possible that caregivers became more concerned with practicality than providing an ideal diet. Parents of low‐income families in rural Michigan reported inadequate time to plan and prepare nutritious meals and concerns of quantity over quality as barriers to providing healthy foods (Omar, Coleman, & Hoerr, 2001). A multisited study in Europe also found that convenient options often were chosen over healthier food options for infants (Synnott et al., 2007). A study among Danish mothers of 7‐ and 13‐month‐old infants found that health concerns shifted over time, particularly as other family priorities began to compete with infants' diet quality. Although the importance of healthy foods was uncontested, the salience of nutritional guidelines declined over time, and mothers become more tolerant of giving their children sugar‐containing foods (Nielsen, Michaelsen, & Holm, 2013).
Among mothers and NMCs, laissez faire‐attention scores were predicted to be relatively steady until rising between the 12‐ and 18‐month visits. It is possible that as children became more integrated in family meals, caregivers became more lenient about allowing activities such as watching television. Nielsen et al. (2013) found that by 13 months of age, Danish children were expected to participate more in family meals, and fewer special accommodations were made. In a U.S. study of ethnically diverse families, infant cues that guide feeding became less salient over the first year of life (Hodges, Hughes, Hopkinson, & Fisher, 2008), which may help to explain our findings that less attention during mealtimes was predicted over time. Among NMCs, higher laissez faire‐attention scores were also associated with higher fussiness ratings. Caregivers may have allowed more distractions such as television viewing or walking around during mealtimes in order to quiet infants perceived as fussy, a tactic that has been associated with mothers' perceptions of fussiness (Thompson, Adair, & Bentley, 2013a). Predicted laissez faire‐diet quality scores were lowest at the 6‐ and 18‐month visits for all caregiver types. Caregivers may have been most attentive to what and how much food infants were eating as they began to eat solid foods more regularly and then shifted some focus away from infants as they became more comfortable with infants' ability to eat solid foods. Predicted scores at the 18‐month visit may need to be interpreted with caution given the small sample size at that time point.
Indulgent‐coax scores were predicted to rise steadily over time for mothers and NMCs. It is possible that as more food fussiness began to emerge, caregivers were more likely to rely on the instrumental use of food to ensure children ate enough, which would be consistent with the focus of nutritional quantity over quality among parents of low‐income families in Michigan (Omar et al., 2001).
Among NMCs, lower responsive‐attention scores were also associated with higher infant WLZ. Caregivers may perceive that larger infants need less encouragement to eat (Thompson et al., 2013b), which is consistent with other work that found higher perceived infant size to be associated with lower reported monitoring by mothers (A. Brown & Lee, 2011). Responsive and controlling feeding styles in this sample of NMCs were not associated with whether or not the infant was ever breastfed (results not shown), although there is evidence that longer breastfeeding duration is associated with more responsive and less controlling feeding styles among mothers (DiSantis, Hodges, & Fisher, 2013; Fisher, Birch, Smiciklas‐Wright, & Picciano, 2000). Given that few infants were still breastfeeding at the time the interviews were conducted, we were unable to test if longer breastfeeding duration may have influenced these feeding outcomes.
This study has some limitations. The small sample size and some incomplete data prevented the inclusion of important factors such as NMC race and ethnicity and duration of time infants spent in nonparental care. Participation rates also varied by NMC type and visit. A few of the infant feeding style subconstructs had low Cronbach's alpha coefficients among grandparents (pressure soothe, laissez faire‐diet quality) and daycare providers (indulgent permissive) and should be validated among these caregiver types in a larger sample size. Consequently, all findings should be considered exploratory, and future work should consider how best to engage different types of NMCs. Furthermore, “other caregivers” is a heterogeneous category, and we suggest caution in interpreting the results for this group of NMCs. For NMCs who lived in the same household as infants, we do not have a record of whether or not the infant's mother was present for the interview, which could influence response bias. Finally, future studies should use a validated infant temperament scale, such as the Infant Behavior Questionnaire‐Revised (Rothbart, 1981). Despite these limitations, the study has notable strengths. To our knowledge, it is one of the first studies to have measures of infant feeding styles for both mothers and multiple types of NMCs, allowing us to compare how mothers and other caregivers respond to the same infant and provides insight into the feeding styles infants are exposed to in different care settings. Furthermore, the longitudinal nature of the data enables us to investigate how infant feeding styles may change over time as infants continue to grow and develop.
5. CONCLUSION
The results of this study demonstrate that there are differences between the way mothers and other parents and caregivers feed infants. Those differences are nuanced and may be influenced by both caregiver and infant characteristics. It is important to improve our understanding of both what influences those differences, especially among diverse populations, and how exposure to different feeding styles may shape children's growth and risk of obesity. The findings from this study highlight the importance of engaging all parents and caregivers in educational efforts to help caregivers build optimal feeding skills that will help to promote favourable feeding outcomes.
CONFLICTS OF INTEREST
The authors declare that they have no conflicts of interest.
CONTRIBUTIONS
KJB completed the secondary data analysis and wrote the majority of the manuscript. HMW and ALT contributed to framing the research questions, statistical analysis design, and presentation of results. MEB designed and oversaw data collection for the Infant Care and Risk of Obesity Project. All authors contributed to the interpretation of results and completion of this manuscript.
Supporting information
Table S1. Characteristics of Mothers Who Did and Did Not Have a Non‐Maternal Caregiver Participate
Table S2. Characteristics of Non‐Maternal Caregivers
Table S3. Non‐Maternal Caregivers Who Were Identified at and Completed Each Visit
Table S4. Results of Random Effects Models Comparing the Infant Feeding Styles of Different Types of Non‐Maternal Caregivers (NMCs) versus Mothersa
ACKNOWLEDGMENT
The authors would like to thank Dr. Chirayath M. Suchindran for his review of this manuscript and insightful feedback. This material is based upon work supported by the National Science Foundation Graduate Research Fellowship under Grant No. (DGE‐1144081).
Barrett KJ, Wasser HM, Thompson AL, Bentley ME. Contributions of nonmaternal caregivers to infant feeding in a low‐income African‐American sample. Matern Child Nutr. 2018;14:e12610 10.1111/mcn.12610
Footnotes
In North Carolina, childcare centres affiliated with some types of non‐profit and religious organizations are not required to be regulated by the state. Because these centres are not required to adhere to the same child/teacher ratios and teacher education standards, they are categorized separately from state‐regulated daycare providers and centres.
REFERENCES
- Anderson, K. E. , Nicklas, J. C. , Spence, M. , & Kavanagh, K. (2010). Roles, perceptions and control of infant feeding among low‐income fathers. Public Health Nutrition, 13(4), 522–530. 10.1017/S1368980009991972 [DOI] [PubMed] [Google Scholar]
- Aubel, J. (2012). The role and influence of grandmothers on child nutrition: Culturally designated advisors and caregivers. Maternal & Child Nutrition, 8(1), 19–35. 10.1111/j.1740-8709.2011.00333.x [DOI] [PMC free article] [PubMed] [Google Scholar]
- Barrett, K. J. , Thompson, A. L. , & Bentley, M. E. (2016). The influence of maternal psychosocial characteristics on infant feeding styles. Appetite, 103, 396–402. 10.1016/j.appet.2016.04.042 [DOI] [PMC free article] [PubMed] [Google Scholar]
- Benjamin, S. E. , Rifas‐Shiman, S. L. , Taveras, E. M. , Haines, J. , Finkelstein, J. , Kleinman, K. , & Gillman, M. W. (2009). Early child care and adiposity at ages 1 and 3 years. Pediatrics, 124(2), 555–562. 10.1542/peds.2008-2857 [DOI] [PMC free article] [PubMed] [Google Scholar]
- Bentley, M. E. , Gavin, L. , Black, M. M. , & Teti, L. (1999). Infant feeding practices of low‐income, African‐American, adolescent mothers: An ecological, multigenerational perspective. Social Science & Medicine, 49(8), 1085–1100. 10.1016/S0277-9536(99)00198-7 [DOI] [PubMed] [Google Scholar]
- Birch, L. L. , & Fisher, J. O. (1998). Development of eating behaviors among children and adolescents. Pediatrics, 101(Supplement 2), 539–549. [PubMed] [Google Scholar]
- Black, M. M. , & Aboud, F. E. (2011). Responsive feeding is embedded in a theoretical framework of responsive parenting. The Journal of Nutrition, 141(3), 490–494. 10.3945/jn.110.129973 [DOI] [PMC free article] [PubMed] [Google Scholar]
- Blissett, J. , & Farrow, C. V. (2007). Predictors of maternal control of feeding at 1 and 2 years of age. International Journal of Obesity, 31(10), 1520–1526. 10.1038/sj.ijo.0803661 [DOI] [PubMed] [Google Scholar]
- Brann, L. S. (2010). Child‐feeding practices and child overweight perceptions of family day care providers caring for preschool‐aged children. Journal of Pediatric Health Care, 24(5), 312–317. 10.1016/j.pedhc.2009.09.001 [DOI] [PubMed] [Google Scholar]
- Brown, A. , & Lee, M. (2011). Maternal child‐feeding style during the weaning period: Association with infant weight and maternal eating style. Eating Behaviors, 12(2), 108–111. 10.1016/j.eatbeh.2011.01.002 [DOI] [PubMed] [Google Scholar]
- Brown, R. , & Ogden, J. (2004). Children's eating attitudes and behaviour: A study of the modelling and control theories of parental influence. Health Education Research, 19(3), 261–271. [DOI] [PubMed] [Google Scholar]
- Carper, J. L. , Fisher, J. O. , & Birch, L. L. (2000). Young girls' emerging dietary restraint and disinhibition are related to parental control in child feeding. Appetite, 35(2), 121–129. 10.1006/appe.2000.0343 [DOI] [PubMed] [Google Scholar]
- de Onis, M. , Onyango, A. W. , Van den Broeck, J. , Chumlea, W. C. , & Martorell, R. (2004). Measurement and standardization protocols for anthropometry used in the construction of a new international growth reference. Food and Nutrition Bulletin, 25(1 Suppl), S27–S36. [DOI] [PubMed] [Google Scholar]
- DeVellis, R. F. (1991). Scale development: Theory and applications. [Google Scholar]
- DiSantis, K. I. , Hodges, E. A. , & Fisher, J. O. (2013). The association of breastfeeding duration with later maternal feeding styles in infancy and toddlerhood: A cross‐sectional analysis. The International Journal of Behavioral Nutrition and Physical Activity, 10, 53–53. 10.1186/1479-5868-10-53 [DOI] [PMC free article] [PubMed] [Google Scholar]
- Duke, R. E. , Bryson, S. , Hammer, L. D. , & Agras, W. S. (2004). The relationship between parental factors at infancy and parent‐reported control over children's eating at age 7. Appetite, 43(3), 247–252. 10.1016/j.appet.2004.05.006 [DOI] [PubMed] [Google Scholar]
- Eli, K. , Howell, K. , Fisher, P. A. , & Nowicka, P. (2016). A question of balance: Explaining differences between parental and grandparental perspectives on preschoolers' feeding and physical activity. Social Science & Medicine, 154, 28–35. 10.1016/j.socscimed.2016.02.030 [DOI] [PMC free article] [PubMed] [Google Scholar]
- Farrow, C. V. (2014). A comparison between the feeding practices of parents and grandparents. Eating Behaviors: An International Journal, 15(3), 339–342. 10.1016/j.eatbeh.2014.04.006 [DOI] [PubMed] [Google Scholar]
- Fisher, J. O. , & Birch, L. L. (1999a). Restricting access to foods and children's eating. Appetite, 32(3), 405–419. 10.1006/appe.1999.0231 [DOI] [PubMed] [Google Scholar]
- Fisher, J. O. , & Birch, L. L. (1999b). Restricting access to palatable foods affects children's behavioral response, food selection, and intake. The American Journal of Clinical Nutrition, 69(6), 1264–1272. [DOI] [PubMed] [Google Scholar]
- Fisher, J. O. , Birch, L. L. , Smiciklas‐Wright, H. , & Picciano, M. F. (2000). Breast‐feeding through the first year predicts maternal control in feeding and subsequent toddler energy intakes. Journal of the American Dietetic Association, 100(6), 641–646. 10.1016/S0002-8223(00)00190-5 [DOI] [PMC free article] [PubMed] [Google Scholar]
- Flegal, K. M. , Kruszon‐Moran, D. , Carroll, M. D. , Fryar, C. D. , & Ogden, C. L. (2016). Trends in obesity among adults in the united states, 2005 to 2014. JAMA, 315(21), 2284–2291. 10.1001/jama.2016.6458 [DOI] [PMC free article] [PubMed] [Google Scholar]
- Haycraft, E. , & Blissett, J. (2012). Predictors of paternal and maternal controlling feeding practices with 2‐ to 5‐year‐old children. Journal of Nutrition Education and Behavior, 44(5), 390–397. 10.1016/j.jneb.2010.03.001 [DOI] [PubMed] [Google Scholar]
- Heinig, M. J. , Follett, J. R. , Ishii, K. D. , Kavanagh‐Prochaska, K. , Cohen, R. , & Panchula, J. (2006). Barriers to compliance with infant‐feeding recommendations among low‐income women. Journal of Human Lactation, 22(1), 27–38. 10.1177/0890334405284333 [DOI] [PubMed] [Google Scholar]
- Higgins, M. M. , & Murray, B. J. (2010). Nutrition‐related practices and attitudes of Kansas skipped‐generation(s) caregivers and their grandchildren. Nutrients, 2(12), 1188–1211. [DOI] [PMC free article] [PubMed] [Google Scholar]
- Hodges, E. A. , Hughes, S. O. , Hopkinson, J. , & Fisher, J. O. (2008). Maternal decisions about the initiation and termination of infant feeding. Appetite, 50(2–3), 333–339. 10.1016/j.appet.2007.08.010 [DOI] [PMC free article] [PubMed] [Google Scholar]
- Hodges, E. A. , Johnson, S. L. , Hughes, S. O. , Hopkinson, J. M. , Butte, N. F. , & Fisher, J. O. (2013). Development of the responsiveness to child feeding cues scale. Appetite, 65, 210–219. 10.1016/j.appet.2013.02.010 [DOI] [PMC free article] [PubMed] [Google Scholar]
- Hughes, S. O. , Patrick, H. , Power, T. G. , Fisher, J. O. , Anderson, C. B. , & Nicklas, T. A. D. (2007). The impact of child care providers' feeding on children's food consumption. Journal of Developmental, 28(2), 100–107. 10.1097/01.DBP.0000267561.34199.a9 [DOI] [PubMed] [Google Scholar]
- Jansen, P. W. , Tharner, A. , van der Ende, J. , Wake, M. , Raat, H. , Hofman, A. , … Tiemeier, H. (2014). Feeding practices and child weight: Is the association bidirectional in preschool children? The American Journal of Clinical Nutrition, 100(5), 1329–1336. 10.3945/ajcn.114.088922 [DOI] [PubMed] [Google Scholar]
- Khandpur, N. , Blaine, R. E. , Fisher, J. O. , & Davison, K. K. (2014). Fathers' child feeding practices: A review of the evidence. Appetite, 78, 110–121. 10.1016/j.appet.2014.03.015 [DOI] [PubMed] [Google Scholar]
- Khandpur, N. , Charles, J. , Blaine, R. E. , Blake, C. , & Davison, K. (2016). Diversity in fathers' food parenting practices: A qualitative exploration within a heterogeneous sample. Appetite, 101, 134–145. 10.1016/j.appet.2016.02.161 [DOI] [PMC free article] [PubMed] [Google Scholar]
- Khandpur, N. , Charles, J. , & Davison, K. K. (2016). Fathers' perspectives on coparenting in the context of child feeding. Childhood Obesity, 12(6), 455–462. 10.1089/chi.2016.0118 [DOI] [PMC free article] [PubMed] [Google Scholar]
- Kim, J. , & Peterson, K. E. (2008). Association of infant child care with infant feeding practices and weight gain among us infants. Archives of Pediatrics & Adolescent Medicine, 162(7), 627–633. 10.1001/archpedi.162.7.627 [DOI] [PubMed] [Google Scholar]
- Kröller, K. , & Warschburger, P. (2009). Maternal feeding strategies and child's food intake: Considering weight and demographic influences using structural equation modeling. International Journal of Behavioral Nutrition and Physical Activity, 6(1), 1–9. 10.1186/1479-5868-6-78 [DOI] [PMC free article] [PubMed] [Google Scholar]
- Laughlin, L. (2013). Who's minding the kids? Child care arrangements: Spring 2011 Current Population Reports. Washington, DC: U.S. Census Bureau. [Google Scholar]
- Lloyd, A. B. , Lubans, D. R. , Plotnikoff, R. C. , Collins, C. E. , & Morgan, P. J. (2014). Maternal and paternal parenting practices and their influence on children's adiposity, screen‐time, diet and physical activity. Appetite, 79(Supplement C), 149–157. 10.1016/j.appet.2014.04.010 [DOI] [PubMed] [Google Scholar]
- Mallan, K. M. , Nothard, M. , Thorpe, K. , Nicholson, J. M. , Wilson, A. , Scuffham, P. A. , & Daniels, L. A. (2013). The role of fathers in child feeding: perceived responsibility and predictors of participation. Child: Care, Health and Development, 40(5), 715–722. 10.1111/cch.12088 [DOI] [PubMed] [Google Scholar]
- Moroshko, I. , & Brennan, L. (2013). Maternal controlling feeding behaviours and child eating in preschool‐aged children. Nutrition & Dietetics, 70(1), 49–53. 10.1111/j.1747-0080.2012.01631.x [DOI] [Google Scholar]
- Nielsen, A. , Michaelsen, K. F. , & Holm, L. (2013). Parental concerns about complementary feeding: differences according to interviews with mothers with children of 7 and 13 months of age. European Journal of Clinical Nutrition, 67(11), 1157–1162. 10.1038/ejcn.2013.165 [DOI] [PubMed] [Google Scholar]
- Ogden, C. L. , Carroll, M. D. , Lawman, H. G. , Fryar, C. D. , Kruszon‐Moran, D. , Kit, B. K. , & Flegal, K. M. (2016). Trends in obesity prevalence among children and adolescents in the united states, 1988–1994 through 2013–2014. JAMA, 315(21), 2292–2299. 10.1001/jama.2016.6361 [DOI] [PMC free article] [PubMed] [Google Scholar]
- Ogden, C. L. , Kuczmarski, R. J. , Flegal, K. M. , Mei, Z. , Guo, S. , Wei, R. , … Johnson, C. L. (2002). Centers for disease control and prevention 2000 growth charts for the United States: Improvements to the 1977 national center for health statistics version. Pediatrics, 109(1), 45–60. 10.1542/peds.109.1.45 [DOI] [PubMed] [Google Scholar]
- Omar, M. A. , Coleman, G. , & Hoerr, S. (2001). Healthy eating for rural low‐income toddlers: Caregivers' perceptions. Journal of Community Health Nursing, 18(2), 93–106. [DOI] [PubMed] [Google Scholar]
- Rothbart, M. K. (1981). Measurement of temperament in infancy. Child Development, 52(2), 569–578. 10.2307/1129176 [DOI] [Google Scholar]
- Savage, J. S. , Fisher, J. O. , & Birch, L. L. (2007). Parental influence on eating behavior: Conception to adolescence. Journal of Law, Medicine & Ethics, 35(1), 22–34. 10.1111/j.1748-720X.2007.00111.x [DOI] [PMC free article] [PubMed] [Google Scholar]
- Sigman‐Grant, M. , Christiansen, E. , Branen, L. , Fletcher, J. , & Johnson, S. L. (2008). About feeding children: Mealtimes in child‐care centers in four Western States. Journal of the American Dietetic Association, 108(2), 340–346. 10.1016/j.jada.2007.09.006 [DOI] [PubMed] [Google Scholar]
- Slining, M. M. , Adair, L. , Goldman, B. D. , Borja, J. , & Bentley, M. (2009). Infant temperament contributes to early infant growth: A prospective cohort of African American infants. The International Journal of Behavioral Nutrition and Physical Activity, 6, 51–51. 10.1186/1479-5868-6-51 [DOI] [PMC free article] [PubMed] [Google Scholar]
- Synnott, K. , Bogue, J. , Edwards, C. A. , Scott, J. A. , Higgins, S. , Norin, E. , … Adam, R. (2007). Parental perceptions of feeding practices in five European countries: An exploratory study. European Journal of Clinical Nutrition, 61(8), 946–956. 10.1038/sj.ejcn.1602604 [DOI] [PubMed] [Google Scholar]
- Thompson, A. L. (2013). Intergenerational impact of maternal obesity and postnatal feeding practices on pediatric obesity. Nutrition Reviews, 71, S55–S61. 10.1111/nure.12054 [DOI] [PMC free article] [PubMed] [Google Scholar]
- Thompson, A. L. , Adair, L. S. , & Bentley, M. E. (2013a). Maternal characteristics and perception of temperament associated with infant TV exposure. Pediatrics, 131(2), e390–e397. 10.1542/peds.2012-1224 [DOI] [PMC free article] [PubMed] [Google Scholar]
- Thompson, A. L. , Adair, L. S. , & Bentley, M. E. (2013b). Pressuring and restrictive feeding styles influence infant feeding and size among a low‐income African‐American sample. Obesity, 21(3), 562–571. 10.1002/oby.20091 [DOI] [PMC free article] [PubMed] [Google Scholar]
- Thompson, A. L. , Mendez, M. A. , Borja, J. B. , Adair, L. S. , Zimmer, C. R. , & Bentley, M. E. (2009). Development and validation of the Infant Feeding Style Questionnaire. Appetite, 53(2), 210–221. 10.1016/j.appet.2009.06.010 [DOI] [PMC free article] [PubMed] [Google Scholar]
- Vollmer, R. L. , Adamsons, K. , Foster, J. S. , & Mobley, A. R. (2015). Association of fathers' feeding practices and feeding style on preschool age children's diet quality, eating behavior and body mass index. Appetite, 89, 274–281. 10.1016/j.appet.2015.02.021 [DOI] [PubMed] [Google Scholar]
- Wasser, H. M. , Bentley, M. E. , Borja, J. B. , Goldman, B. D. , Thompson, A. L. , Slining, M. , & Adair, L. S. (2011). Infants perceived as “Fussy” are more likely to receive complementary foods before 4 months. Pediatrics, 127(2), 229–237. 10.1542/peds.2010-0166 [DOI] [PMC free article] [PubMed] [Google Scholar]
- Wasser, H. M. , Thompson, A. L. , Maria Siega‐Riz, A. , Adair, L. S. , Hodges, E. A. , & Bentley, M. E. (2013). Who's feeding baby? Non‐maternal involvement in feeding and its association with dietary intakes among infants and toddlers. Appetite , 71(0), 7–15. doi: 10.1016/j.appet.2013.06.096 [DOI] [PMC free article] [PubMed] [Google Scholar]
Associated Data
This section collects any data citations, data availability statements, or supplementary materials included in this article.
Supplementary Materials
Table S1. Characteristics of Mothers Who Did and Did Not Have a Non‐Maternal Caregiver Participate
Table S2. Characteristics of Non‐Maternal Caregivers
Table S3. Non‐Maternal Caregivers Who Were Identified at and Completed Each Visit
Table S4. Results of Random Effects Models Comparing the Infant Feeding Styles of Different Types of Non‐Maternal Caregivers (NMCs) versus Mothersa