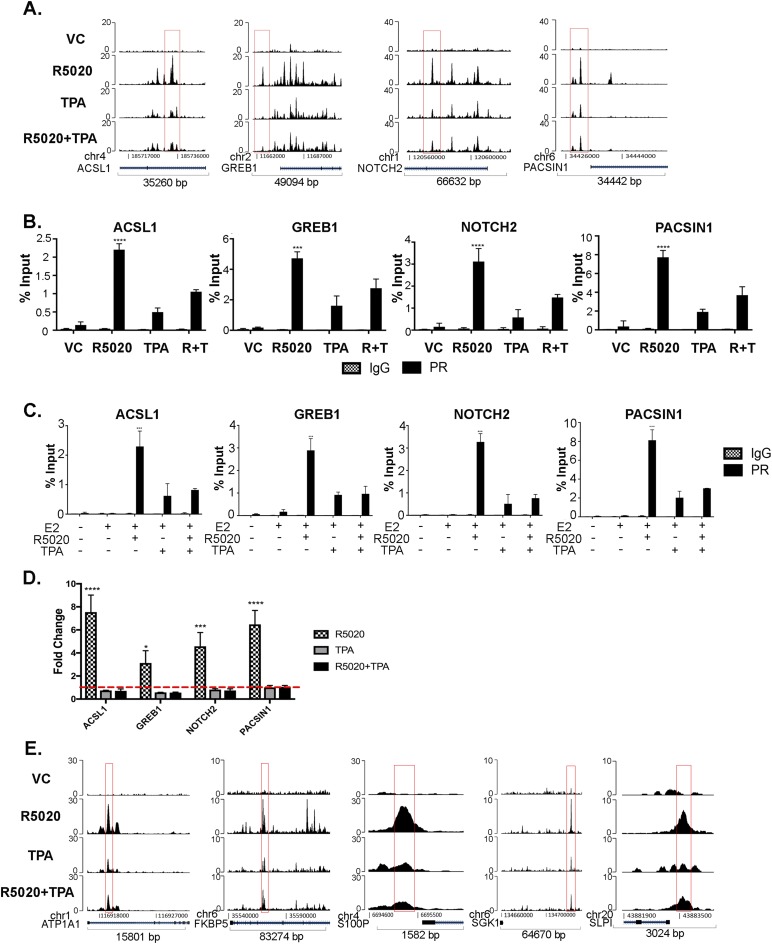
Figure 2.
TPA reduces recruitment of PR at specific PR target regions. (A) Easeq track visualization of PR recruitment to ACSL1, GREB1, NOTCH2, and PACSIN1 gene regions. ChIP-seq data were aligned to hg19. (B) T47D cells were treated with VC, 10 nM R5020, 1 μM TPA, and R5020+TPA for 30 minutes and subjected to ChIP assay with anti-PR and IgG as control. PR binding regions identified by ChIP-seq were validated by direct PR ChIP by quantitative real-time PCR, by use of previously published primers specific to binding regions. The data are represented as percentage input, mean ± SEM from three independent experiments. ***P < 0.0005; ****P < 0.0001. (C) T47D cells were treated with VC, 10 nM R5020, 1 μM TPA, and R5020+TPA in the presence of 1 nM E2 for 30 min and subjected to ChIP assay with anti-PR and IgG as control. The data are shown as percentage input, mean ± SEM from three independent experiments. ***P < 0.0005; ****P < 0.0001. (D) T47D cells were treated with VC, 10 nM R5020, 1 μM TPA, and R5020+TPA for 24 hours. RNA was extracted and real-time PCR analysis was performed. Primer sequences are in an online repository (26). The data are represented as fold change of VC treatment, mean ± SEM from three independent experiments. *P < 0.05; ***P < 0.0005; ****P < 0.0001. (E) Easeq track visualization of PR recruitment near candidate genes that were significantly upregulated by R5020 treatment and blocked by TPA treatment. ChIP-seq data were aligned to hg19.

