Abstract
Geometric and topological features of proteins such as voids, pockets and channels are important for protein functions. We discuss a method for visualizing protein pockets and channels based on orthogonal spheres computed from alpha shapes of the protein structures, and how metric properties of channel surfaces can be mapped. In addition, we discuss how structurally prominent sites, such as constriction sties in channels, can be computed, which may help to understand protein functions and mutation effects, with implications in developing novel therapeutic interventions.
I. INTRODUCTION
Geometric and topological properties of protein structures, including voids, pockets and channels are of fundamental importance for proteins to carry out their functions. Understanding the geometric basis of the mechanism of protein functions and predicting effects of mutations at specific sites through characterization of these geometric and topological properties can provide useful information for understanding the mechanism of diseases, and may help to characterize drug-protein interactions and for developing additional therapeutic intervention strategies.
A number of computational methods have been developed to detect voids and pockets in protein and to relate their roles in biochemical functions [1–4]. Among these methods, geometric and topological techniques, such as CASTp [5, 6] based on the alpha shape theory [7], can provide accurate characterization of topological and geometric properties of proteins. However, current identification and visualization of pockets and channels are cumbersome, as the detection of the most prominent feature depends on pre-specified threshold related to size, which may differ among different proteins and may not be known a priori. Moreover, current methods in visualization of pockets and channels do not contain mapping between pocket surface and metric information of individual atoms and residues. In addition, detection of potentially multiple constriction sites and residues involved remains a difficult task.
Using the alpha complex techniques, one can detect voids, pockets and channels from a given protein structure, and determine the relevant atoms and residues of each geometric feature [7]. Here we briefly revisit the alpha complex techniques, and show that these can be visualized using the orthogonal spheres to the set of Delaunay tetrahedra that form the pockets or channels. The metric contributions of atoms on the wall of the pockets or channels can also be mapped to the orthogonal spheres.
II. ALPHA COMPLEX TECHNIQUES
A. Voronoi diagram
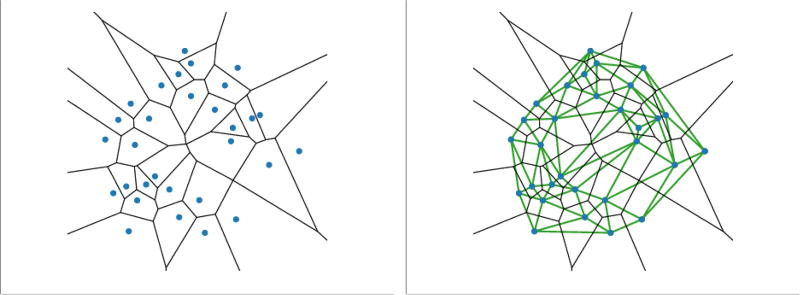
The Voronoi diagram of a set of points S in ℝ3 is formed by the collection of Voronoi cells that cover the ℝ3 space. Fig 1 shows a set of points and the corresponding Voronoi diagram in ℝ2. All the features of the description in ℝ2, which we will discuss in this paper, have more complex counterparts in ℝ3. We will use the 2D point set in Fig 1 for all figures of this paper for the sake of simplicity. A Voronoi cell Vs of a point s is a convex polyhedron that contains all points in ℝ3, distance of which to the point s is no longer than the distances to the other points:
| (1) |
where ‖·‖ stands for the Euclidean distance.
Fig. 1.
The Voronoi diagram of a set of points and the corresponding Delaunay triangulation. A simplified case of points in ℝ2 is used here. The blue dots are the points in S. The black polygons are the Voronoi cells, while the green ones are the Delaunay triangulation.
Given the Voronoi diagram generated by S, we can obtain the dual Delaunay tetrahedralization by connecting two points by a straight edge whenever the corresponding two Voronoi cells share a plane (Fig 1). Three Voronoi regions may share an edge, which is then the interaction of the three planes formed by taking pairwise intersections. Correspondingly, the three points form a triangle in the Delaunay tetrahedralization. Similarly, one intersecting point of four Voronoi cells corresponds to a tetrahedron in the Delaunay tetrahedralization. We assume that the point of S are in general position, meaning that no 4 points lie on a common plane, and no 5 points lie on a common sphere. As a result, there will be no intersection point formed by more than 4 Voronoi planes. The Delaunay tetrahedralization is a division of the convex hull of S.
B. Alpha shape
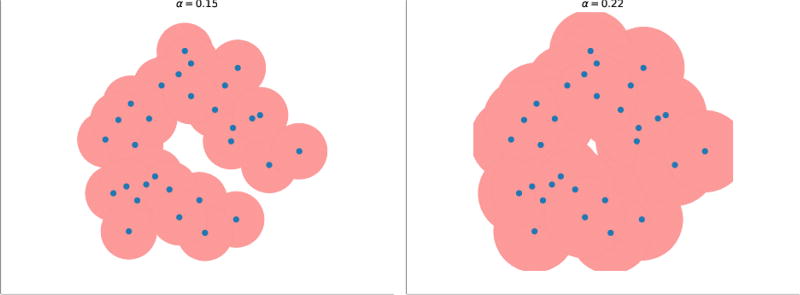
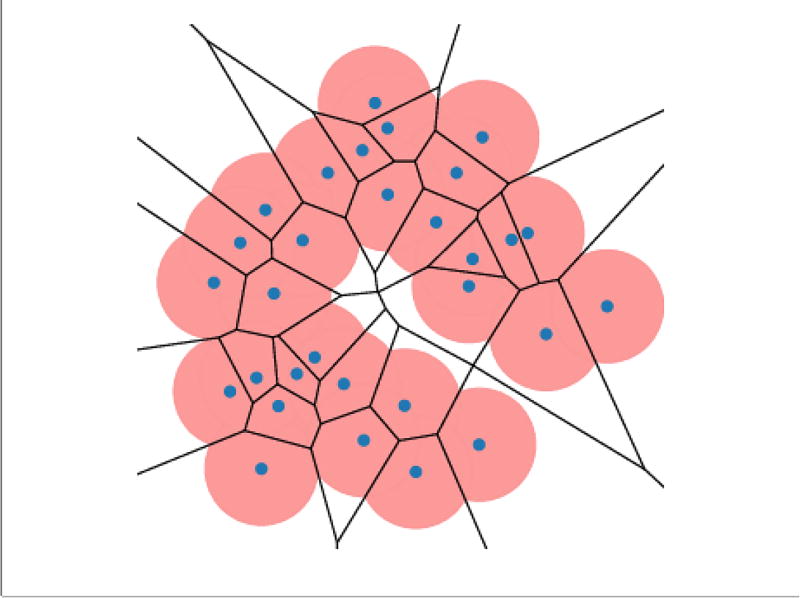
To obtain the shape of S, we place balls Bs (α) with radius α centered on each point s of S. With different radius α, different subspace of ℝ3 is covered by the union of the balls (Fig 2). To define the alpha-shape, we overlay the union of balls with the Voronoi diagram (Fig 3). To formalize this idea, we write
| (2) |
| (3) |
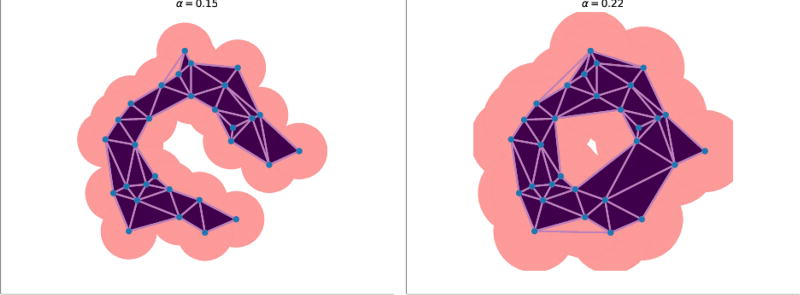
We construct the alpha-complex AS (α) following the procedure of Delaunay tetrahedralization (Fig 4). For example, whenever two regions Rs (α) intersect in a common plane, we draw an edge connecting the two corresponding points.
Fig. 2.
The union of alpha-balls with different α values. Left: α = 0.15; right: α = 0.22. The pink region is the union of the alpha-balls (−disks in this 2D case).
Fig. 3.
The superimposition between the Voronoi diagram and the union of alpha-balls.
Fig. 4.
The alpha-complex with different values of α. Left: α = 0.15; right: α = 0.22. The dark purple triangles and the light purple are the simplexes form the alpha-complex of the specific value of α. As the α increases, the number of simplexes that from the alpha-complex increases.
C. Filtration
AS(α) is a generalization of Delaunay tetrahedralization. When α varies from 0 to ∞, the corresponding alphacomplex varies from the set of points without any additional structure (AS(0)) to the Delaunay tetrahedralization of S (AS(∞)). For α ≤ α′, BS (α) ⊆ BS(α′) and therefore RS(α) ⊆ RS(α′). Thus RS(α) ⊆ RS(α′) For each vertex, edge, triangle, and tetrahedra σ in the Delaunay tetrahedralization, denote ασ as the smallest value of α for which σ belongs to AS(α). We can construct the alpha-complex by collecting all vertices, edges, triangles, and tetrahedron that have a value not larger than α:
| (4) |
where K is the Delaunay tetrahedralization of S. We can easily find ασ for every vertex, edge, triangle and tetrahedra in the Delaunay tetrahedralization, which can be sorted such that
| (5) |
The corresponding increasing sequence of complexes is
| (6) |
D. Voids, pockets, channels, and their orthogonal sphere representation
When we vary the value of α, voids in the corresponding alpha-complex appear and disappear. Using the filtration technology, we can keep track of the voids. For example, Fig 2 shows how a void in the center of a set S of points forms, while Fig 4 shows how the corresponding alpha-complex changes. If we keep increasing α, the void in the center will eventually disappear, and the alpha-complex will become the Delaunay tetrahedralization of S. A pocket can be defined as a subset of the complement of the alpha-complex that becomes a void before it disappears. A channel may be cut from the outside at two or more places when increasing α, defining the space enclosed by these openings as a pocket with more than one mouth. We refer to [3] for more details about detection and representation of voids, pockets, and channels.
For each tetrahedra constructed by four point s1, s2, s3, and s4, denote τ as the intersecting point of the four corresponding regions Rsi, where i = 1 ⋯ 4. By definition of Voronoi diagram, the distance of τ from the points is the same:
| (7) |
τ is thus refered as orthogonal center. The orthogonal sphere centering at τ with radius rτ has the four points on its boundary (surface), but no other point inside it. The orthogonal spheres can be used to represent and visualize the voids, pockets, and channels of the alpha-complex.
E. Weighted alpha-complex
The representation of space-filling balls is similar to the van der Waals diagram of a protein, where the difference is that different types of atoms affecting neighboring atoms differently, thus leads to different weights or radii. Using this insight, we can assign different weight ws to each point s in S. Using a corresponding metric of power distance,
| (8) |
we can construct the weighted Voronoi diagram, Delaunay tetrahedralization, and thus the weighted alpha-complex. We refer [3] for more details about these constructions using power distance. By assigning the van der Walls radius as the weight to each atom, we can detect voids, pockets, and channels of the protein.
F. Topological persistence
Betti numbers that count holes of different dimension of simplicial complexes can be used to characterize the topological properties of the complex. During the filtration process of the weighted alpha-complex of a protein, geometric features appear and disappear. For example, with the increase of α, a channel may appear, break into subpockets, and disappear eventually. In practice, there is no need to simulate the process of increasing the alpha value. Instead, a sorting of each simplexes according to their alpha value will be enough. We can track these geometric features during the filtration process by calculating the Betti numbers. The topological persistence can be used to detect critical geometric features, for example constriction sites, of proteins. More details of filtration and topological persistence can be found in [8].
III. Map of pocket region controlled by each atom
In addition to detection of pockets, the properties of different region of a pocket is important in determining the function of the pocket. It is therefore essential to map the physicochemical properties, including electrostatics, hydrogen bonding, hydrophobicity, polarity, and rigidity of each atom or residue onto to the surface of the pocket. However, there is currently no method that can do this mapping. Here, using the properties of weighted alpha-complex and the power distance, we show that different pocket region can be mapped to each atom that controls this region.
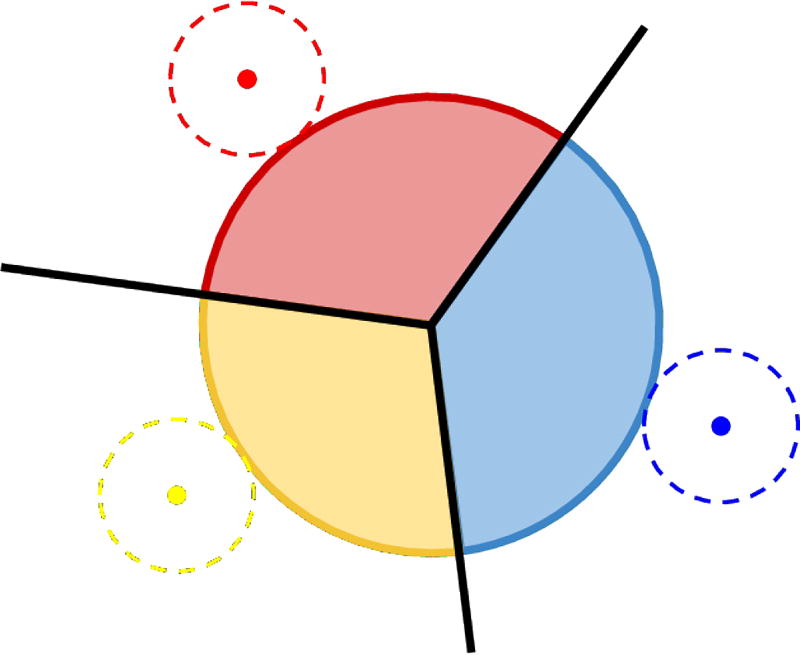
An orthogonal sphere Orths1,s2,s3,s4 (α) can be divided using weighted Voronoi diagram (Fig 5)
| (9) |
This division gives a map of region controlled by each atom under the definitions of power distance, which can be further used to guide the mapping of the physicochemical properties of atoms/residues to the pocket.
Fig. 5.
Map of area controlled by atoms. The multiple colored disk in the middle is the orthogonal circle formed by 3 weighted atoms (3 atoms instead of 4 in this 2D illustration). The 3 dashed circles stands for the atoms. The black vertex and edges show Voronoi diagram constructed using these atoms. The orthogonal circle is colored according to the closest atom using the Voronoi diagram.
IV. Detecting pockets, channels and prominent sites
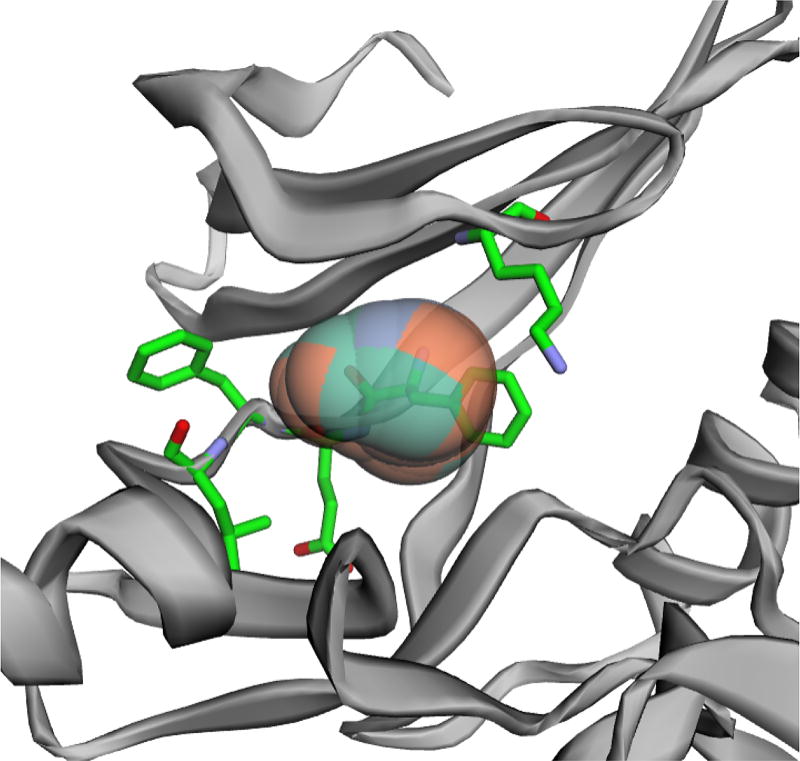
With the orthogonal spheres to the set of weighted alpha-complex, we can detect and visualize protein pockets and channels and the map of area controlled by each atom/residue. Fig 6 shows a pocket of human cyclin-dependent kinase 2 (CDK2) for ATP binding, which is an important target for design of antitumor agents [9]. Mutation or modification of the residues that form the pocket, namely K33, F80, E81, F82, and L83 (shown in sticks in Fig 6), could affect the interaction between the pocket and ATP. Study has shown that acetylation of K33 inhibits CDK2 activity [10]. For each orthogonal sphere of the pocket, the surface is colored according to the type of the closet atom quantified by the power distance, which is useful in further mapping the physiochemical properties of atoms/residues. These information will facilitate the structure-based drug design.
Fig. 6.
A potential druggable pocket detected in CDK2 (PDB id 1e9h [9]). Important residues that form the pocket are shown as sticks.
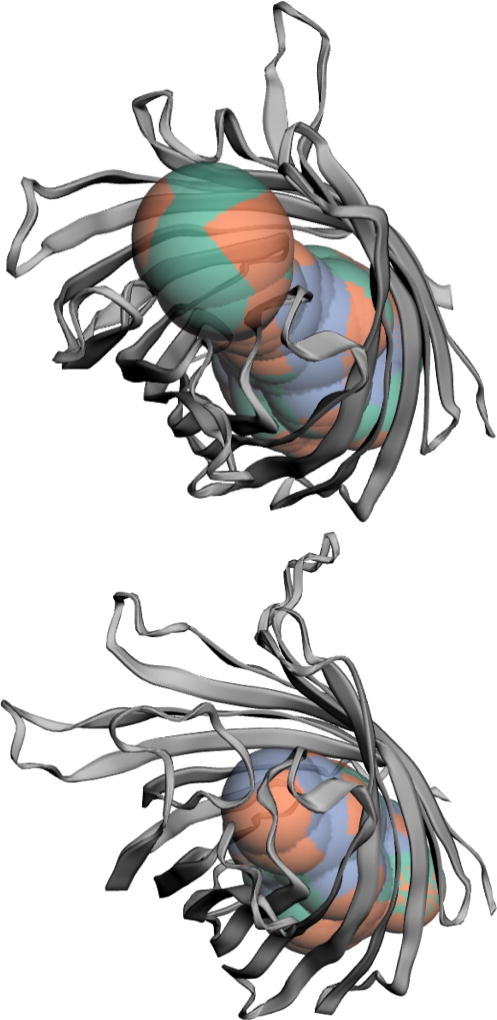
Bacterial outer membrane porins have important effects in several pathogenic mechanisms. Outer membrane protein G (OmpG) is a porin with gating behaviors. We can detect the channels in the open and closed states (Fig 7), which shows how the loops affect geometry and conductance of the channel.
Fig. 7.
Change of the channel of OmpG. Top: open state (PDB id 2iwv [11]); bottom: closed state (PDB id 2iww [10]).
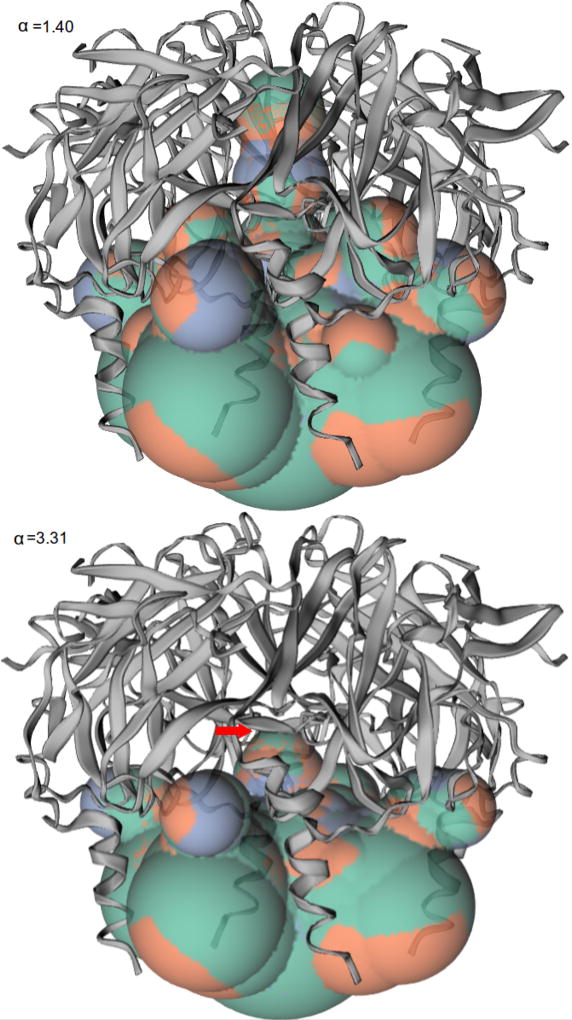
Based on the computation of topological persistence using the filtration of the computed alpha complexes, we can find structurally prominent sites of proteins independent of any pre-specified threshold or a priori knowledge. For example, the G protein-coupled inwardly-rectifying potassium channel 1 (GIRK1) participates in a wide range of physiologic responses. When we increase the value of α, the channel detected keeps narrowing until it breaks at α = 3.31, indicating a constriction site of the channel at the breaking position (Fig 8).
Fig. 8.
Channel detected with different values of α of GIRK1 (PDB id 1u4e [12]). The red arrow points to the constriction site.
V. Conclusion
In this paper, we discuss the alpha-complex techniques and how they can be applied in analyzing protein structures. For a protein channel, we have constructed the map of area controlled by each atom which forms the channel using the power distance. This can be used to map the physicochemical properties of atoms/residues onto the channel, which is helpful in understanding its functions and properties. we also show how residues that are likely important in maintaining the topological properties can be located. This will help us to identify key atoms and residues important for selectivity and specificity, and aid in finding potential druggable regions for novel interventions.
Acknowledgments
This work was supported by NIH grant CA204962.
Contributor Information
Wei Tian, Bioinformatics Program, Department of Bioengineering, University of Illinois at Chicago, Chicago, IL 60607, USA.
Jie Liang, Bioinformatics Program, Department of Bioengineering, University of Illinois at Chicago, Chicago, IL 60607, USA.
References
- 1.Liang J, Edelsbrunner H, Fu P, Sudhakar PV, Subramaniam S. Analytical shape computation of macromolecules: I. Molecular area and volume through alpha shape. Proteins. 1998;33(1):117. [PubMed] [Google Scholar]
- 2.Liang J, Edelsbrunner H, Fu P, Sudhakar PV, Subramaniam S. Analytical shape computation of macromolecules: II. Inaccessible cavities in proteins. Proteins. 1998;33(1):1829. [PubMed] [Google Scholar]
- 3.Edelsbrunner H, Facello M, Liang J. On the definition and the construction of pockets in macromolecules. Disc Appl Math. 1998;88:83–102. [PubMed] [Google Scholar]
- 4.Masood TB, Sandhya S, Chandra N, Natarajan V. CHEXVIS: a tool for molecular channel extraction and visualization. BMC Bioinformatics. 2015;16(1):119. doi: 10.1186/s12859-015-0545-9. [DOI] [PMC free article] [PubMed] [Google Scholar]
- 5.Binkowski TA, Naghibzadeh S, Liang J. CASTp: Computed Atlas of Surface Topography of proteins. Nucleic Acids Research. 2003;31(13):33523355. doi: 10.1093/nar/gkg512. [DOI] [PMC free article] [PubMed] [Google Scholar]
- 6.Dundas J, Ouyang Z, Tseng J, Binkowski A, Turpaz Y, Liang J. CASTp: Computed atlas of surface topography of proteins with structural and topographical mapping of functionally annotated residues. Nucleic Acids Research. 2006;34 doi: 10.1093/nar/gkl282. WEB. SERV. ISS. [DOI] [PMC free article] [PubMed] [Google Scholar]
- 7.Edelsbrunner H, Mcke EP. Three-dimensional alpha shapes. ACM Transactions on Graphics. 1994;13(1):4372. [Google Scholar]
- 8.Edelsbrunner H, Letscher D, Zomorodian A. Topological persistence and simplification. Discrete and Computational Geometry. 2002;28(4):511533. [Google Scholar]
- 9.Davies TG, Tunnah P, Meijer L, Marko D, Eisenbrand G, Endicott JA, Noblel MEM. Inhibitor binding to active and inactive CDK2: The crystal structure of CDK2-cyclin A/indirubin-5-sulphonate. Structure. 2001;9(5):389397. doi: 10.1016/s0969-2126(01)00598-6. [DOI] [PubMed] [Google Scholar]
- 10.Mateo F, Vidal-laliena M, Canela N, Zecchin A, Martínezbalbás M, Agell N, Giacca M, Pujol MJ, Bachs O. The transcriptional co-activator PCAF regulates cdk2 activity. Nucleic Acids Research. 2009;37(21):70727084. doi: 10.1093/nar/gkp777. [DOI] [PMC free article] [PubMed] [Google Scholar]
- 11.Yildiz Ö, Vinothkumar KR, Goswami P, Kühlbrandt W. Structure of the monomeric outer-membrane porin OmpG in the open and closed conformation. The EMBO Journal. 2006;25(15):37023713. doi: 10.1038/sj.emboj.7601237. [DOI] [PMC free article] [PubMed] [Google Scholar]
- 12.Pegan S, Arrabit C, Zhou W, Kwiatkowski W, Collins A, Slesinger PA, Choe S. Cytoplasmic domain structures of Kir2.1 and Kir3.1 show sites for modulating gating and rectification. Nature Neuroscience. 2005;8(3):279287. doi: 10.1038/nn1411. [DOI] [PubMed] [Google Scholar]


