Abstract
We herein report a self-powered and renewable cytosensing device based on ZnO nanodisks(NDs)@g-C3N4 quantum dots. The device features enhanced photoelectrochemical (PEC) activity compared to ZnO NDs or g-C3N4 QDs alone. The enhanced PEC ability is attributed to the synergistic effect of the high visible light sensitivity of g-C3N4 QDs and the staggered band alignment heterojunction structure with suitable band offset, which affords higher photoelectron transfer and separation efficiency. In addition, the hybridization of g-C3N4 QDs further accelerates interfacial electron transfer and blocks recombination between electron donors and photo-generated holes. The device was applied to the detection of CCRF-CEM cells. By conjugation to Sgc8c aptamer, which preferentially interacts with membrane-bound PTK7 on CCRF-CEM membranes, capture of target CCRF-CEM cells resulted in a decrease in apparent power output, which was then exploited for the ultrasensitive detection of the target cells. This decrease in power output can be recovered by simply increasing the temperature to release the cells, thus recycling the cytosensing performance. The device displayed a linear relationship between the change of power output and the logarithm of the cell concentration from 20 to 20,000 cell/mL (R2 = 0.9837) and a detection limit down to 20 cell/mL, as well as excellent selectivity and reproducibility. Thus, this ZnO NDs@g-C3N4 QDs-based device exhibits high potential for the detection of CCRF-CEM cells.
Keywords: Self-powered, Regeneration, Photoelectrochemistry, Heterojuncture, Cytosensing
1. Introduction
One-dimensional ZnO nanostructures, such as nanodisks, nano-wires, or nanorods, are typical photocatalytic materials because of their excellent flexibility, high electron mobility, excellent long-term stability, good transparency [1–3], good biocompatibility [4–6], morphological diversity and unique piezoelectricity [7–10]. Recently, ZnO has emerged as a prospective candidate for piezoelectric and photovoltaic applications [11–13], photoelectrochemical (PEC) water splitting [14–21], photodetectors [22–27], artificial photosynthesis and renewable energy technologies [15–18]. However, achieving good conductivity, high visible light harvesting ability and good conversion performance is thwarted by donor defects resulting from the wide and direct band gap of 3.37 eV and the large exciton binding energy of about ~60 meV [28]. Some steps have been taken to resolve this problem. In particular, composite heterojunction structures of ZnO NDs with other component materials can adjust the density of surface states and band gap to enhance the electrical characteristics [29,30]. Type-II staggered band structure alignment is one such heterojunction structure [14,31–34].
In this work, g-C3N4 QDs were adopted as a sensitizer. The quantum dots exhibit outstanding electronic, structural, and optical properties [35], as well as unique quantum size effects, and they have shown promise in photoelectric devices, biosensors [36] and other applications [37–40]. Furthermore, g-C3N4 QDs are carbon-based, nontoxic and very responsive to visible light. Compared with 2D bulk g-C3N4, the strong quantum confinement of g-C3N4 QDs may allow more visible light absorption, and the tiny size results in a large number of surface active sites [41]. The g-C3N4 QDs can combine with and encase ZnO NDs, resulting in built-in fields along the radial direction at the interface of the type-II heterojunction structure. This field is aligned in the direction of the pathway of minority charge diffusion, thus enhancing the separation of the photogenerated electron-hole pairs, rather than their recombination [31,32]. Based on the remarkable advantages of ZnO NDs and g-C3N4 QDs, we herein extend the application range of both materials and present a photocatalyzed renewable self-powered cytosensing device based on ZnO NDs@g-C3N4 QDs. The device is further applied to the detection of CCRF-CEM cells.
Lymphoblastic leukemia is a serious cancer, damaging the bone marrow, immature white blood cells and other organs [42]. In 2013, more than twenty thousand people were afficted with lymphoblastic leukemia, and fewer than 50% survived [43]. In addition, lymphoblastic leukemia, or ALL, commonly occurs in children and is characterized by excess immature white blood cells in the child’s blood and bone marrow. Without proper and specific treatment, survival time is only three months [44–46]. Thus, early diagnosis of ALL calls for the development of ultrasensitive tools to rule in or rule out this life-threatening disease. However, few researchers have focused on this issue [44,47], and researchers working in the same field often use different experimental methods. Those tools are often time-consuming and require tedious sample preparation or sophisticated instrumentation, and they frequently provide false-negative results.
Currently, self-powered systems are attracting considerable attention. The concept of “self-powered” was first introduced between 2007 and 2008 in Prof. Wang’s work [48–51]. The development of related technologies is particularly associated with self-powered sensors [52–57] and regenerative actuators [58,59]. For self-powered active sensors for bio-systems, applications have involved the cardiac system [60–64], healthcare [55,65–72] and medical devices [53,73–77].
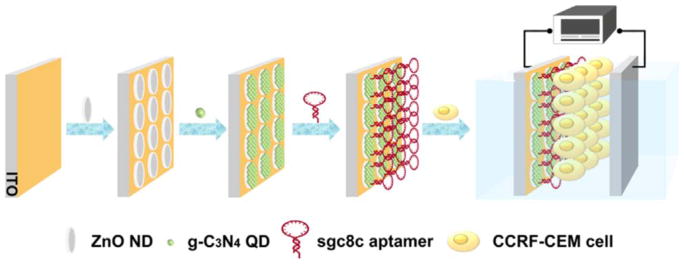
Using cell-SELEX, our group has selected a specific aptamer, Sgc8c, for the CCRF-CEM cell line separated from peripheral blood. Based on our previous cell-SELEX work [78–80] and the above-mentioned material and technology, we developed a renewable self-powered device, as shown in Fig. 1, for specific detection of CCRF-CEM cells and early detection of acute lymphoblastic leukemia. This cytosensitive device meets the requirements for early diagnosis because of its sensitivity, speed and reliability.
Fig. 1.
Schematic illustration of the renewable, self-powered device and its bio-application as a cytosensing platform.
This paper describes the working mechanism of the device, the nanohybridization PEC properties, and the power output enhancement achieved. The performance of the device was monitored during the fabrication process to verify successful assembly. The regeneration ability of the device was also evaluated. To apply this device for the detection of CCRF-CEM cells, we utilized previous work of our group and incorporated an aptamer Sgc8c capture probe, which specifically recognizes PTK7 on the target cell membrane. Applicable concentration range, detection limit and selectivity were all evaluated. The device demonstrated one potential application of ZnO NDs@g-C3N4 QDs.
2. Experimental section
2.1. Materials and reagents
N-hydroxy-succinimide (NHS), 1-ethyl-3-(3-dimethyl-aminopropyl) carbodiimide hydrochloride (EDC) and Dulbecco’s phosphate-buffer saline (D-PBS) were purchased from Sigma-Aldrich (St. Louis, USA). All chemicals were of reagent grade purity or better and were used without further purification. The pipette tips and ultrapure water (18.25 MΩ cm−2) were sterilized in a LDZX-30KBS pressure steam sterilizer (Shanghai Shenan Medical Instrument Co. Ltd.) at 121 °C for 40 min and stored in a 4 °C refrigerator after cooling to room temperature.
2.2. Apparatus for characterization
X-ray diffraction (XRD) patterns were collected from a D8 advance X-ray diffractometer (Bruker AXS, Germany). Fourier transform infrared spectra (FT-IR) were obtained using a Perkin-Elmer 580B spectrophotometer (Perkin-Elmer, USA). Photoluminecence (PL) emission spectra were obtained using an Edinburgh Instruments FLS920 spectrometer. Transmission electron microscope (TEM) and high resolution transmission electron microscope images (HRTEM) were obtained, respectively, from JEM-1400 and JEM-2100F microscopes (JEOL, Japan). Scanning electron microscope (SEM) images and energy dispersive spectroscopy (EDS) were acquired on an FEI QUANTA FEG250 coupled with an INCA Energy X-MAX-50. UV–vis measurements were carried out on a Cary Bio-100 UV/Vis spectrometer (Varian). PEC and electrochemical impedance spectroscopy (EIS) tests were performed on a Zahner ZENNIUM Electrochemical Workstation (Zennium PP211, Germany).
2.3. Cell culture and aptamer preparation
CCRF-CEM cells (human acute lymphoblastic leukemia cell lines) were purchased from ATCC (Manassas, VA). All cells were cultured in RPMI 1640 medium (ATCC, Manassas, VA) supplemented with 10% FBS and 100 IU/mL penicillin-streptomycin (Cellgro, Manassas, VA) in an incubator (5% CO2, 37 °C). Sgc8c aptamer (5′-ATC TAA CTG CTG CGC CGC CGG GAA AAT ACT GTA CGG TTA GA-3′) was synthesized using an ABI 3400 DNA/RNA synthesizer (Applied Biosystems, Foster City, CA, USA). HPLC (ProStar, Varian, Walnut Creek, CA, USA) with C18 column (5 μm, 250 mm×4.6 mm, Alltech) was used to separate the desired sequence from the reaction matrix using a mobile phase of acetonitrile and 0.1 mol/L triethylammonium acetate (TEAA). After the aptamer was synthesized, 3 mL of ammonium hydroxide was added to the synthesized DNA for 17 h for deprotection. Then, 250 μL of 3 mol/L NaCl and 6 mL of cold ethanol were added to precipitate the deprotected DNA for 12 h at −20 °C, followed by centrifugation for 15 min at 14,000 rpm, after which the precipitate was collected. A 450 μL aliquot of 0.1 mol/L triethylammonium acetate (TEAA) was added to the precipitate to dissolve the DNA. The purified DNA was dried, incubated for 20 min with 200 μL of acetic acid (80%), and further incubated with 25 μL of 3 mol/L NaCl and 600 μL of cold ethanol. The concentration of prepared DNA was obtained by UV–vis measurements.
2.4. Preparation of photoelectrode materials
ZnO NDs were prepared by the hydrothermal method, as reported previously [81], with slight modification. Five mmol Zn(NO3)2 and 1.6 mmol trisodium citrate dihydrate were mixed in 25 mL of ultrapure water. Next, NaOH solution (2 mol/L) was added dropwise until the pH reached 9.0. Then the solution was placed in a Teflon-lined stainless steel (100 mL) container and transferred to an oven for 9 h at 120 °C. After cooling naturally to 25 °C, the white precipitate was removed, centrifuged and rinsed 5 times with ultrapure water and absolute ethanol to give the final ZnO NDs.
The g-C3N4 QDs were obtained by ultrasound treatment of bulk g-C3N4, 15 g of which were prepared as described in the literature [82]. Melamine powder (15 g) was placed in a covered ceramic crucible and heated in a muffle furnace with a ramp rate of 2 °C/min to 550 °C and held for 4 h. After cooling naturally to room temperature, bulk g-C3N4 powder was removed from the muffle furnace. Then g-C3N4 QDs were synthesized according to the literature [83]. Two grams g-C3N4 powder were added to 300 mL water and then subjected to ultrasound for 20 h. The solution was then filtered using a 0.22 μm microfilter, and the g-C3N4 QDs were collected.
2.5. Fabrication and characterization of the self-powered cytosensing platform
An indium tin oxide (ITO) conductive glass was used as the anode substrate. The ITO substrate was washed with acetone and 95% ethanol sequentially, sonicated for 30 min, and dried with pure N2 gas before use. Twenty μL of ZnO NDs (24 mg/mL) was spin-coated on the bare ITO electrode, which was heated in an oven at 150 °C for 30 min. Then, 20μL of g-C3N4 QDs (24 mg/mL) was incubated with the ZnO ND/ITO electrode overnight under the activation of EDC/NHS. The electrode was rinsed with H2O several times and dried with flowing N2 gas. Then, 10μL of aptamer Sgc8c (18 μg/mL) was incubated with the ZnO ND@g-C3N4 QDs/ITO electrode with EDC/NHS at 4 °C for 8 h, during which the aptamer was immobilized onto the electrode surface via an amido bond. The fabricated anode was placed in a chamber with a Pt cathode auxiliary electrode. The chamber contained PBS buffer mixed with 0.1 mol/L of ascorbic acid (AA) and was saturated with N2 gas.
For detection of the target cells, the aptamer-functionalized anode was incubated with the target cells at different concentrations at 4 °C for 1 h for target capture. Then the anode was removed and washed several times with PBS buffer to eliminate the noncaptured cells. Then the anode was returned to the chamber, and the signal, including power output signal, was measured.
For regeneration, the cell-capturing anode in the chamber was removed and incubated with D-PBS at 48 °C for 20 min to renew the anode and release the captured cells.
For PEC experiments, the irradiation source wavelength was 430 nm. The illumination and dark exposure periods were 20 s and 10 s, respectively, and the bias voltage was 0.1 V. The power output was calculated based on the following equation: P = UI, where P is the power output (μW·cm−2), U is the voltage, and I is the electric current density (μA cm−2). The functional surface area of the anode was 1 cm2. For the EIS experiments, an AC sine wave with 5 mV amplitude was used to disturb the steady-state open circuit voltage. The scan frequency ranged from 100 kHz to 100 mHz. The parameters were fitted through ZSimpWin software.
3. Results and discussion
3.1. Characterization of photoelectrode materials
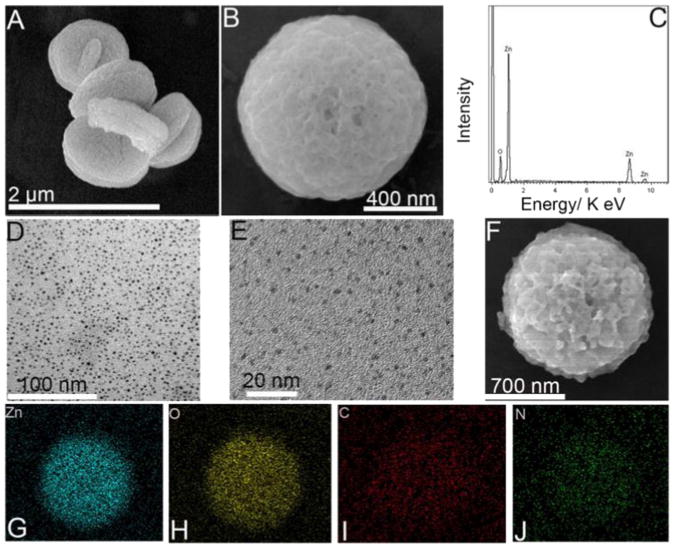
Fig. 2A and B show SEM images of the as-prepared ZnO NDs, and Fig. 2B shows a single ZnO ND with a perfect 3D disk shape. EDS results indicate the presence of zinc and oxygen, obviously suggesting that the synthesis of ZnO was successful (Fig. 2C). Fig. 2D and E display TEM images of dispersed g-C3N4 QDs with dimensions of 100 nm and 20 nm, respectively. The uniform diameter and high abundance indicate that the preparation was successful. Fig. 2F exhibits SEM images of the nanocomposites of ZnO ND@g-C3N4 QDs, giving the appearance of a gossamer packing of g-C3N4 QDs dropped onto the ZnO ND after hybridization. EDS mapping results in Fig. 2G–J show that Zn, O, C and N were distributed homogeneously and that g-C3N4 QDs were compactly confined on the ZnO ND surface. However, in the mapping, C and N showed low abundance compared to Zn and O, possibly because of the relatively low content of g-C3N4 QDs compared to ZnO ND and because the conductive tapes emitted a noticeable background signal, making C and N signals appear to be lower.
Fig. 2.
SEM images of ZnO NDs (A, B); EDS of ZnO NDs (C); TEM (D) and HRTEM (E) images of g-C3N4 QDs; SEM image of ZnO ND@g-C3N4 QDs (F); EDS mapping (G–J) of ZnO ND@g-C3N4 QDs (For Zn, O, C, N, respectively).
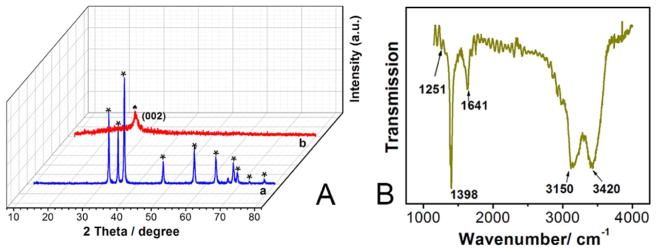
Typical XRD patterns of ZnO NDs (curve a) and g-C3N4 QDs (curve b) are displayed in Fig. 3A. Eleven diffraction peaks are observed at 2 = 31.7°, 34.6°, 36.2°, 47.6°, 56.6°, 62.8°, 66.3°, 67.8°, 69.1°, 72.6° and 77.0°, as marked by stars in curve a. They respectively correspond to the (100), (002), (101), (102), (110), (103), (200), (112), (201), (004) and (202) planes of ZnO, according to the Joint Committee on Powder Diffraction Standards (JCPDS) card No. 036–1451 [84–86]. The results indicated that the as-prepared ZnO NDs correspond to the characteristic wurtzite hexagonal phase. In curve b, a peak was noted at about 27.5°, which can be related to the (002) plane, and the distance was 0.325 nm. The (100) peak can barely be distinguished [36]. Therefore, g-C3N4 QDs maintained their lattice structure, thereby facilitating subsequent fabrication of the cytosensing device.
Fig. 3.
(A) XRD patterns of ZnO NDs (a) and g-C3N4 QDs (b); (B) FT-IR spectrum of g-C3N4 QDs.
Fig. 3B shows the FT-IR spectrum of g-C3N4 QDs from 1000 to 4000 cm−1. The C-H and N-H stretching vibrations appear at about 3150 cm−1. The peak at about 3420 cm−1 may be assigned to the O-H stretch of hydroxyl groups. The peak at 1641 cm−1 may correspond to C-O stretching vibrations. The sharp peak located at about 1398 cm−1 may be attributed to C=O bending vibrations. The stretching vibration of the C-N bond may be associated with the peak at 1251 cm−1. The IR data indicate that g-C3N4 QDs have plentiful functional groups, also facilitating fabrication of the device and its biocompatibility.
3.2. Characterization of device
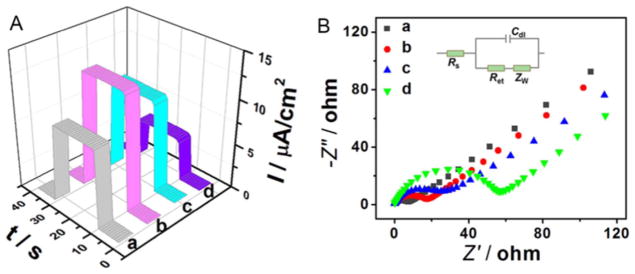
The power output of the photoelectrode material, hybridization properties of the aptamer probe, and target cell recognition by the aptamer were all assessed by PEC assay, as shown in Fig. 4A. After immobilization of ZnO NDs, the photocurrent signal increased significantly to 8.58 μA cm−2, showing that ZnO NDs are effective in converting light to electrical energy. After doping the ZnO NDs with g-C3N4 QDs, the power output dramatically rose to 12.8 μA cm−2, owing to the synergy between ZnO NDs and g-C3N4 QDs. The hybridization was markedly beneficial to the energy conversion resulting from the interfacial electron transfer, as well as the suppression of e−/h+ recombination. After assembly of the aptamer probe, the power output started to decrease to 10.5 μA cm−2, because of the insulating effect of the negatively charged DNA framework. The power output signal then decreased further to 4.60 μA cm−2 after incubation with the target cells (1000 cell/mL), indicating that the target cells had been successfully captured on the electrode’s surface by the Sgc8c aptamer.
Fig. 4.
(A) Time-based photocurrent responses and (B) EIS spectra of (a) ZnO NDs/ITO, (b) ZnO NDs@g-C3N4 QDs/ITO, (c) Sgc8c/ZnO NDs@g-C3N4 QDs/ITO, and (d) CCRF-CEM cells/Sgc8c/ZnO NDs@g-C3N4 QDs/ITO.
EIS spectra were used to confirm the power output of the photo-electrode material, the hybridization of the aptamer probe and the recognition ability of the aptamer (Fig. 4B). The tests were performed in 0.1 mol/L KCl containing 5.0 mmol/L K3Fe(CN)6/K4Fe(CN)6 (1:1). Results of Nyquist plots can be interpreted by the Randles equivalent circuit (inset in Fig. 4B) [87–89], which includes four circuit elements: the resistance of solution (Rs), the charge transfer resistance (Ret), the Warburg impedance (ZW) and the double layer capacitance (Cdl). Of the four circuit elements, only Ret can be affected by the electrode fabrication and detection process. Thus, Ret can be used as an indicator of the interfacial energy conversion process. The semicircle in Fig. 4B showing the high frequency region of the Nyquist plots represents Ret and the energy conversion ability realized by electron transfer at the material interface. However, typically the semicircle is not ideal as a result of inhomogeneous mass-transport resistance and frequency dispersion. The semicircle diameter reached 9 Ω when ZnO NDs were immobilized on the electrode (curve a). Ret increased to 18 Ω after g-C3N4 QDs were hybridized with ZnO QDs (curve b), and increased still further to 27 Ω after the probe aptamer was assembled on the electrode (curve c). Furthermore, when target cells were captured, the semicircle diameter increased significantly to 57 Ω (curve d). Ret changes confirmed that the fabricated device had been successfully prepared and that the device could recognize and bind to target cells.
3.3. The photovoltaic working mechanism of the device
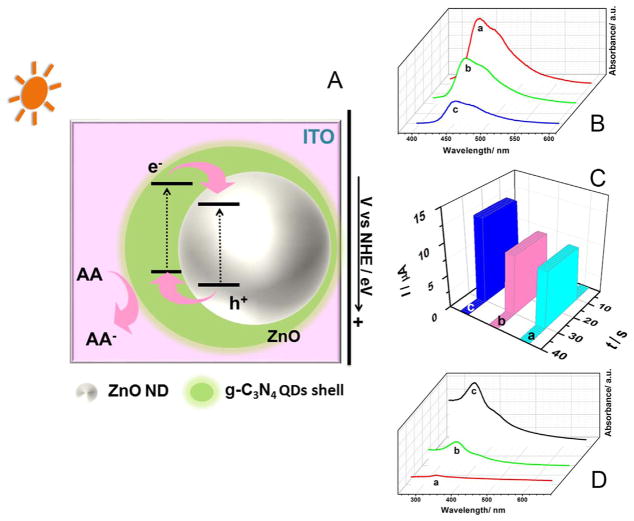
As described in Fig. 1, ZnO NDs was first immobilized on a bare ITO substrate. It is well known that ZnO NDs can absorb short wavelength light but not visible light, due to the poor light absorption capacity resulting from their wide band gap. Thus, the cytosensing device does not perform as expected when exposed to a visible light after fabrication. Then, g-C3N4 QDs were introduced to sensitize ZnO NDs. The g-C3N4 QDs can absorb and be excited by visible light, which induces a π-π transition, resulting in transport of the excited electrons from the valence band (VB) to the conduction band (CB). When ZnO NDs and g-C3N4 QDs are combined, they form a heterojunction structure with a typical relative Femi level alignment.
Fig. 5A depicts the possible sensitization mechanism for the visible light-driven activity of the photovoltaic materials ZnO NDs and g-C3N4 QDs. ZnO NDs have a wide band gap of 3.2 eV, while the CB edge potential is about −0.44 V vs. normal hydrogen electrode (NHE) [20,90]. Thus, we can infer that the VB edge potential is about 2.76 V based on the equation Eg = VVB − VCB. Similarly, g-C3N4 QDs have a band gap of 2.76 eV and CB edge potential of about −1.12 V [91,92], giving a VB edge potential of about 1.64 V. The energy levels of both ZnO NDs and g-C3N4 QDs match very well and meet the requirements to form a type II heterojunction alignment structure. The device developed in this work generates electricity as the signal output via the electrons excited by energy from visible light (Fig. 5A). When exposed to visible light, the photogenerated electrons of g-C3N4 QDs are excited and then transfer quickly from the VB to the CB. Moreover, the photogenerated electrons excited in g-C3N4 can be easily injected into the ZnO NDs because of the different CB energy levels. The electrons are promoted from the VB to the CB and immediately are transmitted to the external circuit as the power (signal) output. Then, the electrons were partly blocked and the power output decreased after aptamer Sgc8c was immobilized onto the modified electrode surface, due to the insulating property of the aptamer DNA framework. The power output decreased further due to the added insulation from target cells when the CCRF-CEM cells were captured by the aptamer Sgc8c. Therefore, the power output change resulted from the capture of cells on the electrode surface, indicating that there is a certain relationship between the change in power output and the concentration of CCRF-CEM cells, and this relationship is shown in section “3.5 The cytosensing application “. The device can be reactivated and recycled through the repeatable capture (in cell suspension at 4 °C for 30 min) and removal (in 48 °C D-PBS solution for 20 min) of the target cells under certain conditions. Moreover, the separated holes in the VB of ZnO NDs can enter the g-C3N4 QDs and reduce AA to AA−, which improves the separation efficiency and depresses the recombination of the electron donors and holes [93]. Thus, the self-powered device works successfully.
Fig. 5.
(A) Schematic illustration of the energy level diagram; (B) PL emission spectra, (C) time-based photocurrent responses and (D) UV–vis spectra of (a) ZnO NDs, (b) g-C3N4 QDs and (c) ZnO NDs@g-C3N4 QDs.
The power output enhancement was also verified by the results of PL, PEC and UV–vis studies. Previously, PL revealed the recombination level and separation efficiency of photogenerated h+/e− pairs to be a useful tool [94]. Generally, the PL intensity of a photoactive material is weak, while the photocatalytic and UV absorption are correspondingly strong. In other words, increased h+/e− pair recombination and lower electron separation efficiency indicate stronger PL intensity and weaker photocatalytic ability and UV absorption. This observation is supported by the results given in Fig. 5B–D. In Fig. 5B, curves a and b correspond to ZnO NDs and g-C3N4 QDs, respectively. It can be seen that the PL intensity of ZnO NDs is stronger than that of g-C3N4 QDs, but an opposing situation is shown for PEC and UV–vis, owing to the different band gap. Furthermore, PL intensity became much weaker, and the photocurrent in PEC tests and UV absorption were much higher, when ZnO NDs and g-C3N4 QDs were combined. This phenomenon means that the hybridization between ZnO NDs and g-C3N4 QDs improves electron output efficiency, which also perfectly explains the above working mechanism.
3.4. Regeneration of the device
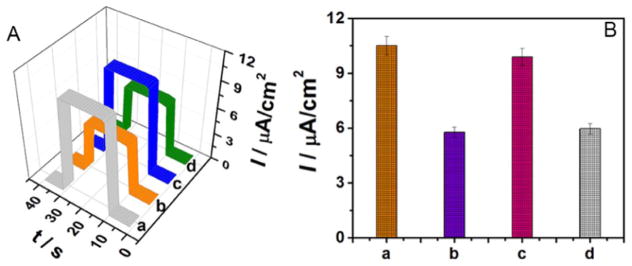
Regeneration ability is very important for a cytosensing device, because less material is consumed and less medical waste is produced. The regeneration of this cytosensing device is realized through recycling the probe aptamer. Aptamer Sgc8c targets membrane protein PTK7 on the CCRF-CEM cell surface through the aptamer’s specific 3D conformation, and the captured target cells can be released by again altering the conformation of the aptamer, which is accomplished through a change in temperature [47,78,95]. The anode regeneration processes were carried out by the PEC method (Fig. 6A and B). Before capturing CCRF-CEM cells, the photocurrent intensity was 10.5 μA cm−2 (curve a), but the photocurrent sharply decreased to 5.77 μA cm−2 because the probe aptamer had captured the CCRF-CEM cells (curve b). After the first capture of cells, the anode was removed and immersed in 48 °C D-PBS solution for 20 min and then returned to the chamber to start the next cycle. It can be seen that the photocurrent immediately recovered to 9.89 μA cm−2 (curve c). The recovered anode was subsequently placed in a CCRF-CEM cell suspension at 4 °C for 30 min, and the photocurrent intensity of the anode decreased to 5.75 μA cm−2 (curve d). The above regeneration process suggested that the functionalized photoanode could be reactivated for repeated capture and release of the target cells on the electrode surface. We also validated the reproducibility of the cytosensing device by intra- and inter-assay relative standard deviation (RSD). For CCRF-CEM samples of 100, 500, and 1000 cell/mL, the intra-assay RSDs were 2.6%, 4.1% and 3.3%, respectively. The inter-assay RSDs were 3.4%, 4.2%, and 3.5% for five chambers prepared independently and incubation of the same samples under the same experimental conditions. These results confirm the acceptable reproducibility and precision of this cytosensing device.
Fig. 6.
(A) Time-based photocurrent responses and (B) photo-current histograms of the aptamer-functionalized anode before (a) and after (b) incubation in the 500 cell suspension and at the regenerated anode before (c) and after (d) incubation in the 500 cell suspension.
3.5. The cytosensing application
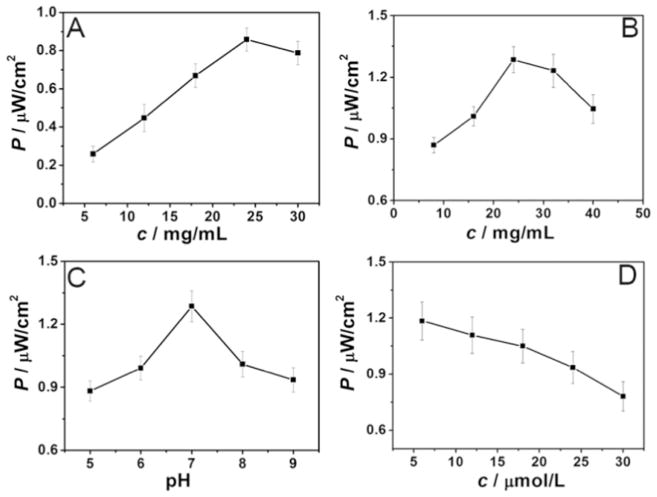
The experimental conditions were adjusted for optimum detection. The optimal concentrations of ZnO NDs (Fig. 7A) and g-C3N4 QDs (Fig. 7B), pH (Fig. 7C) and probe aptamer concentration (Fig. 7D) were 24 mg/mL, 24 mg/mL, 7.0 and 18 μg/mL, respectively.
Fig. 7.
Time-based photocurrent responses versus concentrations of ZnO NDs (A) and g-C3N4 QDs (B), pH (C) and concentration of aptamer (D).
Once the CCRF-CEM cells were incubated and captured by the probe aptamer on the functionalized anode, a marked decrease in photo-current response and power output appeared (Fig. 8A–C), suggesting that the anode was sensitive enough to detect the target cells. Fig. 8A and B show the PEC curve and corresponding power output in the presence of different concentration of CCRF-CEM cells. The maximum change in both power output (ΔPmax) and photocurrent density of the cytosensor reached 0.974 μW cm−2 and 9.74 μA cm−2 under the optimal experimental conditions, respectively. Upon increasing target cell concentration, power output P and photocurrent density I decreased continuously. In addition, the change in power output (ΔP, ΔP = P0-P) was linearly related to the logarithm of the CCRF-CEM cell concentration, as shown in Fig. 8C, with the following regression equation: ΔP (μW cm−2) =0.299 lgcCCRF-CEM cell (cell/mL) + 0.472. The correlation coefficient and the limit of detection (LOD) were 0.9837 and 20 cell/mL, respectively, and the cytosensing device was responsive over a wide range of concentrations from 20 cell/mL to 20,000 cell/mL. The performance is relatively better than that achieved by other researchers (see Supporting information, Table S1, S2). This device can be used to detect and quantify CCRF-CEM cells and even monitor disease progression. These results can be attributed to the efficient inhibition of h+/e− pair recombination by the band offset between CB and VB in the ZnO NDs@g-C3N4 QDs heterojunction structure, as well as specific recognition between the probe aptamer and the target CCRF-CEM cells, as previously demonstrated by our group’s cell-SELEX protocol [78].
Fig. 8.
(A)Time-based photocurrent responses (a-j: the photocurrent responses of the electrode incubated with increasing concentrations of CCRF-CEM cells); (B) Plot of photocurrent change (ΔP) versus CCRF-CEM cell concentration; (C) calibration curve between ΔP and the logarithm of the concentration of CCRF-CEM cells.
3.6. Selectivity of the device
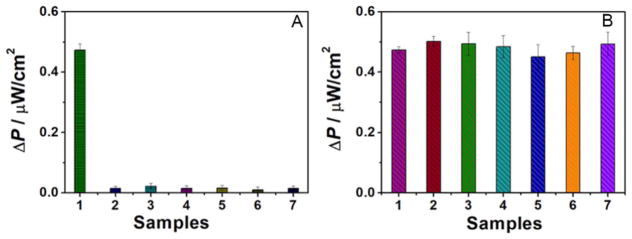
To assess the selectivity of the cytosensor, five kinds of the cells (HL-60, K562, Ramos, Jurkat and HeLa cells) and a mixed solution of the five cell types were utilized as interferences. The power outputs of the chambers were measured, and the cytosensing device captured only control CCRF-CEM cells (500 cell/mL) (sample 1, Fig. 9A). When incubated with the other cell types, no obvious signal change took place, indicating that the cells were not captured by the probe aptamer. The selectivity of this cytosensing device was further investigated, as shown in Fig. 9B. The power outputs were measured when incubating 1500 cell/mL of HL-60, K562, Ramos, Jurkat and HeLa cells, along with 500 cell/mL CCRF-CEM cells, respectively. The power outputs showed negligible changes compared with the calibration curve in Fig. 8 (500 cell/mL CCRF-CEM cells). The incubated 3-fold concentration of non-target cells did not result in any remarkable power output increase or decrease. These results indicated that the selectivity of the cytosensing device was excellent.
Fig. 9.
(A) Selectivity of the cytosensing device: (1) 500 cell/mL CCRF-CEM cells; (2) 1500 cell/mL HL-60 cells; (3) 1500 cell/mL K562 cells; (4) 1500 cell/mL Ramos cells; (5) 1500 cell/mL Jurkat cells; (6) 1500 cell/mL HeLa cells; (7) 1500 cell/mL each of HL-60+K562+Ramos+Jurkat+HeLa cells. (B) Selectivity of the cytosensing device: (1) 500 cell/mL CCRF-CEM cells; (2) 500 cell/mL CCRF-CEM+1500 cell/mL HL-60 cells; (3) 500 cell/mL CCRF-CEM +1500 cell/mL K562 cells; (4) 500 cell/mL CCRF-CEM+1500 cell/mL Ramos cells; (5) 500 cell/mL CCRF-CEM+1500 cell/mL Jurkat cells; (6) 500 cell/mL CCRF-CEM+1500 cell/mL HeLa cells; (7) 500 cell/mL CCRF-CEM +1500 cell/mL each of PC3+K562+Ramos+Jurkat+HeLa cells.
4. Conclusions
In this work, a self-powered, renewable cytosensing device based on ZnO NDs@g-C3N4 QDs was constructed and further applied in the detection of CCRF-CEM cells. The cytosensing device showed high power output because of the synergistic effect arising from the interaction between ZnO NDs and g-C3N4 as well as the staggered band alignment heterojunction structure, leading to high e-/h+ conductivity, long carrier lifetime and high carrier mobility. Furthermore, the cytosensing device exhibited high sensitivity resulting from the high affinity and binding specificity of the aptamer probe. At the same time, the regeneration of the anode showed that the cytosensing device will have practical and promising applications in the future. Further, the excellent parameters, such as the wide detection range, the low detection limit, excellent selectivity and reproducibility, all indicated that the device has high potential to serve as an effective platform to detect CCRF-CEM cells and monitor the progression of leukemia.
Supplementary Material
Acknowledgments
This research was supported by China Postdoctoral Science Foundation (No. 2016M592125), Key Research and Development Program of Shandong Province, China (No. 2015GGH301001), the Technology Research Project of Shandong Provincial Education Department (No. J15LC07), National Key Scientific Instrument and Equipment Development Project of China (No. 21627809), NSFC (21575050), NIH (GM079359; CA133086).
Biographies

Xuehui Pang received her Ph.D. degree from the Ocean University of China in 2008. She is now an associate professor at the University of Jinan, interested in the assembly of nanocomposites as well as their analytical applications.

Cheng Cui received his B.S. and M.S. in Chemistry from Tsinghua University in 2007 and 2011, respectively. In 2017, he graduated with the Ph.D. degree from the University of Florida. His research interests focus on the development of site-selective protein conjugation methods using aptamer templates for real-time modification of live cell and cancerous extracellular vesicles.

Minhui Su is currently an undergraduate student majoring in Applied Chemistry at the University of Jinan. Her research interests focus on bio-analytical chemistry.

Yaoguang Wang received his B.S. and M.S. degrees in Chemistry and Chemical Engineering and Technology from the University of Jinan in 2012 and 2015, respectively. He is now a Ph.D candidate at the University of Jinan. His main research interests are biosensors and environmental pollutant analysis.

Qin Wei received her Ph.D. degree from Lanzhou Institute of Chemical Physics. She is now a professor at the University of Jinan. Her main research interests are the determination of proteins and nucleic acids by photometry and electrochemical immunosensor preparation.

Weihong Tan earned his Ph.D. degree from the University of Michigan in 1993. He is Distinguished University Professor and V. T. and Louis Jackson Professor of Chemistry, Biomedical Engineering and Physiology at the University of Florida. His research interests include chemical biology, bio-analytical chemistry, bionano-technology, molecular engineering and biomedical engineering.
Appendix A. Supporting information
Supplementary data associated with this article can be found in the online version at http://dx.doi.org/10.1016/j.nanoen.2018.01.018.
References
- 1.Sun Y, Seo JH, Takacs CJ, Seifter J, Heeger AJ. Adv Mater. 2011;23:1679–1683. doi: 10.1002/adma.201004301. [DOI] [PubMed] [Google Scholar]
- 2.Jagadamma LK, Abdelsamie M, El Labban A, Aresu E, Ndjawa GON, Anjum DH, Cha D, Beaujuge PM, Amassian A. J Mater Chem A. 2014;2:13321–13331. [Google Scholar]
- 3.Tan MJ, Zhong S, Li J, Chen Z, Chen W. ACS Appl Mater Interfaces. 2013;5:4696–4701. doi: 10.1021/am303004r. [DOI] [PubMed] [Google Scholar]
- 4.Pan ZW, Dai ZR, Wang ZL. Science. 2001;291:1947–1949. doi: 10.1126/science.1058120. [DOI] [PubMed] [Google Scholar]
- 5.Xu S, Wei Y, Kirkham M, Liu J, Mai W, Davidovic D, Snyder RL, Wang ZL. J Am Chem Soc. 2008;130:14958–14959. doi: 10.1021/ja806952j. [DOI] [PubMed] [Google Scholar]
- 6.Zhao K, Yan X, Gu Y, Kang Z, Bai Z, Cao S, Liu Y, Zhang X, Zhang Y. Small. 2016;12:245–251. doi: 10.1002/smll.201502042. [DOI] [PubMed] [Google Scholar]
- 7.Jeong S, Kim MW, Jo Y, Leem Y, Hong W, Kim B, Park S. Nano Energy. 2016;30:208–216. [Google Scholar]
- 8.Wang ZL, Song J. Science. 2006;312:242–246. doi: 10.1126/science.1124005. [DOI] [PubMed] [Google Scholar]
- 9.Yang P, Yan H, Mao S, Russo R, Johnson J, Saykally R, Morris N, Pham J, He R, Choi H-J. Adv Funct Mater. 2002;12:323. [Google Scholar]
- 10.Kind H, Yan H, Messer B, Law M, Yang P. Adv Mater. 2002;14:158. [Google Scholar]
- 11.Moon BJ, Lee KS, Shim J, Park S, Kim SH, Bae S, Park M, Lee C, Choi WK, Yi Y. Nano Energy. 2016;20:221–232. [Google Scholar]
- 12.Choi M, Murillo G, Hwang S, Kim JW, Jung JH, Chen C, Lee M. Nano Energy. 2017;33:462–468. [Google Scholar]
- 13.Zhang JZ. MRS Bull. 2011;36:48–55. [Google Scholar]
- 14.Yang J, Wu J. Nano Energy. 2017;32:232–240. [Google Scholar]
- 15.Cao S, Yan X, Kang Z, Liang Q, Liao X, Zhang Y. Nano Energy. 2016;24:25–31. [Google Scholar]
- 16.Fujishima A. Nature. 1972;238:37–38. doi: 10.1038/238037a0. [DOI] [PubMed] [Google Scholar]
- 17.Tachibana Y, Vayssieres L, Durrant JR. Nat Photonics. 2012;6:511–518. [Google Scholar]
- 18.Kim D, Sakimoto KK, Hong D, Yang P. Angew Chem Int Ed. 2015;54:3259–3266. doi: 10.1002/anie.201409116. [DOI] [PubMed] [Google Scholar]
- 19.Pawar AU, Kim CW, Kang MJ, Kang YS. Nano Energy. 2016;20:156–167. [Google Scholar]
- 20.Kanan MW, Nocera DG. Science. 2008;321:1072–1075. doi: 10.1126/science.1162018. [DOI] [PubMed] [Google Scholar]
- 21.Maeda K, Domen K. Chem Mater. 2009;22:612–623. [Google Scholar]
- 22.Wang ZL. Nano Today. 2010;5:540–552. [Google Scholar]
- 23.Pan C, Dong L, Zhu G, Niu S, Yu R, Yang Q, Liu Y, Wang ZL. Nat Photonics. 2013;7:752–758. [Google Scholar]
- 24.Hu Y, Zhang Y, Chang Y, Snyder RL, Wang ZL. ACS Nano. 2010;4:4220–4224. doi: 10.1021/nn1010045. [DOI] [PubMed] [Google Scholar]
- 25.Wen X, Wu W, Wang ZL. Nano Energy. 2013;2:1093–1100. [Google Scholar]
- 26.Peng L, Hu L, Fang X. Adv Funct Mater. 2014;24:2591–2610. [Google Scholar]
- 27.Liu Y, Yang Q, Zhang Y, Yang Z, Wang ZL. Adv Mater. 2012;24:1410–1417. doi: 10.1002/adma.201104333. [DOI] [PubMed] [Google Scholar]
- 28.Wolcott A, Smith WA, Kuykendall TR, Zhao Y, Zhang JZ. Small. 2009;5:104–111. doi: 10.1002/smll.200800902. [DOI] [PubMed] [Google Scholar]
- 29.Schrier J, Demchenko DO, Alivisatos AP. Nano Lett. 2007;7:2377–2382. doi: 10.1021/nl071027k. [DOI] [PubMed] [Google Scholar]
- 30.Chung J, Myoung J, Oh J, Lim S. J Phys Chem C. 2010;114:21360–21365. [Google Scholar]
- 31.Huang Z, Pan L, Zou J, Zhang X, Wang L. Nanoscale. 2014;6:14044–14063. doi: 10.1039/c4nr05245e. [DOI] [PubMed] [Google Scholar]
- 32.Wang Y, Wang Q, Zhan X, Wang F, Safdar M, He J. Nanoscale. 2013;5:8326–8339. doi: 10.1039/c3nr01577g. [DOI] [PubMed] [Google Scholar]
- 33.Park Y, McDonald KJ, Choi K-S. Chem Soc Rev. 2013;42:2321–2337. doi: 10.1039/c2cs35260e. [DOI] [PubMed] [Google Scholar]
- 34.Moniz SJ, Shevlin SA, Martin DJ, Guo Z, Tang J. Energy Environ Sci. 2015;8:731–759. [Google Scholar]
- 35.Zhu S, Meng Q, Wang L, Zhang J, Song Y, Jin H, Zhang K, Sun H, Wang H, Yang B. Angew Chem Int Ed. 2013;52:3953–3957. doi: 10.1002/anie.201300519. [DOI] [PubMed] [Google Scholar]
- 36.Pang X, Bian H, Wang W, Liu C, Khan MS, Wang Q, Qi J, Wei Q, Du B. Biosens Bioelectron. 2017;91:456–464. doi: 10.1016/j.bios.2016.12.059. [DOI] [PubMed] [Google Scholar]
- 37.Wei H, Jin G, Wang L, Hao L, Na T, Wang Y, Tian W, Sun H, Zhang H, Wang H. Adv Mater. 2014;26:3655–3661. doi: 10.1002/adma.201305500. [DOI] [PubMed] [Google Scholar]
- 38.Dong Y, Choi J, Jeong H, Son DH. J Am Chem Soc. 2015;137:5549–5554. doi: 10.1021/jacs.5b02026. [DOI] [PubMed] [Google Scholar]
- 39.Tada H, Fujishima M, Kobayashi H. Chem Soc Rev. 2011;40:4232–4243. doi: 10.1039/c0cs00211a. [DOI] [PubMed] [Google Scholar]
- 40.Zhang JF, Zhou Y, Yoon J, Kim JS. Chem Soc Rev. 2011;40:3416–3429. doi: 10.1039/c1cs15028f. [DOI] [PubMed] [Google Scholar]
- 41.Wang W, Jimmy CY, Shen Z, Chan DK, Gu T. Chem Commun. 2014;50:10148–10150. doi: 10.1039/c4cc02543a. [DOI] [PubMed] [Google Scholar]
- 42.Foon KA. Blood. 1986;68:1–31. [PubMed] [Google Scholar]
- 43.Zheng T, Tan T, Zhang Q, Fu J-J, Wu J-J, Zhang K, Zhu J-J, Wang H. Nanoscale. 2013;5:10360–10368. doi: 10.1039/c3nr02903d. [DOI] [PubMed] [Google Scholar]
- 44.Lou B, Zhou Z, Gu W, Dong S. Chem ElectroChem. 2016;3:2008–2011. [Google Scholar]
- 45.Zheng T, Tan T, Zhang Q, Fu J, Wu J, Zhang K, Zhu J, Wang H. Nanoscale. 2013;5:10360–10368. doi: 10.1039/c3nr02903d. [DOI] [PubMed] [Google Scholar]
- 46.Chiorazzi N, Rai KR, Ferrarini M. N Engl J Med. 2005;352:804–815. doi: 10.1056/NEJMra041720. [DOI] [PubMed] [Google Scholar]
- 47.Gai P, Ji Y, Wang W, Song R, Zhu C, Chen Y, Zhang J, Zhu J. Nano Energy. 2016;19:541–549. [Google Scholar]
- 48.Wang ZL. Nano Res. 2008;1:1–8. [Google Scholar]
- 49.Wang ZL. Adv Funct Mater. 2008;18:3553–3567. [Google Scholar]
- 50.Wang ZL. Sci Am. 2008;298:82–87. doi: 10.1038/scientificamerican0108-82. [DOI] [PubMed] [Google Scholar]
- 51.Wang XDWZL, Song JH, Liu J, Gao YF. IEEE Perv Comp. 2008;7:49–55. [Google Scholar]
- 52.Yu R, Pan C, Chen J, Zhu G, Wang ZL. Adv Funct Mater. 2013;23:5868–5874. [Google Scholar]
- 53.Malia ER. Anesthesiology. 1967;28:625–625. [Google Scholar]
- 54.Jung YK, Kim KN, Baik JM, Kim B-S. Nano Energy. 2016;30:77–83. [Google Scholar]
- 55.Zhang H, Yang Y, Hou T-C, Su Y, Hu C, Wang ZL. Nano Energy. 2013;2:1019–1024. [Google Scholar]
- 56.Khoshnoud F, Dell D, de Silva CW, Chen Y, Owhadi H, Calay R. Self-powered dynamic systems. Proceedings of Eur Conference Aeron Space Sci. 2013 [Google Scholar]
- 57.Enger CC, Kennedy JH, Michel AG. Trans Am Soc Artif Int Organ. 1965;11:148–148. doi: 10.1097/00002480-196504000-00029. [DOI] [PubMed] [Google Scholar]
- 58.Khoshnoud F, Zhang Y, Shimura R, Shahba A, Jin G, Pissanidis G, Chen YK, De Silva CW. IEEE-ASME Trans Mech. 2015;20:2513–2524. [Google Scholar]
- 59.Khoshnoud F, Esat II, Bonser RH, De Silva CW, McKerns MM, Owhadi H. ASME/IMECE. 2016:65276. [Google Scholar]
- 60.Enger CC, Kennedy JH, Michel AG. Trans Am Soc Artif Int Organ. 1965;11:148–148. doi: 10.1097/00002480-196504000-00029. [DOI] [PubMed] [Google Scholar]
- 61.Lin Z, Chen J, Li X, Zhou Z, Meng K, Wei W, Yang J, Wang ZL. ACS Nano. 2017;11:8830–8837. doi: 10.1021/acsnano.7b02975. [DOI] [PubMed] [Google Scholar]
- 62.Ma Y, Zheng Q, Liu Y, Shi B, Xue X, Ji W, Liu Z, Jin Y, Zou Y, An Z. Nano Lett. 2016;16:6042–6051. doi: 10.1021/acs.nanolett.6b01968. [DOI] [PubMed] [Google Scholar]
- 63.Zheng Q, Zhang H, Shi B, Xue X, Liu Z, Jin Y, Ma Y, Zou Y, Wang X, An Z. ACS Nano. 2016;10:6510–6518. doi: 10.1021/acsnano.6b02693. [DOI] [PubMed] [Google Scholar]
- 64.Chen X, Jiang T, Yao Y, Xu L, Zhao Z, Wang ZL. Adv Funct Mater. 2016;26:4906–4913. [Google Scholar]
- 65.Yu R, Pan C, Chen J, Zhu G, Wang ZL. Adv Funct Mater. 2013;23:5868–5874. [Google Scholar]
- 66.Hu Y, Wang ZL. Nano Energy. 2015;14:3–14. [Google Scholar]
- 67.Zhang SL, Lai YC, He X, Liu R, Zi Y, Wang ZL. Adv Funct Mater. 2017;27:1606695. [Google Scholar]
- 68.Niu S, Wang X, Yi F, Zhou YS, Wang ZL. Nat Commun. 2015;6:8975. doi: 10.1038/ncomms9975. [DOI] [PMC free article] [PubMed] [Google Scholar]
- 69.Tang W, Tian J, Zheng Q, Yan L, Wang J, Li Z, Wang ZL. ACS Nano. 2015;9:7867–7873. doi: 10.1021/acsnano.5b03567. [DOI] [PubMed] [Google Scholar]
- 70.Jin LM, Tao J, Bao RR, Sun L, Pan CF. Sci Rep. 2017;7 doi: 10.1038/s41598-017-10990-y. [DOI] [PMC free article] [PubMed] [Google Scholar]
- 71.Xue H, Yang Q, Wang DY, Luo WJ, Wang WQ, Lin MS, Liang DL, Luo QM. Nano Energy. 2017;38:147–154. [Google Scholar]
- 72.Yang J, Liu PB, Wei XZ, Luo W, Yang J, Jiang H, Wei DP, Shi RY, Shi HF. ACS Appl Mater Interaces. 2017;9:36017–36025. doi: 10.1021/acsami.7b10373. [DOI] [PubMed] [Google Scholar]
- 73.Wang H, Xiang Z, Giorgia P, Mu X, Yang Y, Wang ZL, Lee C. Nano Energy. 2016;23:80–88. [Google Scholar]
- 74.He X, Zi Y, Yu H, Zhang SL, Wang J, Ding W, Zou H, Zhang W, Lu C, Wang ZL. Nano Energy. 2017;39:328–336. [Google Scholar]
- 75.Guo H, Yeh M-H, Zi Y, Wen Z, Chen J, Liu G, Hu C, Wang ZL. ACS Nano. 2017;11:4475–4482. doi: 10.1021/acsnano.7b00866. [DOI] [PubMed] [Google Scholar]
- 76.Yang J, Chen J, Su Y, Jing Q, Li Z, Yi F, Wen X, Wang Z, Wang ZL. Adv Mater. 2015;27:1316–1326. doi: 10.1002/adma.201404794. [DOI] [PubMed] [Google Scholar]
- 77.Chen J, Huang Y, Zhang N, Zou H, Liu R, Tao C, Fan X, Wang ZL. Nat Energy. 2016;1:16138. [Google Scholar]
- 78.Shangguan D, Cao Z, Meng L, Mallikaratchy P, Sefah K, Wang H, Li Y, Tan W. J Proteome Res. 2008;7:2133–2139. doi: 10.1021/pr700894d. [DOI] [PMC free article] [PubMed] [Google Scholar]
- 79.Zhu G, Meng L, Ye M, Yang L, Sefah K, O’Donoghue MB, Chen Y, Xiong X, Huang J, Song E. Chem-Asian J. 2012;7:1630–1636. doi: 10.1002/asia.201101060. [DOI] [PMC free article] [PubMed] [Google Scholar]
- 80.Zhu H, Li J, Zhang XB, Ye M, Tan W. ChemMedChem. 2015;10:39–45. doi: 10.1002/cmdc.201402312. [DOI] [PubMed] [Google Scholar]
- 81.Baek S, Biswas P, Kim J, Kim Y, Lee TI, Myoung J. ACS Appl Mater Interfaces. 2016;8:13018–13026. doi: 10.1021/acsami.6b03258. [DOI] [PubMed] [Google Scholar]
- 82.Pang X, Pan J, Gao P, Wang Y, Wang L, Du B, Wei Q. Biosens Bioelectron. 2015;74:49–58. doi: 10.1016/j.bios.2015.06.030. [DOI] [PubMed] [Google Scholar]
- 83.Wang H, Yuan X, Wang H, Chen X, Wu Z, Jiang L, Xiong W, Zeng G. Appl Catal B. 2016;193:36–46. [Google Scholar]
- 84.Wang L, Wang S, Zhang H, Wang Y, Yang J, Huang W. New J Chem. 2014;38:2530–2537. [Google Scholar]
- 85.Umar A, Akhtar MS, Al-Assiri MS, Al-Hajry A, Algarni H, de Mendonça VR, Masuda Y, Kim SH, Rahman QI. New J Chem. 2015;39:7961–7970. [Google Scholar]
- 86.Wang X, Zhu H, Xu Y, Wang H, Tao Y, Hark S, Xiao X, Li Q. ACS Nano. 2010;4:3302–3308. doi: 10.1021/nn1001547. [DOI] [PubMed] [Google Scholar]
- 87.Tsai T, Wang S, Chen S. J Electroanal Chem. 2011;659:69–75. [Google Scholar]
- 88.Wei Y, Luo L, Ding Y, Si X, Ning Y. Bioelectrochemistry. 2014;98:70–75. doi: 10.1016/j.bioelechem.2014.03.005. [DOI] [PubMed] [Google Scholar]
- 89.Pang X, Pan J, Wang L, Ren W, Gao P, Wei Q, Du B. Biosens Bioelectron. 2015;71:88–97. doi: 10.1016/j.bios.2015.04.014. [DOI] [PubMed] [Google Scholar]
- 90.Yin M, Li Z, Kou J, Zou Z. Energy Environ Sci. 2009;43:8361–8366. doi: 10.1021/es902011h. [DOI] [PubMed] [Google Scholar]
- 91.Ge L, Han C, Liu J. Appl Catal B-Environ. 2011;108–109:100–107. [Google Scholar]
- 92.Yan SC, Lv SB, Li ZS, Zou ZG. Dalton Trans. 2010;39:1488–1491. doi: 10.1039/b914110c. [DOI] [PubMed] [Google Scholar]
- 93.Gao P, Ma H, Yang J, Wu D, Zhang Y, Du B, Fan D, Wei Q. New J Chem. 2015;39:1483–1487. [Google Scholar]
- 94.Cheng C, Amini A, Zhu C, Xu Z, Song H, Wang N. Sci Rep. 2014;4:4181. doi: 10.1038/srep04181. [DOI] [PMC free article] [PubMed] [Google Scholar]
- 95.Neumann O, Zhang D, Tam F, Lal S, Wittung-Stafshede P, Halas NJ. Anal Chem. 2009;81:10002–10006. doi: 10.1021/ac901849k. [DOI] [PubMed] [Google Scholar]
Associated Data
This section collects any data citations, data availability statements, or supplementary materials included in this article.


