

Abstract
Rapid food product analysis is of great interest for quality control and assurance during the production process. Conventional quality control protocols require time and labor intensive sample preparation for analysis by state-of-the-art analytical methods. To reduce overall cost and facilitate rapid qualitative assessments, food products need to be tested with minimal sample preparation. We present a novel and simple method for assessing food product compositions by mass spectrometry using a novel surface acoustic wave nebulization method. This method provides significant advantages over conventional methods requiring no pumps, capillaries, or additional chemicals to enhance ionization for mass spectrometric analysis. In addition, the surface acoustic wave nebulization – mass spectrometry method is ideal for rapid analysis and to investigate certain compounds by using the mass spectra as a type of species-specific fingerprint analysis. We present for the first time surface acoustic wave nebulization generated mass spectra of a variety of fermented food products from a small selection of vinegars, wines, and beers.
Keywords: Mass Spectrometry, Surface Acoustic Wave Nebulization, Vinegar, Wine, Beer - Analysis
1. Introduction
Food production and manufacturing has the largest share in gross manufacturing output in the U.S., reaching 957 billion US$ in 2015 (Nicholson 2017). Consumers expect quality and consistency from food products and manufacturers use quality and consistency as competitive tools to gain and maintain market share. This is especially true in the beverage and condiment industries, where quality control is a significant production cost. In addition, product authentication is important to both producers and customers (Tesfaye et al. 2002).
Traditional methods for analysis and quality control in the spirit and beverage industry include liquid and gas chromatography (LC and GC), photometry, and enzymatic analysis (Phillips et al. 2006). To reduce quality control costs, new methods have been proposed that require less sample preparation and time to obtain qualitative and quantitative results. These methods include the use of principle component analysis combined with high-resolution nuclear magnetic resonance (NMR) or Fourier-transform infrared (FT-IR) spectroscopy (Duarte et al. 2004; Lachenmeier 2007).
Another technique that can reduce analysis cost and time while increasing accuracy, sensitivity, and the number of analytes per measurement is mass spectrometry (MS). Conventional atmospheric pressure ionization MS relies mostly on two methods to introduce a sample into the mass spectrometer for analysis, namely electrospray ionization (ESI) and matrix assisted laser desorption/ionization (MALDI) (Nordhoff et al. 1996). While ESI and MALDI are extremely useful techniques for gas-phase ion generation, the use of these specific sample transfer methods can limit the type of sample that can be analyzed and impose challenges such as capillary clogging and matrix interference of the target analyte’s signal (Cohen and Chait 1996), sometimes requiring dedication of considerable time and effort to troubleshooting and method development. MS has been applied together with high resolution chromatography in the study of beer flavors in the 1980’s (Peppard 1985), while beer phenols have recently been reported for the first time in a detailed study by high resolution MS (Quifer-Rada et al. 2015).
The advancements in novel ambient ionization methods over the past ten years, including desorption electrospray ionization (DESI) (Takats et al. 2004), direct analysis in real time (DART) (Cody et al. 2005), laser ablation electrospray ionization (LAESI) (Nemes and Vertes 2007), rapid evaporative ionization mass spectrometry (REIMS) (Schäfer et al. 2009), paper spray ionization (Wang et al. 2010), and others have greatly expanded MS to new applications at ambient conditions, including the analysis of varying surfaces and living tissues under real life conditions (Dill et al. 2011; Zhang et al. 2017). Several variations of these methods have been developed since then, but few of these techniques have found applications in the food and beverage industry. Notably, DESI has been applied to fruit peels and food stuff extracts to trace agrochemicals (Garcia-Reyes et al. 2009). DART has been used for metabolomic profiling of different beer samples in a study aimed at the development of cost-effective methods to help authenticate food products based on the origin of their ingredients (Cajka et al. 2011).
All of the novel ionizations methods listed here that operate at ambient pressures are widely used in research settings. However, these methods generally require some type of support medium (e.g., carrier gas, ESI) or thermal heating/ionization through a hot electrode, a corona needle, or a laser optical setup in order to achieve sample transfer to the MS (Van Berkel et al. 2008). Therefore, further simplifying and improving the sample transfer into the mass spectrometer will greatly enhance the capability of MS as a low cost and powerful analytical method for the food and beverage industry. In order to address challenges in the sample transfer methods, Goodlett and colleagues recently introduced a novel ambient sample transfer method called surface acoustic wave nebulization (SAWN) (Heron et al. 2010). SAWN is expected to help addressing the challenges complex samples face in MS analyses.
Evolved from the telecommunication and semiconductor industry (Campbell 1989), surface acoustic waves (SAWs) have been applied to a variety of applications including surface patterning, fluidic mixing, sample transport and focusing, and jetting and nebulization (Länge et al. 2008; Yeo and Friend 2014). SAWN takes advantage of the SAW effect that is induced in piezoelectric materials by metallic electrodes (interdigital transducers, IDTs; Fig. 1) at high frequencies to create a fine plume of droplets (Heron et al. 2010; Ho et al. 2011; Huang et al. 2012; Yen et al. 2016). These droplets are readily introduced into the vacuum interface region of a mass spectrometer, further desolvated, and subsequently analyzed. Recently, we showed its application as a versatile tool for the fast analysis of hydrophobic lipid A (Yoon et al. 2012, 2016; Liang et al. 2017), a major component of the outer membrane of Gram-negative bacteria, which is recognized by the host immune system as an endotoxin (Coats et al. 2009). We have further developed the SAWN technology using a standing wave configuration to achieve higher nebulization efficiency (Huang et al. 2016; Liang et al. 2017).
Figure 1.
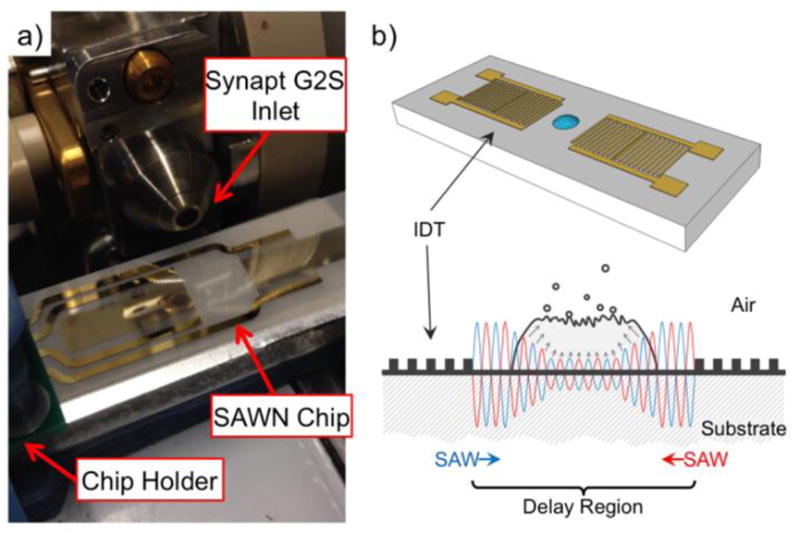
a) SAWN Chip setup coupled to the inlet of a Waters Synapt G2-S. b) Sketch of SAWN principle. Counter-propagating SAW’s generated by interdigital transducers (IDTs) on a piezoelectric material induce strong acoustic streaming and recirculation in the sample droplet which leads to its vertical nebulization.
Here we present for the first time the rapid analysis of food products by SAWN-MS that include a selection of fermented food products such as vinegars, wines, and beers. While standard methods for quality control and targeted analysis exist based on GC-MS and LC-MS (Flamini and Traldi 2010), such methods require significantly more time than SAWN-MS for rapid spot-checking analysis of sample quality during the beverage and condiment manufacturing process. SAWN-MS holds the unique advantage of being an ambient nebulization method, which can be conducted with complex samples. Conventional sample transfer methods such as ESI and nanospray ionization (NSI) require careful consideration of the solvent/sample composition to avoid potential interactions that can lead to clogging of capillary tips, which increases the time required for analysis. SAWN-MS relies on a planar chip surface that is used to nebulize the sample and is therefore not as restricted in its use as ESI, and unlike ESI no voltage is applied directly to the sample making SAWN inherently less likely to break labile bonds during ionization (Huang et al. 2012). This is especially useful when analyzing complexes held together by electrostatic forces (e.g. ion clusters) and/or compounds with very labile functional groups (e.g., nucleotides or phospholipids) (Yoon et al. 2012).
2. Materials and Methods
2.1 Food Samples
Different fermented food products were used as received and diluted up to 100-fold in ultra-purified water (18.2 MΩ; MilliQ, Millipore, Milford, MA, USA) immediately before SAWN-MS analysis. The food products included vinegars, wines, and beer. Vinegars were purchased in local grocery stores: Heinz Distilled White Vinegar (H.J. Heinz Company, L.P, King of Prussia, PA, USA), Rice Vinegar (Kikkoman Sales USA, Inc., San Francisco, CA, USA), and Aged Balsamic Vinegar (Pepper Palace, Sevierville, TN, USA). Wines and beer were sourced from local restaurants: Tapena Red Wine (Freixenet USA, Sonoma, CA, USA), Le Rime Pinot Grigio (Banfi srl, Siena, IT), Goose IPA (Goose Island Beer Company, Chicago, IL, USA), and Bud Light (Anheuser-Busch, St. Louis, MO, USA).
2.2 Surface Acoustic Wave Nebulization – Mass Spectrometry
The Standing Wave (SW) SAWN chips used in our current study were manufactured at the Washington Nanofabrication Facility (University of Washington, Seattle, WA, USA) following an established procedure (Huang et al. 2016; Liang et al. 2017). A detailed summary of the chip fabrication is provided in the Supplemental Material. The SW-SAWN chips were placed in a custom chip holder designed and built using 3D Computer Aided Design Software (123D Design, Autodesk, San Rafael, CA, USA) and a Simple Metal 3D printer (Printrbot, Lincoln, CA, USA). A custom designed PCB board was used to connect the chip through RF cables to the SAWN Controller v1.0 (Deurion LLC, Seattle, WA, USA), which provided control over power and duration of the SAWN (Fig. 1). All experiments in the present study were conducted at a SAW frequency of 9.56 MHz and a power output of 11 W.
The food samples were analyzed on a Waters Synapt G2-S HDMS Q-IMS-oaTOF mass spectrometer (Waters Corporation, Milford, MA, USA; Fig. 1a) in sensitivity mode, with positive and negative ion mode acquisition. The source block temperature was set to 150°C. Sample aliquots of 1 μL were pipetted directly into the delay region of the SAWN chip (i.e., in between the IDT’s, see Fig. 1b) in a discontinuous fashion and the data from five aliquots were averaged to enhance signal-to-noise ratio. Typical SAWN experiments last 2–3 s.
Assignment and verification of selected compounds was conducted with ESI by collision-induced dissociation (CID) on a Finnigan LTQ (Thermo Scientific, San Jose, CA, USA) retrofitted with a bespoke ion funnel (Canterbury et al. 2014) and on a Waters Synapt G2-S HDMS Q-IMS-oaTOF mass spectrometer (Waters Corporation), chosen based on instrument availability at the time of analysis. The same samples used for SAWN-MS were used for compound assignment. The spectral data were acquired over 1 min at different normalized collision energies (NCE = 0 – 30 %).
3. Results and Discussion
The advantages of the SAWN-MS analysis are its flexibility and speed. This technique requires minimal sample pre-processing (e.g., dilution in water or organic solvent prior spotting) and is not limited by the challenges of conventional sample transfer methods for ESI/NSI and MALDI-MS (e.g., clogging of capillaries, the requirement for syringe pumps, laser-optical setups, the use of chemical additives for sample ionization, and matrix interferences at low m/z). In the present work, we focused our investigation on the potential of the SAWN-MS method for rapid analysis of complex food products from the beverage and condiment industry. Some of the fermented food products we have investigated here have been studied in detail before by conventional LC-MS and tandem MS methods. The focus of these studies was often on the identification of specific individual compounds found in vinegars, wines, or beer based on their ion fragments in tandem MS experiments (Araújo et al. 2005; Chinnici et al. 2009). We confirmed key compounds found in our spectra by ESI-CID experiments (see Supplemental Material Fig. S1, S2, S4–S6), while the assignment of other compounds relied on prior assignments published in the literature.
Vinegars are produced through bacterial fermentation of ethanol and contain mainly acetic acid and water. Vinegars are important ingredients for cooking and as preservatives of food through pickling processes. While acetic acid produces ions below 100 m/z that are a general indicator of the presence of vinegar in a sample, it was not of interest for our investigation. Instead, we focused our study on a larger m/z range to investigate the difference between low cost distilled white vinegar (made from corn) and more aromatic rice vinegar (made from rice) and balsamic vinegars (made from concentrated grape juice and must or wine vinegar with the addition of caramel and other additives, respectively). The full mass spectra for these three different vinegar styles are shown in Fig. 2.
Figure 2.

Comparison of three different vinegars based on their mass spectra. Shown are the SAWN mass spectra acquired in positive (top graphs, dark colors) and negative (bottom graphs, light colors) acquisition mode of Heinz White Vinegar (a), Rice Vinegar (b), and Balsamic Vinegar (c).
In the positive ion mode mass spectrum of distilled white vinegar we found repeating ions, spaced equally apart by Δm/z 216, indicating the presence of oligomers with sodium adducts [M+Na]+ (i.e., m/z 455, 671, and 887) and potassium adducts [M+K]+ (i.e., m/z 471, 687, and 903; Fig. 2a). Similarly spaced ions are present in the mass spectra of rice and balsamic vinegar (Fig. 2a–c). All vinegars showed ions at m/z 203 and 219 which are sodium adducts [M+Na]+ and potassium adducts [M+K]+ of glucose or fructose (Konda et al. 2012; Lee et al. 2012). Other ions that were visible in all vinegars and wines were identified as sodium adducts [M+Na]+ and potassium adducts [M+K]+ of disaccharides through tandem MS (i.e., ions at m/z 365 and 381, compare Fig. 2 and 3, see Supplemental Material Fig. S1 & S2).
Figure 3.
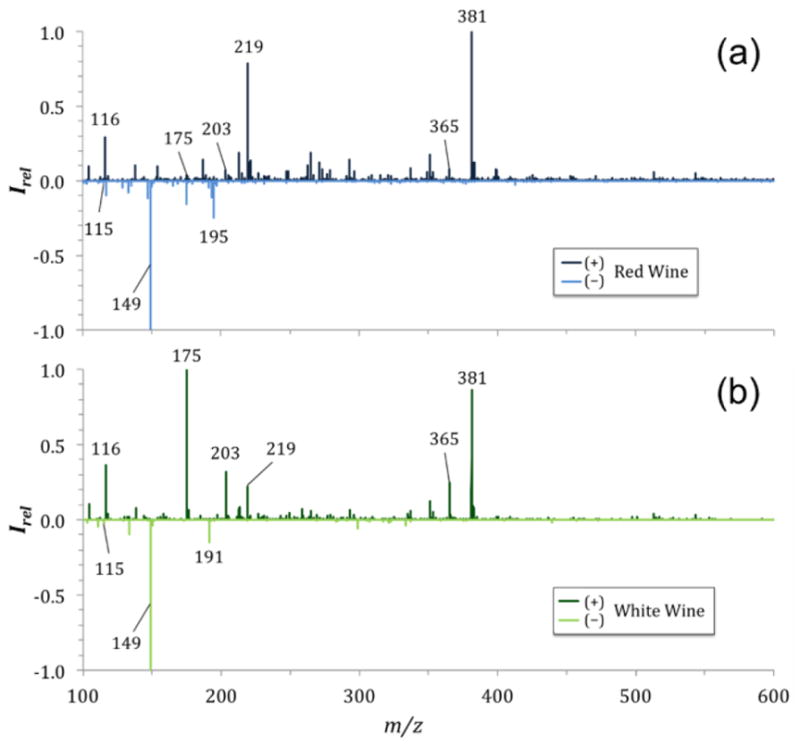
Comparison of red and white wine based on their mass spectra. Shown are the SAWN mass spectra acquired in positive (top graphs, dark colors) and negative (bottom graphs, light colors) acquisition mode of Tapena Red Wine (a) and Le Rime White Wine (b).
The negative ion mode mass spectra of vinegars showed a variety of sample-specific ions, especially at low m/z, which can be associated with organic acids. A prominent ion at m/z 195 [M−H]− was found in all vinegars (Fig. 2) as well as in red wine (Fig. 3a), and has been previously associated with gluconic acid, which occurs naturally in fruits, honey, and wine (Felipe et al. 2014). The differences in intensity of gluconic acid can be used as a strong indicator of the type of sample that is being analyzed as it varies strongly between vinegars and wines (see Supplemental Material Fig. S3). Several organic acids known to be present in grape-based food products may be associated with the ions shown in the negative ion mode mass spectra of vinegars and wines. For example, an ion found at m/z 115 could be associated with fumaric acid [M−H]− and is present in balsamic vinegar (Fig. 2c). Fumaric acid, a common food additive, is used as an acidity regulator and is often used to replace tartaric acid, another food additive used as acidity regulator, antioxidant, and a primary component of wine grapes and fermented wines (Bravdo et al. 1985). Tartrate can be associated with m/z 149 (Amorisco et al. 2012) and is dominant in balsamic vinegar as well as both wines tested, and has low abundance in white vinegar (Fig. 2 and 3). A hydroxycinnamic acid, caffeic acid, is known to be present in red wines and to produce an [M−H]− ion at m/z 179 (Perez-Magarino et al. 1999). We found these ions in the mass spectra of balsamic vinegar, as well as in the mass spectra of the other two vinegars tested, albeit at lower relative abundances.
The mass spectra of balsamic vinegar showed a complex number of potential compounds dominant at low m/z, particularly in negative ion mode acquisition (Fig. 2c). The mass spectra of the wines were less complex in comparison to balsamic vinegar. The dominant species found in the positive ion mode mass spectra of wines are sodium and potassium adducts of glucose or fructose at m/z 203 and 219. The main difference in the mono- and disaccharide mass spectral peaks between vinegars and wines are their relative intensities and intensity ratios (Fig. 2 and 3). This difference in relative intensity is ideal for mass spectral fingerprint analyses to help distinguish different samples.
At low m/z in the positive ion mode mass spectra, an ion at m/z 116 was present dominantly in both wines, as well as the balsamic vinegar, but absent in rice vinegar and distilled vinegar (Fig. 3). The compound was assigned to the amino acid proline (based on CID, see Supplemental Material Fig. S4), which is abundant in grape berries and commonly found in wines even after fermentation (Ough 1968; Costin et al. 2004).
In contrast to the mass spectra acquired from vinegars and wines are those from the two beers tested in our study. The beer mass spectra showed several ions in both positive and negative ion acquisition mode that are equally spaced by Δm/z 162, indicating the presence of di- and oligosaccharides. The ions in the positive acquisition mode mass spectrum of Bud Light and Goose IPA indicate the presence of O-linked saccharides (Fig. 4). These di- and oligosaccharides are the sodium adducts [M+Na]+ and potassium adducts [M+K]+ of maltose, maltotriose, and maltotetraose at m/z of 365 and 381, m/z of 527 and 543, and m/z of 689 and 705, respectively (Fig. 4) (Araújo et al. 2005; Belitz et al. 2009). Larger oligosaccharides are present in our SAWN-mass spectra that were confirmed by tandem MS (see Supplemental Material Fig. S5 and S6). Similarly spaced peaks (Δm/z 162) were found in mass spectra for both beers acquired in negative ion mode, indicating the presence of chloride adducts [M+Cl]− for the same saccharides at m/z 377, 539, and 701, respectively. These ions showed the natural isotope distribution pattern of chlorine (35Cl and 37Cl; see Supplemental Material Fig. S7). Sodium and potassium adducts of glucose (m/z 203 and 219) were present in relative low abundance in both beers. Compared to recent fingerprinting studies of beer with ESI (Araújo et al. 2005), our SAWN-MS method was able to show sodium and potassium adducts in the positive ion acquisition mode of additional oligosaccharides in both beers tested, including maltopentaose (m/z 851 and 867), maltohexaose (m/z 1013 and 1029), and maltoheptaose (m/z 1175 and 1191). Similarly, chloride adducts of the oligosaccharides were found in the negative ion mode acquired mass spectra (Fig. 4). The main differences between the two beers investigated here was in the intensity ratios of the sodium and potassium adducts, which are ideal for distinguishing different types of beer.
Figure 4.
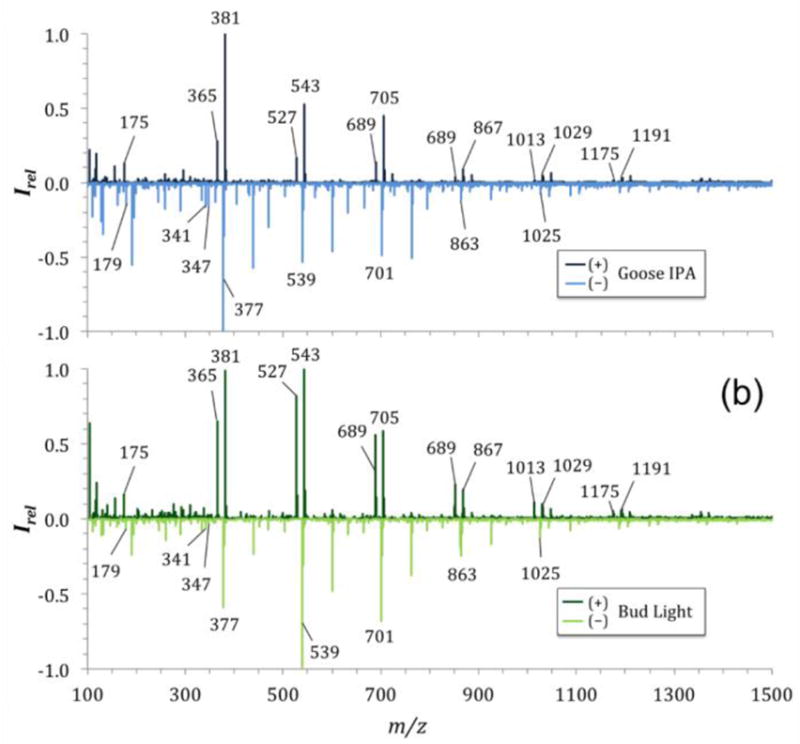
Comparison of beer SAWN mass spectra. Shown are the mass spectra acquired in positive (top graphs, dark colors) and negative (bottom graphs, light colors) acquisition mode of Goose IPA (a) and Bud Light (b).
In negative ion mode we also found several compounds that can be tentatively associated with phenolic acids (Quifer-Rada et al. 2015). Among the compounds found in both beer samples are humulones, a resin component of mature hops, and a key ingredient in the brewing process which gives beer a bitter taste and has known bioactivity (Tagashira et al. 1995). Different humulones were tentatively identified, including Cohumulone I and II and Iso-α-cohumulone (m/z 347), as well as Ad-humulone and n-humulone (m/z 341) (Hofte and Hoeven 1998; García-Villalba et al. 2006; Quifer-Rada et al. 2015). Other compounds found in both mass spectra of beer at low signal/noise can be associated to phenolic acids such as caffeic acids (m/z 179 and 341) and caffeoylquinic acids (m/z 353), as well as apigenins (m/z 431 and 593) which are commonly found in barley, a key ingredient in the beer brewing process (see Supplemental Material Fig. S8) (Frangne et al. 2002; Quinde-Axtell and Baik 2006; Quifer-Rada et al. 2015).
4. Conclusions
We have presented the first mass spectra acquired by SAWN-MS for different vinegars, wines, and beers. The mass spectra were acquired within minutes directly after a simple dilution in water, without the need for sample preparation steps such as centrifugation, extraction, or purification. The SAWN-MS method presented is ideal for spot-checking of samples during production, and can significantly reduce process analysis costs, as it requires no pumps, capillaries, lasers, or chemical enhancers. Compared to other ambient ionization methods such as ESI, SAWN-MS is energetically softer (Huang et al. 2012), leading to less fragmentation during ionization, and allowing more direct composition analysis. SAWN is also compatible with CID to allow structure analysis where needed for identification of target compounds (Yoon et al. 2012). The advantage of softer ionization is exemplified in the SAWN-MS spectra of beer in our study that provided more information than prior ESI reports on beer analysis. Specifically, distinct oligomeric ions series and ratios of sample specific adducts (e.g., sodium, potassium, chloride) can be used from SAWN spectra as direct indicators in targeted fingerprint analysis of food samples. Thus, we believe we have shown here that SAWN-MS can be a powerful tool to reduce quality control costs while helping to increase product quality, consistency, and authenticity.
Supplementary Material
Acknowledgments
The authors acknowledge the support of the NINN at the University of Washington for microfabrication of the SAWN chips.
Funding: This study was funded by the National Institute of Health (Grant 1R01 GM111066-01, D.R.G) and National Science Foundation (Grant 1330459; Deurion LLC). Parts of the study are based upon work supported by the National Science Foundation (Grant # IIP-1059286 to the American Society for Engineering Education). Additional thank is due to the University of Maryland School of Pharmacy Mass Spectrometry Center (SOP1841-IQB2014).
6. Appendix A. Supplementary data
Supplemental data associated with this article can be found in the online version (ESI-CID compound assignments).
Footnotes
7. Compliance with Ethical Standards
Conflict of Interest: D.R.G. has financial interests in Deurion LLC.
Ethical approval: This article does not contain any studies with human participants or animals performed by any of the authors.
Informed consent: Not applicable.
References
- Amorisco A, Locaputo V, Pastore C, Mascolo G. Identification of low molecular weight organic acids by ion chromatography/hybrid quadrupole time-of-flight mass spectrometry during Uniblu-A ozonation. Rapid Commun Mass Spectrom. 2012;27:187–199. doi: 10.1002/rcm.6429. [DOI] [PubMed] [Google Scholar]
- Araújo AS, da Rocha LL, Tomazela DM, et al. Electrospray ionization mass spectrometry fingerprinting of beer. Analyst. 2005;130:884–889. doi: 10.1039/b415252b. [DOI] [PubMed] [Google Scholar]
- Belitz HD, Grosch W, Schieberle P. Food chemistry. 4. Springer-Verlag; Berlin: 2009. [Google Scholar]
- Bravdo B, Hepner Y, Loinger C, et al. Effect of Crop Level and Crop Load on Growth, Yield, Must and Wine Composition, and Quality of Cabernet Sauvignon. Am J Enol Vitic. 1985;36:125–131. [Google Scholar]
- Cajka T, Riddellova K, Tomaniova M, Hajslova J. Ambient mass spectrometry employing a DART ion source for metabolomic fingerprinting/profiling: A powerful tool for beer origin recognition. Metabolomics. 2011;7:500–508. doi: 10.1007/s11306-010-0266-z. [DOI] [Google Scholar]
- Campbell CK. Applications of surface acoustic and shallow bulk acoustic wave devices. Proc IEEE. 1989;77:1453–1484. doi: 10.1109/5.40664. [DOI] [Google Scholar]
- Canterbury JD, Merrihew GE, MacCoss MJ, et al. Comparison of data acquisition strategies on quadrupole ion trap instrumentation for shotgun proteomics. J Am Soc Mass Spectrom. 2014;25:2048–2059. doi: 10.1007/s13361-014-0981-1. [DOI] [PMC free article] [PubMed] [Google Scholar]
- Chinnici F, Guerrero ED, Sonni F, et al. Gas chromatography-mass spectrometry (GC-MS) characterization of volatile compounds in quality vinegars with protected European geographical indication. J Agric Food Chem. 2009;57:4784–4792. doi: 10.1021/jf804005w. [DOI] [PubMed] [Google Scholar]
- Coats SR, Jones JW, Do CT, et al. Human Toll-like receptor 4 responses to P. gingivalis are regulated by lipid A 1- and 4′-phosphatase activities. Cell Microbiol. 2009;11:1587–99. doi: 10.1111/j.1462-5822.2009.01349.x. [DOI] [PMC free article] [PubMed] [Google Scholar]
- Cody RB, Laramee Ja, Durst HD, et al. Versatile new ion source for the analysis of materials in open air under ambient conditions. Anal Chem. 2005;77:2297–2302. doi: 10.1021/ac050162j. [DOI] [PubMed] [Google Scholar]
- Cohen SL, Chait BT. Influence of matrix solution conditions on the MALDI-MS analysis of peptides and proteins. Anal Chem. 1996;68:31–7. doi: 10.1021/ac9507956. [DOI] [PubMed] [Google Scholar]
- Costin JW, Barnett NW, Lewis SW. Determination of proline in wine using flow injection analysis with tris(2,2-bipyridyl)ruthenium(II) chemiluminescence detection. Talanta. 2004;64:894–898. doi: 10.1016/j.talanta.2004.03.065. [DOI] [PubMed] [Google Scholar]
- Dill AL, Eberlin LS, Ifa DR, Cooks RG. Perspectives in imaging using mass spectrometry. Chem Commun (Camb) 2011;47:2741–2746. doi: 10.1039/c0cc03518a. [DOI] [PMC free article] [PubMed] [Google Scholar]
- Duarte IF, Barros A, Almeida C, et al. Multivariate Analysis of NMR and FTIR Data as a Potential Tool for the Quality Control of Beer. J Agric Food Chem. 2004;52:1031–1038. doi: 10.1021/jf030659z. [DOI] [PubMed] [Google Scholar]
- Felipe D, Brambilla L, Porto C, et al. Phytochemical Analysis of Pfaffia glomerata Inflorescences by LC-ESI-MS/MS. Molecules. 2014;19:15720–15734. doi: 10.3390/molecules191015720. [DOI] [PMC free article] [PubMed] [Google Scholar]
- Flamini R, Traldi P. Mass Spectrometry in Grape and Wine Chemistry. John Wiley & Sons, Inc; 2010. [Google Scholar]
- Frangne N, Eggmann T, Koblischke C, et al. Flavone glucoside uptake into barley mesophyll and Arabidopsis cell culture vacuoles. Energization occurs by H(+)-antiport and ATP-binding cassette-type mechanisms. Plant Physiol. 2002;128:726–733. doi: 10.1104/pp.010590. [DOI] [PMC free article] [PubMed] [Google Scholar]
- Garcia-Reyes JF, Jackson AU, Molina-Diaz A, Cooks RG. Desorption Electrospray Ionization Mass Spectrometry for Trace Analysis of Agrochemicals in Food. Anal Chem. 2009;81:820–829. doi: 10.1021/ac802166v. [DOI] [PubMed] [Google Scholar]
- García-Villalba R, Cortacero-Ramírez S, Segura-Carretero A, et al. Analysis of Hop Acids and Their Oxidized Derivatives and Iso-α-acids in Beer by Capillary Electrophoresis–Electrospray Ionization Mass Spectrometry. J Agric Food Chem. 2006;54:5400–5409. doi: 10.1021/jf060207x. [DOI] [PubMed] [Google Scholar]
- Heron SR, Wilson R, Shaffer SA, et al. Surface acoustic wave nebulization of peptides as a microfluidic interface for mass spectrometry. Anal Chem. 2010;82:3985–3989. doi: 10.1021/ac100372c. [DOI] [PMC free article] [PubMed] [Google Scholar]
- Ho J, Tan MK, Go DB, et al. Paper-based microfluidic surface acoustic wave sample delivery and ionization source for rapid and sensitive ambient mass spectrometry. Anal Chem. 2011;83:3260–3266. doi: 10.1021/ac200380q. [DOI] [PubMed] [Google Scholar]
- Hofte AJP, Van Der Hoeven RAM. Characterization of Hop Acids by Liquid Chromatography with Negative Electrospray Ionization Mass Spectrometry. J Am Soc Brew Chem. 1998;56:118–122. doi: 10.1094/ASBCJ-56-0118. [DOI] [Google Scholar]
- Huang Y, Heron SR, Clark A, et al. Standing Waves Improve Surface Acoustic Wave Nebulization Performance. J Mass Spec. 2016;51:424–429. doi: 10.1002/jms.3766. [DOI] [PubMed] [Google Scholar]
- Huang Y, Yoon SH, Heron SR, et al. Surface acoustic wave nebulization produces ions with lower internal energy than electrospray ionization. J Am Soc Mass Spectrom. 2012;23:1062–1070. doi: 10.1007/s13361-012-0352-8. [DOI] [PubMed] [Google Scholar]
- Konda C, Bendiak B, Xia Y. Differentiation of the stereochemistry and anomeric configuration for 1–3 linked disaccharides via tandem mass spectrometry and 18O-labeling. J Am Soc Mass Spectrom. 2012;23:347–358. doi: 10.1007/s13361-011-0287-5. [DOI] [PubMed] [Google Scholar]
- Lachenmeier DW. Rapid quality control of spirit drinks and beer using multivariate data analysis of Fourier transform infrared spectra. Food Chem. 2007;101:825–832. doi: 10.1016/j.foodchem.2005.12.032. [DOI] [Google Scholar]
- Länge K, Rapp BE, Rapp M. Surface acoustic wave biosensors: A review. Anal Bioanal Chem. 2008;391:1509–1519. doi: 10.1007/s00216-008-1911-5. [DOI] [PubMed] [Google Scholar]
- Lee S, Valentine SJ, Reilly JP, Clemmer DE. Analyzing a mixture of disaccharides by IMS-VUVPD-MS. Int J Mass Spectrom. 2012;309:161–167. doi: 10.1016/j.ijms.2011.09.013. [DOI] [PMC free article] [PubMed] [Google Scholar]
- Liang T, Schneider T, Yoon SH, et al. Optimized Surface Acoustic Wave Nebulization Facilitates Bacterial Phenotyping. 2017. [Google Scholar]
- Nemes P, Vertes A. Laser ablation electrospray ionization for atmospheric pressure, in vivo, and imaging mass spectrometry. Anal Chem. 2007;79:8098–8106. doi: 10.1021/ac071181r. [DOI] [PubMed] [Google Scholar]
- Nicholson JR. 2015: What is Made in America. 2017. [Google Scholar]
- Nordhoff E, Kirpekar F, Roepstorff P. Mass spectrometry of nucleic acids. Mass Spectrom Rev. 1996;15:67–138. doi: 10.1002/(sici)1098-2787(1996)15:2<67::aid-mas1>3.0.co;2-8. [DOI] [PubMed] [Google Scholar]
- Ough C. Proline content of grapes and wines. Vitis. 1968;7:321–331. [Google Scholar]
- Peppard TL. The Application of Mass Spectrometry in Beer Flavour Studies. J Inst Brew. 1985;91:16–24. doi: 10.1002/j.2050-0416.1985.tb04299.x. [DOI] [Google Scholar]
- Perez-Magarino S, Revilla I, Gonzalez-San Jose ML, Beltran S. Various applications of liquid chromatography-mass spectrometry to the analysis of phenolic compounds. J Chromatogr A. 1999;847:75–81. doi: 10.1016/S0021-9673(99)00255-1. [DOI] [PubMed] [Google Scholar]
- Phillips KM, Patterson KY, Rasor AS, et al. Quality-control materials in the USDA National Food and Nutrient Analysis Program (NFNAP) Anal Bioanal Chem. 2006;384:1341–1355. doi: 10.1007/s00216-005-0294-0. [DOI] [PubMed] [Google Scholar]
- Quifer-Rada P, Vallverdú-Queralt A, Martínez-Huélamo M, et al. A comprehensive characterisation of beer polyphenols by high resolution mass spectrometry (LC-ESI-LTQ-Orbitrap-MS) Food Chem. 2015;169:336–43. doi: 10.1016/j.foodchem.2014.07.154. [DOI] [PubMed] [Google Scholar]
- Quinde-Axtell Z, Baik BK. Phenolic compounds of barley grain and their implication in food product discoloration. J Agric Food Chem. 2006;54:9978–9984. doi: 10.1021/jf060974w. [DOI] [PubMed] [Google Scholar]
- Schäfer K-C, Dénes J, Albrecht K, et al. In vivo, in situ tissue analysis using rapid evaporative ionization mass spectrometry. Angew Chemie - Int Ed. 2009;48:8240–8242. doi: 10.1002/anie.200902546. [DOI] [PubMed] [Google Scholar]
- Tagashira M, Watanabe M, Uemitsu N. Antioxidative Activity of Hop Bitter Acids and Their Analogs. Biosci Biotechnol Biochem. 1995;59:740–742. doi: 10.1271/bbb.59.740. [DOI] [PubMed] [Google Scholar]
- Takats Z, Wiseman JM, Gologan B, Cooks RG. Mass spectrometry sampling under ambient conditions with desorption electrospray ionization. Science (80-) 2004;306:471–473. doi: 10.1126/science.1104404. [DOI] [PubMed] [Google Scholar]
- Tesfaye W, Morales ML, García-Parrilla MC, Troncoso AM. Wine vinegar: Technology, authenticity and quality evaluation. Trends Food Sci Technol. 2002;13:12–21. doi: 10.1016/S0924-2244(02)00023-7. [DOI] [Google Scholar]
- Van Berkel GJ, Pasilis SP, Ovchinnikova O. Established and emerging atmospheric pressure surface sampling/ionization techniques for mass spectrometry. J Mass Spectrom. 2008;43:1161–1180. doi: 10.1002/jms.1440. [DOI] [PubMed] [Google Scholar]
- Wang H, Liu J, Cooks RG, Ouyang Z. Paper spray for direct analysis of complex mixtures using mass spectrometry. Angew Chem Int Ed Engl. 2010;49:877–880. doi: 10.1002/anie.200906314. [DOI] [PubMed] [Google Scholar]
- Yen GS, Edgar JS, Yoon SH, et al. PDMS microchannels coupled to surface acoustic wave nebulization mass spectrometry. Rapid Commun Mass Spectrom. 2016;30:1096–100. doi: 10.1002/rcm.7531. [DOI] [PubMed] [Google Scholar]
- Yeo LY, Friend JR. Surface Acoustic Wave Microfluidics. Annu Rev Fluid Mech. 2014;46:379–406. doi: 10.1146/annurev-fluid-010313-141418. [DOI] [Google Scholar]
- Yoon SH, Huang Y, Edgar JS, et al. Surface acoustic wave nebulization facilitating lipid mass spectrometric analysis. Anal Chem. 2012;84:6530–6537. doi: 10.1021/ac300807p. [DOI] [PMC free article] [PubMed] [Google Scholar]
- Yoon SH, Liang T, Schneider T, et al. Rapid Lipid A Structure Determination via Surface Acoustic Wave Nebulization and Hierarchical Tandem Mass Spectrometry Algorithm. Rapid Commun Mass Spectrom. 2016;30:2555–2560. doi: 10.1002/rcm.7728. [DOI] [PubMed] [Google Scholar]
- Zhang J, Rector J, Lin JQ, et al. Nondestructive tissue analysis for ex vivo and in vivo cancer diagnosis using a handheld mass spectrometry system. Sci Transl Med. 2017;9:eaan3968. doi: 10.1126/scitranslmed.aan3968. [DOI] [PMC free article] [PubMed] [Google Scholar]
Associated Data
This section collects any data citations, data availability statements, or supplementary materials included in this article.