

Abstract
Compound‐specific 15N analysis of amino acids (AAs) is a powerful tool to determine the trophic position (TP) of organisms. However, it has only been used in a few studies of avian ecology because the AA patterns in the consumer‐diet nitrogen trophic discrimination factor (TDFG lu‐Phe = ∆15 NG lu−∆15 NP he) were unknown in birds until recently, and tropical seabirds have never been investigated with this methodology. Here, we explore the application of this method to tropical seabirds. In this study, we recovered the fossilized bones of tropical seabirds from ornithogenic sediments on two coral islands in the Xisha Islands, South China Sea, as well as the bones and muscle of their predominant food source, flying fish (Exocoetus volitans). Compound‐specific 15N and 13C analyses of AAs in both seabird and fish bone collagen were conducted. The TP of flying fish was calculated based on a widely used single TDFG lu‐Phe approach. We then calculated the TP of tropical seabirds in three different ways: (a) according to the composition of their diet; (b) based on the single TDFG lu‐Phe approach; and (c) using a multi‐TDFG lu‐Phe approach. The results of the multi‐TDFG lu‐Phe approach were much closer to the results based on the composition of the seabird diet than the results of the single TDFG lu‐Phe approach, confirming its applicability for tropical seabirds. For seabird bone samples of different ages, TP determined from the multi‐TDFG lu‐Phe approach was most similar to that of bulk δ15N of bird collagen, with seabirds occupying higher TPs during the Little Ice Age, as previously shown. In addition, the 13C Suess effect was reflected in the AAs δ13C in our samples. This study applied a compound‐specific 15N analysis of AAs to determine the TP of tropical seabirds that has potential to extend to all tropical seabirds many of which are widely distributed and play a key role in the evolution of coral island ecosystems.
Keywords: amino acids, compound‐specific isotope analysis, multi‐TDFGlu‐Phe approach, South China Sea, trophic position, tropical seabirds
1. INTRODUCTION
Stable isotope analysis is a widely used technique in ecology (Fry, 2006), especially for investigations of long‐ranging species. It has been demonstrated that δ15N is a robust marker of trophic position (TP) due to its general increase in organisms along the food chain, when nitrogen fractionates from prey to predator (Hobson, 1999; Post, 2002). With an increase in one trophic level, the average δ15N in tissues tends to be enhanced by about 3.4‰ (DeNiro & Epstein, 1981; Minagawa & Wada, 1984; Post, 2002). Therefore, we can estimate the TP of a consumer by a simple formula: TPconsumer = (δ15Nconsumer–δ15Nproducer)/3.4 + 1, if the organism bulk δ15N of both the consumer (δ15Nconsumer) and producer (δ15Nproducer) are known. However, δ15Nproducer is sometimes difficult to determine because there are temporal and spatial variations in the isotope baseline (producers) and adequate sampling is essential. Thus, we cannot compare the TPs of organisms from different regions if only their δ15N values are known, and a correction based on δ15Nproducer or background δ15N is also needed (Navarro, Coll, Somes, & Olson, 2013). Moreover, because there are likely to be various δ15N values in different tissues of the same organism (e.g., Cano‐Rocabayera, Maceda‐Veiga, & de Sostoa, 2015; Hobson, 1995), determining the actual TP becomes more complex.
To solve these problems, a compound‐specific 15N analysis of amino acids (AAs) has been applied to estimate the TP of organisms (Chikaraishi et al., 2009; McCarthy, Benner, Lee, & Fogel, 2007; McClelland & Montoya, 2002; Ohkouchi et al., 2017). AAs can be divided into two types according to whether the carbon–nitrogen bond cleaves during metabolic transamination accompanied by an obvious isotopic fractionation. Some AAs, including alanine (Ala), valine (Val), isoleucine (Ile), and glutamic acid (Glu), are called “trophic” AAs because they are enriched in δ15N (as high as 10‰) when carbon–nitrogen bonds cleave, whereas other AAs are called “source” AAs, including methionine (Met) and phenylalanine (Phe), and show little change in their δ15N up the food chain because their dominant metabolic processes neither form nor cleave the bonds related to the nitrogen atom (Chikaraishi et al., 2009). Different formulas can be used to estimate the TP of specific groups of organisms, that is, TPGlu/Phe = (δ15NGlu–δ15NPhe–β)/TDFGlu‐Phe + 1, where TDFGlu‐Phe is the trophic discrimination factor and assumed to be 7.6 commonly, β represents the difference in δ15N between the Glu and Phe of primary producers, and differs for C3, C4, and aquatic food webs (β = 3.4 for aquatic food webs) (Chikaraishi, Ogawa, & Ohkouchi, 2010; Chikaraishi et al., 2009). The TPGlu/Phe is based on the δ15N values in Glu and Phe (δ15NGlu and δ15NPhe). This method has been widely used to estimate the TPs of aquatic organisms (Bradley et al., 2015; Chikaraishi, Kashiyama, Ogawa, Kitazato, & Ohkouchi, 2007; Chikaraishi, Steffan, Takano, & Ohkouchi, 2015; Chikaraishi et al., 2014; Nielsen, Popp, & Winder, 2015; Ohkouchi, Tsuda, Chikaraishi, & Tanabe, 2013; Zhang et al., 2016), herbivorous mammals (Ishikawa, Hayashi, Sasaki, Chikaraishi, & Ohkouchi, 2017; Itahashi, Chikaraishi, Ohkouchi, & Yoneda, 2014; Schwartz‐Narbonne, Longstaffe, Metcalfe, & Zazula, 2015; Styring, Sealy, & Evershed, 2010), and humans (Naito et al., 2016; Styring et al., 2010) in both modern‐day and ancient samples. Additionally, δ15N values in proline (Pro) and Phe have been used to estimate the TP of some consumers, for example, Weddell seal (Hückstädt, McCarthy, Koch, & Costa, 2017). However, these formulas are applicable to avian studies only after improving the values of TDFGlu‐Phe and β. An improved formula is necessary and a multi‐TDF calculation is required for such studies because of variations in the TDF between animals within a food web (Germain, Koch, Harvey, & McCarthy, 2013; Hoen et al., 2014).
Using AAs isolated from penguin chick blood, Lorrain et al. (2009) found that the δ15N values of AAs can be used to estimate the relative trophic levels of penguins, but the trophic enrichment factors (TEFs) reported in previous studies were not appropriate to calculate the absolute trophic level for seabirds. McMahon, Polito, Abel, McCarthy, and Thorrold (2015) calculated an avian‐specific nitrogen TDFGlu‐Phe of 3.5 ± 0.4‰, which was significantly lower than the previously reported literature TDFGlu‐Phe value of 7.6‰ (Chikaraishi et al., 2007) after conducting a controlled compound‐specific stable isotope analysis in a feeding experiment on the Gentoo penguin (Pygoscelis papua), and examining the patterns in individual AA stable isotope fractionations between diet and consumer. This could be because of the minimal fractionation of the source AA (Phe), which always has low δ15N values along the chain, and relatively low trophic fractionation of the trophic AA (Glu). A new formula was then proposed to calculate the TP of birds, that is, TPCSIA‐multi TDF = 2+ (δ15NGlu–δ15NPhe–TDF(Glu‐Phe) plankton–β)/TDF(Glu‐Phe) penguin, where TDF(Glu‐Phe) plankton = 7.6‰, TDF(Glu‐Phe) penguin = 3.5‰, and β = 3.4‰ (McMahon et al., 2015). Recently, Hebert et al. (2016) also found that the TDFs based upon the source (Phe) and trophic (Glu) AAs were 4.1 and 5.4 for muscle and red blood cells, respectively, from laboratory and field studies of captive American kestrels and wild herring gulls. This was lower than the values reported for metazoan invertebrates. Besides, stable isotope analyses of feather AAs have also been used to identify penguin migration strategies (Polito et al., 2017). There have only been a few other studies that have focused on avian species through compound specific 15N analyses of AAs (e.g., Quillfeldt et al., 2017).
In addition to δ15N, stable carbon isotopes (δ13C) have been used in many ecological studies to both confirm and further refine the broad interpretations made using bulk isotopic data (e.g., Webb et al., 2018). Generally, AAs are either essential or nonessential. Animals must acquire essential AAs directly from their food (Eagle, 1959). In previous studies, the δ13C values of essential AAs usually showed little or no trophic enrichment between predators and their food, and the TEFs for δ13C values of nonessential AAs were likely to be relevant to the composition and quality of the diet (Howland et al., 2003; McMahon, Fogel, Elsdon, & Thorrold, 2010; McMahon et al., 2015). Thus, δ13C values in AAs, especially essential AAs, have the potential to infer habitat use and source organism production (e.g., Arthur, Kelez, Larsen, Choy, & Popp, 2014; Paolini, Ziller, Laursen, Husted, & Camin, 2015) just like bulk δ13C values (DeNiro & Epstein, 1978). However, many studies have shown that δ13C values in inorganic and organic materials have decreased rapidly since 1850 AD as a result of the 13C Suess effect, which is caused by fossil fuel combustion and the emission of carbon with fewer 13C isotopes (Blight, Hobson, Kyser, & Arcese, 2015; Pereira et al., 2018), for example, δ13C decreased about 1.8‰ until 2014 in the South China Sea (Jia et al., 2013; Wu, Liu, Fu, Xu, Wang, et al., 2017). It is therefore important to pay careful attention to this effect in paleo‐ecological studies using δ13C data (including AAs data). The application of AA δ13C analyses is currently expanding, but further studies are still required to determine the suitability of AA δ13C and δ15N for tracing an animal diets and estimating TP, because carbon and nitrogen isotope ratios vary among different AAs (Nielsen, Clare, Hayden, Brett, & Kratina, 2017).
Tropical seabirds play a key role in the evolution of coral island ecosystems in the tropics (Allaway & Ashford, 1984; Xu et al., 2011), but their TPs have not been analyzed using a compound‐specific stable isotope analysis of their AAs, which has a better precision and possibly can yield new ecological information. Although bulk isotopes of seabirds were analyzed (Wu, Liu, Fu, Xu, Li, et al., 2017), they could not quantify historical seabird TP without data on the δ15N in producers. Tropical seabirds have a simple food source in that they predominantly feed on flying fish (e.g., Exocoetus volitans in this study) and squid (e.g., Loligo chinensis; Cherel et al., 2008; Xu, Liu, & Jiang, 2014). In this study, we focused on the Xisha Islands, South China Sea, where there is an abundance of tropical seabirds (Cao, Pan, & Liu, 2007). In our previous studies, we collected a number of fossilized tropical seabird bones from this location and quantitatively calculated the composition of their diet based on a nitrogen isotope mass balance (Wu, Liu, Fu, Xu, Li, et al., 2017). The characteristics and factors influencing bulk δ13C and δ15N in the muscle and scales of the tropical seabird predominant food source (i.e., flying fish) have previously been analyzed in detail (Wu, Xu, et al., 2017). The average bulk δ13C of plant tissues from the Xisha Islands has also been reported (Wu, Liu, & Xu, 2017), and there is the potential for further studies to assess the possibility of seabirds feeding on plants. In this study, a hypothesis was proposed that flying fish have been the predominant food item for tropical seabirds in the Xisha Islands during the past 1,200 years, as is currently the case (Cao, 2005). We conducted a compound‐specific 15N and 13C analysis of AAs in seabird and fish bone samples to test whether the multi‐TDFGlu‐Phe approach of McMahon et al. (2015) was applicable to tropical seabirds, because both tropical seabirds and penguins are marine foragers. We also investigated the potential ecological significance of AAs δ13C and δ15N at the same time, including what nitrogen and carbon TEFs in AAs indicated and how the TPs of seabirds changed in the past. For comparison, the TP of seabirds based on the composition of their diet (Wu, Liu, Fu, Xu, Li, et al., 2017) was calculated after the TP of flying fish and squid were determined, and the TP of seabirds was therefore based on a single TDFGlu‐Phe approach. Our study was the first to apply a stable isotope analysis of individual AAs to tropical seabirds and could help to generalize previous studies of penguins (McMahon et al., 2015) to other seabirds worldwide.
2. MATERIALS AND METHODS
2.1. Study area and sample collection
The South China Sea (3°00′ – 23°37′N, 99°10′ – 122°10′E) (Figure 1), located in the tropics, is one of the largest marginal seas in the world and is connected to the Pacific Ocean through the Luzon Strait between the Taiwan and Luzon Islands. The Xisha Islands, in the northwest South China Sea, comprise a group of about 30 islands, most of which are coral and have a typical tropical marine climate with a year‐round high temperature (the annual average temperature usually ranges from 26–27°C). The central area of some islands is covered by trees Pisonia grandis and Guettarda speciose and shrubs (Scaevola taccada). According to previous reports (Cao, 2005), many tropical seabirds occur on the islands, with the red‐footed booby (Sula sula) being the most important. Tens of thousands of red‐footed boobies inhabit Dongdao Island in the Xisha Islands (Exploration Group of Xisha Islands of Institute of Soil Science of Chinese Academy of Sciences (CAS), 1977; Hainan Ocean Administration, 1999; Cao et al., 2007).
Figure 1.

Map of the South China Sea showing sampling locations GJ2 and ZS2 at Guangjin and Zhaoshu islands, respectively
Guangjin Island (16°27′N, 111°42′E) has an area of about 0.06 km2, its interior is mainly covered by G. speciosa and P. grandis, and it is bordered by the shrubs S. taccada, Messerschmidia argentea, and Morinda citrifolia. Zhaoshu Island (16°59′N, 112°16′E) has an area of about 0.20 km2; its center is mainly covered by dense patches of S. taccada and a small number of herbaceous Lepturus repens plants that grow at the margins. Unfortunately, we did not observe any seabirds on Guangjin or Zhaoshu Islands during field trips. However, a large number of guano pellets, eggshells, bird bones, fish scales, and fish bones were observed in the coral sand ornithogenic sediments underneath the dense vegetation, providing strong evidence of past seabird activity.
Sample sediment profiles, GJ2 and ZS2, were taken from Guangjin and Zhaoshu islands, respectively (Figure 1). To obtain sufficient seabird remains for analyses, a coarse fraction of sediment samples from an adjacent duplicate pit (about 1 × 1 m) was separated at intervals of 1–2 cm using a 10‐mesh stainless steel sieve in situ. Tropical seabird bones were sorted from these ornithogenic sediment samples and were most likely from red‐footed boobies, which is currently the most abundant species in the Xisha Islands (Cao, 2005; Wu, Liu, Fu, Xu, Li, et al., 2017). Both 210Pb and radiocarbon (AMS14C) dating were used to establish the chronology of the profiles and seabird bones. The results were reported in our earlier studies (Wu, Liu, Fu, Xu, Li, et al., 2017; Xu et al., 2016). Wu, Liu, Fu, Xu, Li, et al. (2017) suggested that these bone samples were well preserved based on their collagen C/N ratios as the ratios were within the range 2.9−3.6 (DeNiro, 1985). The composition of the diet of these tropical seabirds was determined based on a bulk stable nitrogen isotope analysis. To estimate the TP of food sources, three flying fish samples were collected around Yongxing Island (16°50′N, 112°20′E), which is close to both Guangjin and Zhaoshu islands. The samples were frozen at −20°C before defrosting and dissecting.
2.2. Sample preparation and analysis
Before pretreatment and stable isotope analyses, the fish were weighed and their standard length was measured. Bird and fish bones were pretreated, and their collagen was extracted using methods reported in previous studies (Brown, Nelson, Vogel, & Southon, 1988; Longin, 1971; Xu et al., 2014). The bones were cleaned using an ultrasonic bath. After cleaning, the dried bones were gently crushed into small fragments. The chemically cleaned samples were then reacted under vacuum with 1 N HCl to dissolve the bone mineral and release carbon dioxide from bioapatite. The residue was filtered, rinsed with deionized water, and heated at 80°C for 6 hr under slightly acid conditions (pH = 3) to dissolve collagen and leave humic substances in the precipitate. The collagen solution was then collected through centrifugation and dried to isolate pure collagen. Fish muscle samples were treated with (1:1) chloroform/methanol for more than 12 hr to extract and remove lipids (Inamura, Zhang, & Minagawa, 2012).
We used isotope ratio mass spectrometry (IRMS MAT 253; Thermo Fisher Scientific, Waltham, MA, USA) to analyze δ15N and δ13C levels in fish muscle samples after removing lipids (Wu, Liu, Fu, Xu, Li, et al., 2017). Collagen bulk sample δ15N and δ13C were measured using a PDZ Europa ANCA‐GSL elemental analyzer interfaced to a PDZ Europa 20‐20 IRMS (Sercon, Cheshire, UK) at the University of California, Davis (Davis, CA, USA). The stable isotopic composition of the samples was expressed in δ notation as the deviation from standards in parts per thousand (‰), δ15N = [(R sample/R standard) – 1] × 1000 (where R is the ratio 15N/14N and the R standard value is based on atmospheric air nitrogen), and δ13C = [(R sample/R standard) – 1] × 1000 (‰) [where R is the ratio 13C/12C and the R standard value is based on Vienna Pee Dee Belemnite (V‐PDB)]. Analytical precision (the standard deviation) for δ13C and δ15N was less than ±0.1‰ and ±0.2‰, respectively.
Bird and fish bone collagen extracts were also sent to UC Davis for compound‐specific 15N and 13C analysis of AAs, using the method of Walsh, He, and Yarnes (2014). Sample preparation involved acid hydrolysis for the liberation of AAs from proteins and derivatization by methyl chloroformate to produce compounds amenable to gas chromatography (GC) analyses. A condition of pH < 1 is strictly controlled by re‐suspending the dried hydrolysates in 0.4 M HCl prior to derivatization, and this had been proven to avoid uncertainty in the analysis especially for Glu (Sacks & Brenna, 2005; Yarnes & Herszage, 2017). AA derivatives were injected in splitless mode and separated on an Agilent J&W factor FOUR VF‐23 ms column (30 m × 0.25 mm ID, 0.25 μm film thickness; Agilent Technologies, Santa Clara, CA, USA). After separation, AA derivatives were finally converted to N2 and CO2 to enter the spectrometer. The final δ‐values were obtained after adjusting the provisional values to account for changes in linearity and instrumental drift, enabling the correct δ‐values for laboratory standards to be obtained. To ensure the accuracy of data, two mixtures composed of pure amino acids of calibrated δ13C and δ15N and natural materials were used as quality assurance materials and co‐measured with samples during the AAs isotopes analyses. The δ15N and δ13C of 11 AAs [Ala, aspartic acid (Asp), Glu, glycine (Gly), Ile, leucine (Leu), lysine (Lys), Met, Phe, Pro, and Val] were determined by this method.
2.3. Data analysis
The TP of tropical seabirds was estimated using three methods based on: (a) the composition of their diet; (b) a single TDFGlu‐Phe (nitrogen isotope trophic discrimination factor between Glu and Phe) approach; and (c) a multi TDFGlu‐Phe approach.
(a) First, because tropical seabirds in the Xisha Islands predominantly prey on flying fish and squid (Cao, 2005; Wu, Liu, Fu, Xu, Li, et al., 2017), the TP of tropical seabirds was inferred from their diet (TPdiet) as follows:
| (1) |
where f represents the mass proportion of flying fish in the diet of seabirds, which was quantified in our earlier study (Wu, Liu, Fu, Xu, Li, et al., 2017). The flying fish consumed by tropical seabirds had an average muscle bulk δ15N value of 9.2‰ (Wu, Liu, Fu, Xu, Li, et al., 2017). The three flying fish samples had a different mass and standard length from the average values for flying fish in seabird prey (Wu, Liu, Fu, Xu, Li, et al., 2017), and there was a possible difference in the bulk muscle δ15N values because the size of an organism can influence tissue δ15N values (Olsson, Valters, & Burreau, 2000; Wu, Xu, et al., 2017). Thus, a correction was necessary and the average TP in flying fish consumed by seabirds was determined by (TPflying fish sample + (9.2 − δ15Nflying fish sample)/3.4), where TPflying fish sample, and δ15Nflying fish sample represents the average TP and muscle bulk δ15N values in the three flying fish samples used in this study, because TPconsumer = (δ15Nconsumer − δ15Nproducer)/3.4 + 1 (Post, 2002). We adopted the single TDFGlu‐Phe approach (Chikaraishi et al., 2009) to calculate the TP of flying fish as follows:
| (2) |
where δ15NGlu and δ15NPhe represent the stable nitrogen isotope values in bone collagen Glu and Phe, respectively, β represents the difference in the δ15N values between the Glu and Phe of primary producers (3.4‰ for aquatic cyanobacteria and algae), and the literature value of TDFGlu‐Phe was 7.6‰ (Chikaraishi et al., 2010). Thus:
| (3) |
The TP of squid was then inferred from bulk δ15N values in both flying fish and squid muscle (squid in seabird prey had an average muscle bulk δ15N value of 10.2 ± 0.4‰, Wu, Liu, Fu, Xu, Li, et al., 2017), and the nitrogen isotope discrimination factor in the food chain, that is, the bulk δ15N value in tissues tended to increase to about 3.4‰ with an increase in one trophic level (DeNiro & Epstein, 1981; Minagawa & Wada, 1984; Post, 2002). The TP of tropical seabirds (TPdiet) was then calculated using formula (1).
(b) Second, we calculated the TP of tropical seabirds (TPGlu/Phe 1) using the single TDFGlu‐Phe approach (TPCSIA‐single TDF) referred to above [formula (3)].
(c) Finally, we calculated the TP of tropical seabirds (TPGlu/Phe 2) using a multi‐TDFGlu‐Phe approach (TPCSIA‐multi TDF), which included an avian‐specific TDFGlu‐Phe value of penguins (McMahon et al., 2015) because tropical seabirds and penguins are similar in being both seabirds and marine foragers:
| (4) |
where TDF(Glu‐Phe)plankton = 7.6‰, which is typical of plankton and other lower trophic level marine organisms (e.g., Chikaraishi et al., 2007, 2009), and TDF(Glu‐Phe) bird represents the avian‐specific TDFGlu‐Phe value of 3.5 ± 0.4‰ based on a previously reported feeding experiment (McMahon et al., 2015). The TDFGlu‐Phe value was obtained from penguin feathers, but we applied it to our bone samples because in many cases avian feathers and bone collagen have similar bulk δ15N values (Hobson, Alisauskas, & Clark, 1993; Huang, Sun, Long, Wang, & Huang, 2013). Therefore:
| (5) |
In our previous study (Wu, Liu, Fu, Xu, Li, et al., 2017), we calculated the composition of the diet of tropical seabirds over the past 1,200 years and compared the results between different periods, including the Medieval Warm Period (MWP, 850–1200 AD) and the Little Ice Age (LIA, 1400–1850 AD). We calculated the TP of seabirds during these and other periods using formulas (1), (3), and (5).
3. RESULTS
3.1. TP of food sources for tropical seabirds
The results of a compound‐specific 15N analysis of the 11 AAs in flying fish bone collagen indicated the δ15N values of each AA were consistent for the three flying fish samples (Table 1, Figure 2). The TP of the fish was calculated based on the single TDFGlu‐Phe approach [Formula (3)], yielding an average of 2.64 ± 0.10, with a muscle bulk δ15N of 10.1 ± 0.2‰. The average TP of flying fish preyed on by tropical seabirds was TPflying fish = 2.38 ± 0.10 after the correction.
Table 1.
Mass and standard length, muscle δ15N and δ15N values in bulk tissue, and individual amino acids (AAs) of bone collagen for flying fish. TPGlu/Phe 1 was calculated based on formula (3)
| No. | 1 | 2 | 3 | Average |
|---|---|---|---|---|
| Mass (g) | 334.3 | 300.5 | 241.0 | 291.9 ± 38.6 |
| Standard length (cm) | 29.0 | 28.0 | 25.5 | 27.5 ± 1.5 |
| Muscle bulk δ15N (‰) | 10.4 | 10.0 | 10.0 | 10.1 ± 0.2 |
| Collagen bulk δ15N (‰) | 8.0 | 7.3 | 6.7 | 7.3 ± 0.5 |
| Collagen individual AAs δ15N (‰) | ||||
| Ala | 19.7 | 19.2 | 19.7 | 19.6 ± 0.2 |
| Asp | 18.7 | 18.6 | 17.8 | 18.4 ± 0.4 |
| Glu | 18.0 | 19.7 | 19.3 | 19.0 ± 0.7 |
| Gly | –0.4 | –0.9 | –1.8 | –1.0 ± 0.6 |
| Ile | 19.9 | 20.1 | 20.4 | 20.2 ± 0.2 |
| Leu | 18.6 | 18.8 | 17.6 | 18.3 ± 0.5 |
| Lys | 1.8 | 2.5 | 5.2 | 3.2 ± 1.5 |
| Met | 9.3 | 9.6 | 8.9 | 9.3 ± 0.3 |
| Phe | 3.0 | 3.8 | 2.5 | 3.1 ± 0.6 |
| Pro | 14.2 | 14.1 | 12.8 | 13.7 ± 0.6 |
| Val | 22.5 | 22.0 | 21.3 | 21.9 ± 0.5 |
| TPGlu/Phe 1 | 2.53 | 2.63 | 2.76 | 2.64 ± 0.10 |
Figure 2.

The δ15N values in bulk samples (muscle (M) and bone collagen (C)) and individual amino acids (AAs) (in bone collagen) of the three modern‐day flying fish samples
Based on the reported average muscle bulk δ15N value (10.2 ± 0.4‰) of squid in seabird prey (Wu, Liu, Fu, Xu, Li, et al., 2017), the TP of squid TPsquid = 2.38 + (10.2–9.2)/3.4 was 2.67 ± 0.10. Because tropical seabirds predominantly prey on flying fish and squid, their TP based on the composition of their diet was TPdiet = 2.38 × f + 2.67 × (1 – f) + 1 = 3.67–0.29 × f, where f is the proportion of flying fish.
3.2. TP of ancient tropical seabirds
As with the flying fish samples, the overall δ15N values of each AA varied little in the tropical seabird bone samples (Table 2, Figure 3) and the average value of the calculated TP was 2.68 ± 0.10 and 3.44 ± 0.26 using formula (3) and (5), respectively. A statistical analysis indicated that there was a significant difference between the results from these two formulas (Student's t‐test, p < 0.001).
Table 2.
The δ15N values in bulk tissue and individual amino acids (AAs) of seabird collagen and the trophic position (TP) calculated using formulas (3) (TPGlu/Phe 1) and (5) (TPGlu/Phe 2). (“–” means no data because of an insufficient amount of sample)
| No. | 1 | 2 | 3 | 4 | 5 | 6 | 7 | Average |
|---|---|---|---|---|---|---|---|---|
| Age (AD) | 1913 | 1680 | 1574 | 1477 | 1341 | 1082 | 1020 | |
| Profile | ZS2 | ZS2 | GJ2 | GJ2 | ZS2 | GJ2 | GJ2 | |
| Collagen individual AAs δ15N (‰) | ||||||||
| Ala | 18.8 | 17.8 | 19.6 | 18.7 | 20.3 | 20.1 | 18.4 | 19.1 ± 0.8 |
| Asp | 15.6 | 16.6 | 18.6 | 19.0 | 16.7 | 19.1 | 17.0 | 17.5 ± 1.3 |
| Glu | 19.2 | 19.8 | 20.9 | 19.1 | 19.6 | 20.6 | 19.0 | 19.8 ± 0.7 |
| Gly | 8.5 | 8.8 | 11.9 | 11.3 | 8.5 | 9.7 | 9.6 | 9.8 ± 1.3 |
| Ile | 18.6 | 18.1 | 21.0 | 20.8 | 20.1 | 21.7 | 21.0 | 20.2 ± 1.3 |
| Leu | 17.4 | 16.8 | 18.7 | 18.5 | 18.6 | 19.7 | 18.9 | 18.4 ± 0.9 |
| Lys | 3.0 | 7.5 | 6.0 | 5.4 | 4.0 | 5.4 | 4.1 | 5.1 ± 1.4 |
| Met | 9.7 | 10.1 | – | – | 9.5 | – | – | 9.8 ± 0.2 |
| Phe | 4.1 | 2.4 | 4.2 | 4.3 | 2.2 | 4.6 | 3.5 | 3.6 ± 0.9 |
| Pro | 19.4 | 19.7 | 23.6 | 21.9 | 21.9 | 22.3 | 20.4 | 21.3 ± 1.4 |
| Val | 20.9 | 21.1 | 23.7 | 21.7 | 22.2 | 22.0 | 22.0 | 21.9 ± 0.9 |
| Collagen bulk δ15N (‰) | 14.9 | 14.1 | 13.3 | 13.1 | 13.7 | 13.3 | 12.2 | 13.5 ± 0.8 |
| TPGlu/Phe 1 | 2.54 | 2.83 | 2.75 | 2.51 | 2.84 | 2.66 | 2.60 | 2.68 ± 0.10 |
| TPGlu/Phe 2 | 3.14 | 3.78 | 3.61 | 3.07 | 3.80 | 3.40 | 3.27 | 3.44 ± 0.26 |
Figure 3.

The δ15N values in bulk bone collagen samples and individual amino acids (AAs) from ancient tropical seabirds (n = 7 individuals)
3.3. Nitrogen and carbon trophic enrichment in AAs
The TEF values (∆15Nbird‐fish or ∆13Cbird‐fish) for each AA or bulk sample for tropical seabird and flying fish bone δ15N or δ13C values were calculated, and the results are shown in Figures 4 and 5. For “trophic” (Ala, Asp, Glu, Leu, Pro) and “source” (Gly, Phe) AAs, ∆15Nbird‐fish are very low and around 0 except for Gly and Pro, and there is no obvious difference between those in “trophic” and “source” ones (Student`s t‐test, p = 0.16). For essential (Ile, Leu, Phe, Val) and nonessential (Ala, Asp, Glu, Gly, Pro) AAs, there is also no obvious difference between them in ∆13Cbird‐fish (Student`s t‐test, p = 0.08), ∆13Cbird‐fish for most AAs are around 2‰ but are ~0 if the 13C Suess effect (−1.8‰, Jia et al., 2013) was excluded (Figure 5) as bird bones are historical samples but fish bones are in the present. However, we need to point out that what seabirds consume is fish muscle but we used fish bone collagen samples, so we did not calculate the TDFs as they would be meaningless in this analysis.
Figure 4.

Trophic enrichment factors (TEFs) between tropical seabird and flying fish bone AAs (and bulk bone samples) δ15N values (n = 3 for fish and n = 7 for birds)
Figure 5.

Trophic enrichment factors (TEF values) between tropical seabird and flying fish bone AAs (and bulk bone samples) δ13C (n = 3 for fish, and n = 7 for birds). The solid dots represent the results of original data, and the hollow squares are those from original data minus 1.8‰
3.4. TP of seabirds in different periods
The TP of seabirds during the MWP, LIA, and the past 1,200 years calculated from formulas (1), (3), and (5) are shown in Table 3 and Figure 6. Bone collagen δ15N values and the TP calculated from formula (5) (TPGlu/Phe 2) versus age are also plotted in Figure 7. The TP of seabirds from formula (5) (TPGlu/Phe 2) overall changed consistently with bone bulk δ15N values.
Table 3.
Trophic position (TP) of ancient tropical seabirds calculated from the composition of their diet [formula (1), TPdiet], formula (3) (TPGlu/Phe 1), and formula (5) (TPGlu/Phe 2). The composition of the seabird diet is taken from Wu, Liu, Fu, Xu, Li, et al. (2017)
| Period | Seabird diet | TPdiet | TPGlu/Phe 1 | TPGlu/Phe 2 |
|---|---|---|---|---|
| MWP | Flying fish: 88 ± 2%; squid: 12% | 3.41 ± 0.01 | 2.63 ± 0.03 | 3.34 ± 0.06 |
| LIA | Flying fish: 37 ± 30%; squid: 63% | 3.56 ± 0.10 | 2.70 ± 0.14 | 3.40 ± 0.30 |
| Past 1,200 years | Flying fish: 80 ± 40%; squid: 20% | 3.44 ± 0.13 | 2.68 ± 0.12 | 3.44 ± 0.26 |
Figure 6.
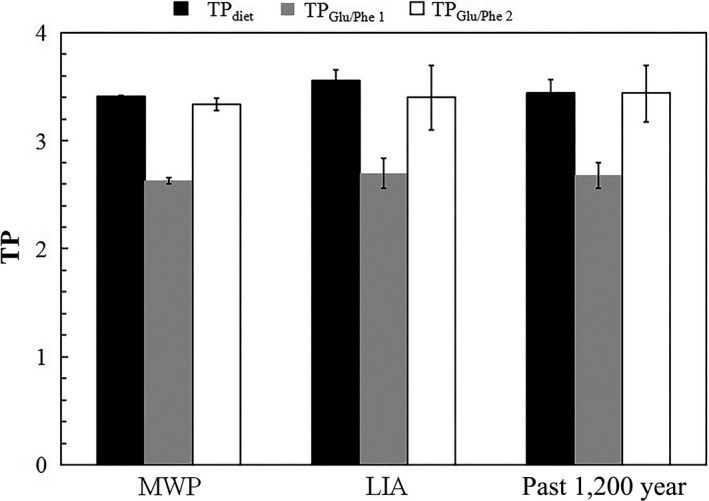
Trophic position (TP) of ancient tropical seabirds calculated from the composition of their diet (formula (1), TP diet), formula (3) (TPG lu/Phe 1), and formula (5) (TPG lu/Phe 2), in different periods [Medieval Warm Period (MWP); Little Ice Age (LIA)]
Figure 7.

Collagen bulk δ15N value and the trophic position (TP) calculated from formula (5) for ancient seabird bone samples
4. DISCUSSION
4.1. Nitrogen and carbon trophic enrichment in AAs
We first analyze the TEFs in AAs between bird and fish bones to preliminarily discuss the tissue‐specific isotopes including AAs isotopes for seabirds and fish. The TEF values (Figures 4 and 5) between tropical seabird and flying fish bone AAs δ15N or δ13C values were quite different from those reported in previous studies of birds (Hebert et al., 2016; McMahon et al., 2015). For example, the avian‐specific nitrogen TEF of Glu was higher (TEFGlu = 3.8 ± 0.6‰) in previous study (McMahon et al., 2015). We initially attributed this to the different organs and tissues used among the different studies. Many studies have identified bulk δ15N and δ13C discrepancies (isotopic fractionation) among different tissue constituents, including avian and fish tissues (e.g., Cano‐Rocabayera et al., 2015; Hobson, 1995; Thorrold, Campana, Jones, & Swart, 1997; Wu, Xu, et al., 2017). The average flying fish bulk collagen δ15N value in the present study was 7.3 ± 0.5‰, which was confusing because the average seabird bone collagen bulk δ15N was 13.5 ± 0.8‰ and should be at a higher trophic level than flying fish, although the actual bulk δ15N difference (13.5‰–7.3‰ = 6.2‰) was very large. However, considering that the average flying fish muscle bulk δ15N value was 10.1 ± 0.2‰, it was reasonable. Thus, the method used to estimate TP based on a compound‐specific 15N analysis of AAs has merit in this respect, and we obtained a reasonable result from all muscle, bone, or other tissue samples of the organisms investigated (Hoen et al., 2014; Nielsen et al., 2015; and this study). As seabird food source is mainly flying fish muscle rather than fish bone collagen, we did not use the TDF value of our data, but cite the result from another study to estimate seabird TP.
In our data, there were larger TEF values for δ13C than reported in a previous study, in which δ13C TEF values between Gentoo penguins and their food source, Atlantic herring (Clupea harengus), were around 0 for essential AAs (Ile, Val, Phe, Leu, etc.), and were also very small (0‰–2.4‰) for nonessential AAs (Gly, Ser, Ala, Asp, Glu, Pro, etc.) (McMahon et al., 2015). The δ13C TEF values in the present study were higher for all essential and nonessential AAs, except Ala and Gly, and the TEF for bulk δ13C (2.6 ± 1.3‰) was higher than reported previously (1.0 ± 0.3‰) (McMahon et al., 2015). In addition to isotopic fractionation among different tissue samples, we suggest that the 13C Suess effect caused by fossil fuel combustion and carbon emissions with fewer 13C isotopes, also led to this difference and is about −1.8‰ (modern‐day data in 2014 minus the data for the period before 1850 AD) in the northwestern South China Sea based on a widely used model (Jia et al., 2013). Almost all of our seabird bone samples were from the period before 1850 AD, but the flying fish were collected in 2014. The collagen AAs δ13C differences between ancient seabird and modern‐day flying fish was first attributed to the 13C effect, and the differences were not due to the AAs being essential or nonessential in our study. There was a possible exception for Ala and Gly because, first seabirds predominantly consume fish muscle, whereas we used bone collagen in the study, and second, squid has accounted for 20% of the diet of the tropical seabirds over the past 1,200 years (Wu, Liu, Fu, Xu, Li, et al., 2017). Because the δ13C value changed little from prey to predator (DeNiro & Epstein, 1978), the average TEF value for δ13C of less than 1‰ (when the Suess effect was excluded) also demonstrated, once again, that the birds in our samples were likely to mainly feed on flying fish (or at least marine organisms) and were tropical seabirds. Terrestrial plants could not contribute to these food sources because plants in the Xisha Islands have an average δ13C value of −28.93 ± 0.81‰ (Wu, Liu, & Xu, 2017), while for our bird bone bulk sample it was −13.3 ± 0.8‰, and for compound‐specific AAs it ranged from −24.6‰ to −8.8‰.
4.2. Comparisons for TP calculations
Flying fish prey on phytoplankton and zooplankton (Wu, Xu, et al., 2017), which have a TP of 1 and ≥2 (~2.5 in some studies), respectively (Rybczynski, Walters, Fritz, & Johnson, 2008; Sommer et al., 2005). Thus, the TP of flying fish should be between 2 and 3 and our result (2.38 ± 0.10) is therefore quite reasonable (Table 1). Other studies also proved the rationality of this result, for example, Choy, Popp, Hannides, and Drazen (2015) reported that Exocoetus volitans had a ∆δ15NGlu‐Phe of 17.4‰, which is quite consistent with that in our study (15.9 ± 0.9‰), Mancini and Bugoni (2014) summarized that δ15N in flying fish is ~3‰ higher than that in plankton and the bulk isotope ratio of nitrogen discriminates at 2–5‰ in each TP. The results of a nitrogen isotope mass balance indicate that flying fish feed primarily on phytoplankton (at least 62 ± 10%) and secondly on zooplankton (at most 38 ± 10%) (Saito, Johnson, Bartholow, & Hanna, 2001; Wu, Liu, Fu, Xu, Li, et al., 2017). The derived TP (2.67 ± 0.10) of squid (L. chinensis) is similar to that of cuttlefish Spirula spirula at 2.5–2.8 (Ohkouchi et al., 2013). Our results generally corresponded to the TPs of marine organisms with similar food sources, which can be inferred from a traditional stable isotope or diet analysis (Lin, 2013). Thus, formula (3) and the single TDFGlu‐Phe approach were applicable for the aquatic organisms investigated in our study.
When we calculated the TP of tropical seabirds based on a compound‐specific δ15N analysis of AAs, we found that the results using formula (3) were unreasonable, with the average value of 2.68 ± 0.12 being only slightly higher than that of flying fish (2.38 ± 0.10). Therefore, the conventional literature value (7.6‰) and widely used formula (3) are not applicable to avian species, although they work well for aquatic organisms (e.g., Bradley et al., 2015; Nielsen et al., 2015; Ohkouchi et al., 2013). However, the average of 3.44 ± 0.26 obtained using formula (5) was nearly the same as that based on the composition of the diet (3.44 ± 0.13) (Tables 2 and 3, Figure 6). Thus, we suggest that the multi‐TDFGlu‐Phe approach and formula (5) from McMahon et al. (2015) are applicable for tropical seabirds. The avian‐specific nitrogen TDF of Glu and Phe (TDFGlu‐Phe = 3.5 ± 0.4‰) was significantly lower than the conventional value reported in the literature (7.6‰), because of the relatively low TEF of the trophic AA Glu (McMahon et al., 2015). According to previous studies, there are several possible reasons for the lower TDFGlu‐Phe values of birds than other taxa, for example, birds grow rapidly and trophic AAs could be less enriched in growing animals; birds with a high TP have high quality food sources (rich in protein and similar AA compositions with birds), and nitrogen is excreted by birds through the production of 15N‐enriched urea and uric acid (Germain et al., 2013; McMahon & McCarthy, 2016). Although formula (5) was derived from penguins, it is suitable for use with tropical seabirds in the South China Sea. The two groups of birds are quite similar in some aspects; for example, penguins and tropical seabirds prey on marine fish and squid. This similar feeding habit may account for the similar nitrogen TDFs (TDF) of AAs. Thus, we can estimate the actual TP of tropical seabirds based only on the δ15N values in their tissue Glu and Phe, which is a simpler and more convenient method. Although the very small nitrogen isotope difference between TEF‐Glu and TEF‐Phe for flying fish and tropical seabirds bones (Figure 4), not 3.5‰ as revealed by penguin feathers, and implies that AAs δ15N in organisms is tissue specific; this did not have an impact on the use of formula (5) to estimate TP.
4.3. TP of tropical seabirds in the past
The TP for each seabird bone sample was calculated based on formula (5) (Table 2). In our previous study, seabirds from the MWP and LIA were combined to compare their relative TP (Wu, Liu, Fu, Xu, Li, et al., 2017). In this manner, the size of the seabirds, which would affect the TP (e.g., Olsson et al., 2000), was excluded. The results based on an analysis of their diet suggested that tropical seabirds were at a TP of 3.41 ± 0.01 in the MWP, and 3.56 ± 0.10 in the LIA. Similarly, the calculations based on formula (5) indicated that seabirds were at a TP of 3.34 ± 0.06 and 3.40 ± 0.30 in the MWP and LIA, respectively. The difference from Wu, Liu, Fu, Xu, Li, et al. (2017) was attributed to a change in their diet, with seabirds preying more on squid, which is at a higher TP, than flying fish in the LIA, while they mainly fed on flying fish in the MWP and in the present‐day (Wu, Liu, Fu, Xu, Li, et al., 2017). This change in their diet was a result of changes in population size, with fewer seabirds in the MWP and the flying fish population therefore being sufficient to feed them. However, there was a larger seabird population size in the LIA (Wu, Liu, Fu, Xu, Li, et al., 2017; Xu et al., 2016), at a time when flying fish were not as abundant and more squid was consumed in the diet of seabirds.
From Figure 7, the TP of seabirds from formula (5) (TPGlu/Phe 2) changed consistently with bone bulk δ15N values, except for the most recent (AD 1913) sample, which was probably more affected by human disturbance, for example, the presence of people on the islands. The similar trends suggest that both bulk δ15N and the multi‐TDFGlu‐Phe approach have the potential to reflect the TP of seabirds. However, the bulk δ15N values only reflect the relative TP and background δ15N changes must also be known. Fortunately, the multi‐TDFGlu‐Phe approach (TPGlu/Phe 2) provides a quantitative TP with no additional conditions, and we can also distinguish the changes in background δ15N values and TP variances of seabirds from δ15NGlu and δ15NPhe. Because seabirds are widely distributed in the tropics and play a key role in the evolution of coral island ecosystems, our study is relevant to many other regions and can be used to inform other studies of the stable isotope ecology of tropical seabirds and coral island ecosystems.
CONFLICT OF INTEREST
The authors have no conflict of interests to declare.
AUTHOR CONTRIBUTIONS
Libin Wu, Xiaodong Liu, and Liqiang Xu designed the study and prepared the manuscript. Xiaodong Liu, Libin Wu, and Liqiang Xu collected the samples. Libin Wu, Linjie Li, and Pingqing Fu performed the experiments. All authors contributed to discussion of the results.
DATA ACCESSIBILITY
All data used in this manuscript are present in the manuscript.
ACKNOWLEDGMENTS
This work was funded by the National Natural Science Foundation of China (Nos. 41376124, 41576183, 41776188 and 41402148), and the Fundamental Research Funds for the Central Universities (Grant number JZ2017HGTB0201). We thank two anonymous reviewers for constructive comments. All members of field study team, including the Chinese People's Liberation Army, and Liguang Sun, Yi Liu, Hong Yan, Jing Huang, Yuhan Luo, Zijun Wu; Xisha Deep Sea Marine Environment Observation and Research Station, South China Sea Institute of Oceanology, Chinese Academy of Sciences and Chang Chen, Daning Li, Lin Chen and Zhenhua Long are acknowledged and thanked for their help in sample collection. We are especially grateful to Steven D. Emslie and Michael J. Polito for their comments on the manuscript and contributions to improving the English.
Wu L, Liu X, Xu L, Li L, Fu P. Compound‐specific 15N analysis of amino acids: A tool to estimate the trophic position of tropical seabirds in the South China Sea. Ecol Evol. 2018;8:8853–8864. 10.1002/ece3.4282
Funding information
This work was funded by the National Natural Science Foundation of China (Nos. 41376124, 41576183, 41776188 and 41402148), and the Fundamental Research Funds for the Central Universities (Grant number JZ2017HGTB0201)
Contributor Information
Libin Wu, Email: wulbustc@mail.ustc.edu.cn.
Xiaodong Liu, Email: ycx@ustc.edu.cn.
REFERENCES
- Allaway, W. G. , & Ashford, A. E. (1984). Nutrient input by seabirds to the forest on a coral island of the Great Barrier Reef. Marine Ecology Progress Series, 19, 297–298. 10.3354/meps019297 [DOI] [Google Scholar]
- Arthur, K. E. , Kelez, S. , Larsen, T. , Choy, C. A. , & Popp, B. N. (2014). Tracing the biosynthetic source of essential amino acids in marine turtles using δ13C fingerprints. Ecology, 95, 1285–1293. 10.1890/13-0263.1 [DOI] [PubMed] [Google Scholar]
- Blight, L. K. , Hobson, K. A. , Kyser, T. K. , & Arcese, P. (2015). Changing gull diet in a changing world: A 150‐year stable isotope (δ13C, δ15N) record from feathers collected in the Pacific Northwest of North America. Global Change Biology, 2, 1497–1507. 10.1111/gcb.12796 [DOI] [PubMed] [Google Scholar]
- Bradley, C. J. , Wallsgrove, N. J. , Choy, C. A. , Drazen, J. C. , Hetherington, E. D. , Hoen, D. K. , & Popp, B. N. (2015). Trophic position estimates of marine teleosts using amino acid compound specific isotopic analysis. Limnology and Oceanography, Methods, 13, 476–493. 10.1002/lom3.10041 [DOI] [Google Scholar]
- Brown, T. A. , Nelson, D. E. , Vogel, J. S. , & Southon, J. R. (1988). Improved collagen extraction by modified Longin method. Radiocarbon, 30, 171–177. 10.1017/S0033822200044118 [DOI] [Google Scholar]
- Cano‐Rocabayera, O. , Maceda‐Veiga, A. , & de Sostoa, A. (2015). Fish fins and scales as non‐lethally sampled tissues for stable isotope analysis in five fish species of north‐eastern Spain. Environmental Biology of Fishes, 98, 925–932. 10.1007/s10641-014-0328-6 [DOI] [Google Scholar]
- Cao, L. (2005). Population ecology of the red‐footed booby on the Xisha archipelago. PhD Dissertation, Lanzhou University.
- Cao, L. , Pan, Y. L. , & Liu, N. F. (2007). Waterbirds of the Xisha archipelago, South China Sea. Waterbirds, 30, 296–300. 10.1675/1524-4695(2007)30[296:WOTXAS]2.0.CO;2 [DOI] [Google Scholar]
- Cherel, Y. , Le Corre, M. , Jaquemet, S. , Ménard, F. , Richard, P. , & Weimerskirch, H. (2008). Resource partitioning within a tropical seabird community: New information from stable isotopes. Marine Ecology Progress Series, 366, 281–291. 10.3354/meps07587 [DOI] [Google Scholar]
- Chikaraishi, Y. , Kashiyama, Y. , Ogawa, N. O. , Kitazato, H. , & Ohkouchi, N. (2007). Metabolic control of nitrogen isotope composition of amino acids in macroalgae and gastropods: Implications for aquatic food web studies. Marine Ecology Progress Series, 342, 85–90. 10.3354/meps342085 [DOI] [Google Scholar]
- Chikaraishi, Y. , Ogawa, N. O. , Kashiyama, Y. , Takano, Y. , Suga, H. , Tomitani, A. , … Ohkouchi, N. (2009). Determination of aquatic food‐web structure based on compound‐specific nitrogen isotopic composition of amino acids. Limnology and Oceanography, Methods, 7, 740–750. 10.4319/lom.2009.7.740 [DOI] [Google Scholar]
- Chikaraishi, Y. , Ogawa, N. O. , & Ohkouchi, N. (2010). Further evaluation of the trophic level estimation based on nitrogen isotopic composition of amino acids. Earth, life, and isotopes. Kyoto, Japan: Kyoto University Press; 415. [Google Scholar]
- Chikaraishi, Y. , Steffan, S. A. , Ogawa, N. O. , Ishikawa, N. F. , Sasaki, Y. , Tsuchiya, M. , & Ohkouchi, N. (2014). High‐resolution food webs based on nitrogen isotopic composition of amino acids. Ecology and Evolution, 4, 2423–2449. 10.1002/ece3.1103 [DOI] [PMC free article] [PubMed] [Google Scholar]
- Chikaraishi, Y. , Steffan, S. A. , Takano, Y. , & Ohkouchi, N. (2015). Diet quality influences isotopic discrimination among amino acids in an aquatic vertebrate. Ecology and Evolution, 5, 2048–2059. 10.1002/ece3.1491 [DOI] [PMC free article] [PubMed] [Google Scholar]
- Choy, C. A. , Popp, B. N. , Hannides, C. , & Drazen, J. C. (2015). Trophic structure and food resources of epipelagic and mesopelagic fishes in the North Pacific Subtropical Gyre ecosystem inferred from nitrogen isotopic compositions. Limnology and Oceanography, 60, 1156–1171. 10.1002/lno.10085 [DOI] [Google Scholar]
- DeNiro, M. J. (1985). Postmortem preservation and alteration of in vivo bone collagen isotope ratios in relation to palaeodietary reconstruction. Nature, 317, 806 10.1038/317806a0 [DOI] [Google Scholar]
- DeNiro, M. J. , & Epstein, S. (1978). Influence of diet on the distribution of carbon isotopes in animals. Geochimica et Cosmochimica Acta, 42, 495–506. 10.1016/0016-7037(78)90199-0 [DOI] [Google Scholar]
- DeNiro, M. J. , & Epstein, S. (1981). Influence of diet on the distribution of nitrogen isotopes in animals. Geochimica et Cosmochimica Acta, 45, 341–351. 10.1016/0016-7037(81)90244-1 [DOI] [Google Scholar]
- Eagle, H. (1959). Amino acid metabolism in mammalian cell cultures. Science, 130, 432–437. 10.1126/science.130.3373.432 [DOI] [PubMed] [Google Scholar]
- Exploration Group of Xisha Islands of Institute of Soil Science of Chinese Academy of Sciences (CAS) (1977). Soil and Guano Phosphorus Mine in Xi‐Sha. Beijing, China: Science Press; (in Chinese with English abstract). [Google Scholar]
- Fry, B. (2006). Stable isotope ecology. New York, NY: Springer; 10.1007/0-387-33745-8 [DOI] [Google Scholar]
- Germain, L. R. , Koch, P. L. , Harvey, J. , & McCarthy, M. D. (2013). Nitrogen isotope fractionation in amino acids from harbor seals: Implications for compound‐specific trophic position calculations. Marine Ecology Progress Series, 482, 265–277. 10.3354/meps10257 [DOI] [Google Scholar]
- Hainan Ocean Administration (1999). The professional proceedings of the integrated investigation research on sea Islands resource of Hainan province. Beijing, China: China Ocean Press; 1–1174 (in Chinese). [Google Scholar]
- Hebert, C. E. , Popp, B. N. , Fernie, K. J. , Ka'apu‐Lyons, C. , Rattner, B. A. , & Wallsgrove, N. (2016). Amino acid specific stable nitrogen isotope values in avian tissues: Insights from captive American kestrels and wild herring gulls. Environmental Science & Technology, 50, 12928–12937. 10.1021/acs.est.6b04407 [DOI] [PubMed] [Google Scholar]
- Hobson, K. A. (1995). Reconstructing avian diets using stable‐carbon and nitrogen isotope analysis of egg components: Patterns of isotopic fractionation and turnover. Condor, 97, 752–762. 10.2307/1369183 [DOI] [Google Scholar]
- Hobson, K. A. (1999). Tracing origins and migration of wildlife using stable isotopes: A review. Oecologia, 120, 314–326. 10.1007/s004420050865 [DOI] [PubMed] [Google Scholar]
- Hobson, K. A. , Alisauskas, R. T. , & Clark, R. G. (1993). Stable‐nitrogen isotope enrichment in avian tissues due to fasting and nutritional stress: Implications for isotopic analyses of diet. Condor, 95, 388–394. 10.2307/1369361 [DOI] [Google Scholar]
- Hoen, D. K. , Kim, S. L. , Hussey, N. E. , Wallsgrove, N. J. , Drazen, J. C. , & Popp, B. N. (2014). Amino acid 15N trophic enrichment factors of four large carnivorous fishes. Journal of Experimental Marine Biology and Ecology, 453, 76–83. 10.1016/j.jembe.2014.01.006 [DOI] [Google Scholar]
- Howland, M. R. , Corr, L. T. , Young, S. M. , Jones, V. , Jim, S. , Van Der Merwe, N. J. , … Evershed, R. P. (2003). Expression of the dietary isotope signal in the compound‐specific δ13C values of pig bone lipids and amino acids. International Journal of Osteoarchaeology, 13, 54–65. 10.1002/(ISSN)1099-1212 [DOI] [Google Scholar]
- Huang, T. , Sun, L. G. , Long, N. Y. , Wang, Y. H. , & Huang, W. (2013). Penguin tissue as a proxy for relative krill abundance in East Antarctica during the Holocene. Scientific Reports, 3, 2807 10.1038/srep02807 [DOI] [PMC free article] [PubMed] [Google Scholar]
- Hückstädt, L. A. , McCarthy, M. D. , Koch, P. L. , & Costa, D. P. (2017). What difference does a century make? Shifts in the ecosystem structure of the Ross Sea, Antarctica, as evidenced from a sentinel species, the Weddell seal Proceedings of the Royal Society B. The Royal Society, 284, 20170927 10.1098/rspb.2017.0927 [DOI] [PMC free article] [PubMed] [Google Scholar]
- Inamura, O. , Zhang, J. , & Minagawa, M. (2012). δ13C and δ15N values in scales of Micropterus salmoides largemouth bass as a freshwater environmental indicator. Rapid Communications in Mass Spectrometry, 26, 17–24. 10.1002/rcm.5288 [DOI] [PubMed] [Google Scholar]
- Ishikawa, N. F. , Hayashi, F. , Sasaki, Y. , Chikaraishi, Y. , & Ohkouchi, N. (2017). Trophic discrimination factor of nitrogen isotopes within amino acids in the dobsonfly Protohermes grandis (Megaloptera: Corydalidae) larvae in a controlled feeding experiment. Ecology and Evolution, 7, 1674–1679. 10.1002/ece3.2728 [DOI] [PMC free article] [PubMed] [Google Scholar]
- Itahashi, Y. , Chikaraishi, Y. , Ohkouchi, N. , & Yoneda, M. (2014). Refinement of reconstructed ancient food webs based on the nitrogen isotopic compositions of amino acids from bone collagen: A case study of archaeological herbivores from Tell Ain el‐Kerkh, Syria. Geochemical Journal, 48, e15–e19. 10.2343/geochemj.2.0318 [DOI] [Google Scholar]
- Jia, G. D. , Xu, S. D. , Chen, W. F. , Lei, F. , Bai, Y. , & Huh, C. A. (2013). 100‐year ecosystem history elucidated from inner shelf sediments off the Pearl River estuary, China. Marine Chemistry, 151, 47–55. 10.1016/j.marchem.2013.02.005 [DOI] [Google Scholar]
- Lin, G. H. (2013). Stable isotope ecology. Beijing, China: Higher Education Press. [Google Scholar]
- Longin, R. (1971). New method of collagen extraction for radiocarbon dating. Nature, 230, 241–242. 10.1038/230241a0 [DOI] [PubMed] [Google Scholar]
- Lorrain, A. , Graham, B. , Ménard, F. , Popp, B. , Bouillon, S. , Van Breugel, P. , & Cherel, Y. (2009). Nitrogen and carbon isotope values of individual amino acids: A tool to study foraging ecology of penguins in the Southern Ocean. Marine Ecology Progress Series, 391, 293–306. 10.3354/meps08215 [DOI] [Google Scholar]
- Mancini, P. L. , & Bugoni, L. (2014). Resources partitioning by seabirds and their relationship with other consumers at and around a small tropical archipelago. ICES Journal of Marine Science, 71, 2599–2607. 10.1093/icesjms/fsu105 [DOI] [Google Scholar]
- McCarthy, M. D. , Benner, R. , Lee, C. , & Fogel, M. L. (2007). Amino acid nitrogen isotopic fractionation patterns as indicators of heterotrophy in plankton, particulate, and dissolved organic matter. Geochimica et Cosmochimica Acta, 71, 4727–4744. 10.1016/j.gca.2007.06.061 [DOI] [Google Scholar]
- McClelland, J. W. , & Montoya, J. P. (2002). Trophic relationships and the nitrogen isotopic composition of amino acids in plankton. Ecology, 83, 2173–2180. 10.1890/0012-9658(2002)083[2173:TRATNI]2.0.CO;2 [DOI] [Google Scholar]
- McMahon, K. W. , Fogel, M. L. , Elsdon, T. S. , & Thorrold, S. R. (2010). Carbon isotope fractionation of amino acids in fish muscle reflects biosynthesis and isotopic routing from dietary protein. Journal of Animal Ecology, 79, 1132–1141. 10.1111/j.1365-2656.2010.01722.x [DOI] [PubMed] [Google Scholar]
- McMahon, K. W. , & McCarthy, M. D. (2016). Embracing variability in amino acid δ15N fractionation: Mechanisms, implications, and applications for trophic ecology. Ecosphere, 7(12). [Google Scholar]
- McMahon, K. W. , Polito, M. J. , Abel, S. , McCarthy, M. D. , & Thorrold, S. R. (2015). Carbon and nitrogen isotope fractionation of amino acids in an avian marine predator, the gentoo penguin (Pygoscelis papua). Ecology and Evolution, 5, 1278–1290. 10.1002/ece3.1437 [DOI] [PMC free article] [PubMed] [Google Scholar]
- Minagawa, M. , & Wada, E. (1984). Stepwise enrichment of 15N along food chains: Further evidence and the relation between δ15N and animal age. Geochimica et Cosmochimica Acta, 48, 1135–1140. 10.1016/0016-7037(84)90204-7 [DOI] [Google Scholar]
- Naito, Y. I. , Chikaraishi, Y. , Drucker, D. G. , Ohkouchi, N. , Semal, P. , Wißing, C. , & Bocherens, H. (2016). Ecological niche of Neanderthals from Spy Cave revealed by nitrogen isotopes of individual amino acids in collagen. Journal of Human Evolution, 93, 82–90. 10.1016/j.jhevol.2016.01.009 [DOI] [PubMed] [Google Scholar]
- Navarro, J. , Coll, M. , Somes, C. J. , & Olson, R. J. (2013). Trophic niche of squids: Insights from isotopic data in marine systems worldwide. Deep‐Sea Research Part II. Topical Studies in Oceanography, 95, 93–102. 10.1016/j.dsr2.2013.01.031 [DOI] [Google Scholar]
- Nielsen, J. M. , Clare, E. L. , Hayden, B. , Brett, M. T. , & Kratina, P. (2017). Diet tracing in ecology: Method comparison and selection. Methods in Ecology and Evolution, 9, 1–14. [Google Scholar]
- Nielsen, J. M. , Popp, B. N. , & Winder, M. (2015). Meta‐analysis of amino acid stable nitrogen isotope ratios for estimating trophic position in marine organisms. Oecologia, 178, 631–642. 10.1007/s00442-015-3305-7 [DOI] [PubMed] [Google Scholar]
- Ohkouchi, N. , Chikaraishi, Y. , Close, H. G. , Fry, B. , Larsen, T. , Madigan, D. J. , … Yokoyama, Y. (2017). Advances in the application of amino acid nitrogen isotopic analysis in ecological and biogeochemical studies. Organic Geochemistry, 113, 150–174. 10.1016/j.orggeochem.2017.07.009 [DOI] [Google Scholar]
- Ohkouchi, N. , Tsuda, R. , Chikaraishi, Y. , & Tanabe, K. (2013). A preliminary estimate of the trophic position of the deep‐water ram's horn squid Spirula spirula based on the nitrogen isotopic composition of amino acids. Marine Biology, 160, 773–779. 10.1007/s00227-012-2132-1 [DOI] [Google Scholar]
- Olsson, A. , Valters, K. , & Burreau, S. (2000). Concentrations of organochlorine substances in relation to fish size and trophic position: A study on perch (Perca fluviatilis L.). Environmental Science & Technology, 34, 4878–4886. 10.1021/es991400t [DOI] [Google Scholar]
- Paolini, M. , Ziller, L. , Laursen, K. H. , Husted, S. , & Camin, F. (2015). Compound‐specific δ15N and δ13C analyses of amino acids for potential discrimination between organically and conventionally grown wheat. Journal of Agricultural and Food Chemistry, 63, 5841–5850. 10.1021/acs.jafc.5b00662 [DOI] [PubMed] [Google Scholar]
- Pereira, N. S. , Sial, A. N. , Kilbourne, K. H. , Liu, S.‐C. , Shen, C.‐C. , Ullmann, C. V. , … Braga, B. L. S. S. (2018). Carbon stable isotope record in the coral species Siderastrea stellata: A link to the Suess Effect in the tropical South Atlantic Ocean. Palaeogeography, Palaeoclimatology, Palaeoecology, 497, 82–90 10.1016/j.palaeo.2018.02.007 10.1016/j.palaeo.2018.02.007 [DOI] [Google Scholar]
- Polito, M. J. , Hinke, J. T. , Hart, T. , Santos, M. , Houghton, L. A. , & Thorrold, S. R. (2017). Stable isotope analyses of feather amino acids identify penguin migration strategies at ocean basin scales. Biology Letters, 13, 20170241 10.1098/rsbl.2017.0241 [DOI] [PMC free article] [PubMed] [Google Scholar]
- Post, D. M. (2002). Using stable isotopes to estimate trophic position: Models, methods, and assumptions. Ecology, 83, 703–718. 10.1890/0012-9658(2002)083[0703:USITET]2.0.CO;2 [DOI] [Google Scholar]
- Quillfeldt, P. , Thorn, S. , Richter, B. , Nabte, M. , Coria, N. , Masello, J. F. , … Libertelli, M. (2017). Testing the usefulness of hydrogen and compound‐specific stable isotope analyses in seabird feathers: A case study in two sympatric Antarctic storm‐petrels. Marine Biology, 164, 192 10.1007/s00227-017-3224-8 [DOI] [Google Scholar]
- Rybczynski, S. M. , Walters, D. M. , Fritz, K. M. , & Johnson, B. R. (2008). Comparing trophic position of stream fishes using stable isotope and gut contents analyses. Ecology of Freshwater Fish, 17, 199–206. 10.1111/j.1600-0633.2007.00289.x [DOI] [Google Scholar]
- Sacks, G. L. , & Brenna, J. T. (2005). 15N/14N position‐specific isotopic analyses of polynitrogenous amino acids. Analytical Chemistry, 77, 1013–1019. 10.1021/ac048903o [DOI] [PubMed] [Google Scholar]
- Saito, L. , Johnson, B. M. , Bartholow, J. , & Hanna, R. B. (2001). Assessing ecosystem effects of reservoir operations using food web–energy transfer and water quality models. Ecosystems, 4, 105–125. 10.1007/s100210000062 [DOI] [Google Scholar]
- Schwartz‐Narbonne, R. , Longstaffe, F. J. , Metcalfe, J. Z. , & Zazula, G. (2015). Solving the woolly mammoth conundrum: Amino acid 15N‐enrichment suggests a distinct forage or habitat. Scientific Reports, 5, 9791 10.1038/srep09791 [DOI] [PMC free article] [PubMed] [Google Scholar]
- Sommer, U. , Hansen, T. , Blum, O. , Holzner, N. , Vadstein, O. , & Stibor, H. (2005). Copepod and microzooplankton grazing in mesocosms fertilised with different Si: N ratios: No overlap between food spectra and Si: N influence on zooplankton trophic level. Oecologia, 142, 274–283. 10.1007/s00442-004-1708-y [DOI] [PubMed] [Google Scholar]
- Styring, A. K. , Sealy, J. C. , & Evershed, R. P. (2010). Resolving the bulk δ15N values of ancient human and animal bone collagen via compound‐specific nitrogen isotope analysis of constituent amino acids. Geochimica et Cosmochimica Acta, 74, 241–251. 10.1016/j.gca.2009.09.022 [DOI] [Google Scholar]
- Thorrold, S. R. , Campana, S. E. , Jones, C. M. , & Swart, P. K. (1997). Factors determining δ13C and δ18O fractionation in aragonitic otoliths of marine fish. Geochimica et Cosmochimica Acta, 61, 2909–2919. 10.1016/S0016-7037(97)00141-5 [DOI] [Google Scholar]
- Walsh, R. , He, S. , & Yarnes, C. T. (2014). Compound‐specific stable isotope analysis of amino acids by GC‐C‐IRMS of methyl chloroformate derivatives. Rapid Communications in Mass Spectrometry, 28, 96–108. 10.1002/rcm.6761 [DOI] [PubMed] [Google Scholar]
- Webb, E. C. , Honch, N. V. , Dunn, P. J. , Linderholm, A. , Eriksson, G. , Lidén, K. , & Evershed, R. P. (2018). Compound‐specific amino acid isotopic proxies for distinguishing between terrestrial and aquatic resource consumption. Archaeological and Anthropological Sciences, 10, 1–18. 10.1007/s12520-015-0309-5 [DOI] [Google Scholar]
- Wu, L. B. , Liu, X. D. , Fu, P. Q. , Xu, L. Q. , Li, D. N. , & Li, Y. L. (2017). Dietary change in seabirds on Guangjin Island, South China Sea, over the past 1200 years inferred from stable isotope analysis. Holocene, 27, 331–338. 10.1177/0959683616660163 [DOI] [Google Scholar]
- Wu, L. B. , Liu, X. D. , Fu, P. Q. , Xu, L. Q. , Wang, X. Y. , Sun, Y. , & Li, Y. L. (2017). Identification and stable isotope analyses of flying fish scales from ornithogenic sediments at three islands in the South China Sea. Marine Ecology Progress Series, 585, 175–183. 10.3354/meps12382 [DOI] [Google Scholar]
- Wu, L. B. , Liu, X. D. , & Xu, L. Q. (2017). Change of organic δ13C in ornithogenic sediments of the Xisha archipelago, South China Sea and its environmental implication. Acta Geologica Sinica, English Edition, 91, 1109–1119. 10.1111/1755-6724.13327 [DOI] [Google Scholar]
- Wu, L. B. , Xu, L. Q. , Sun, J. , Wang, X. Y. , Wei, Y. Y. , Li, Y. L. , & Liu, X. D. (2017). Correlation of δ13C and δ15N in flying fish (Exocoetus volitans) muscle and scales from the South China Sea. Oceanological and Hydrobiological Studies, 46, 307–313. [Google Scholar]
- Xu, L. Q. , Liu, X. D. , & Jiang, S. (2014). Late‐Holocene seabird palaeodietary record from Ganquan Island, South China Sea. Quaternary International, 333, 139–145. 10.1016/j.quaint.2014.01.001 [DOI] [Google Scholar]
- Xu, L. Q. , Liu, X. D. , Sun, L. G. , Yan, H. , Liu, Y. , Luo, Y. H. , & Huang, J. (2011). Geochemical evidence for the development of coral island ecosystem in the Xisha Archipelago of South China Sea from four ornithogenic sediment profiles. Chemical Geology, 286, 135–145. [Google Scholar]
- Xu, L. Q. , Liu, X. D. , Wu, L. B. , Sun, L. G. , Zhao, J. J. , & Chen, L. (2016). Decline of recent seabirds inferred from a composite 1000‐year record of population dynamics. Scientific Reports, 6, 35191 10.1038/srep35191 [DOI] [PMC free article] [PubMed] [Google Scholar]
- Yarnes, C. , & Herszage, J. (2017). The relative influence of derivatization and normalization procedures on the compound‐specific stable isotope analysis of nitrogen in amino acids. Rapid Communications in Mass Spectrometry, 31, 693–704. 10.1002/rcm.7832 [DOI] [PubMed] [Google Scholar]
- Zhang, Z. Y. , Tian, J. , Xiao, H. W. , Zheng, N. J. , Gao, X. F. , Zhu, R. G. , & Xiao, H. W. (2016). A reliable compound‐specific nitrogen isotope analysis of amino acids by GC‐C‐IRMS following derivatisation into N‐pivaloyl‐iso‐propyl (NPIP) esters for high‐resolution food webs estimation. Journal of Chromatography B, 1033, 382–389. 10.1016/j.jchromb.2016.09.004 [DOI] [PubMed] [Google Scholar]
Associated Data
This section collects any data citations, data availability statements, or supplementary materials included in this article.
Data Availability Statement
All data used in this manuscript are present in the manuscript.