

Abstract
Bile acids released postprandially can modify the rate and extent of lipophilic compounds’ absorption. This study aimed to predict the enterohepatic circulation (EHC) of total bile acids (TBAs) in response to caloric intake from their spillover in plasma. A model for TBA EHC was combined with a previously developed gastric emptying (GE) model. Longitudinal gallbladder volumes and TBA plasma concentration data from 30 subjects studied after ingestion of four different test drinks were supplemented with literature data. Postprandial gallbladder refilling periods were implemented to improve model predictions. The TBA hepatic extraction was reduced with the high‐fat drink. Basal and nutrient‐induced gallbladder emptying rates were altered by type 2 diabetes (T2D). The model was predictive of the central trend and the variability of gallbladder volume and TBA plasma concentration for all test drinks. Integration of this model within physiological pharmacokinetic modeling frameworks could improve the predictions for lipophilic compounds’ absorption considerably.
Study Highlights.
WHAT IS THE CURRENT KNOWLEDGE ON THE TOPIC?
Due to their solubilizing action, bile acids are essential for the intestinal absorption of lipophilic drug compounds. However, the difficulty of direct intestinal sampling combined with the high variability in bile secretion and recirculation processes makes the determination of the local intestinal bile acid concentrations challenging.
WHAT QUESTION DID THIS STUDY ADDRESS?
Can the postprandial spillover of bile acids in plasma be linked to the EHC of bile acids, and what are the important factors to consider?
WHAT DOES THIS STUDY ADD TO OUR KNOWLEDGE?
The proposed modeling framework describes the complex relationship among the GE, the gallbladder emptying–refilling patterns, and the EHC of bile acids in response to the intake of test drinks.
HOW MIGHT THIS CHANGE DRUG DISCOVERY, DEVELOPMENT, AND/OR THERAPEUTICS?
This modeling framework could be used during the development of orally administered compounds by linking the absorption variability to postprandial changes in plasma bile acid concentrations. The model predictions may also be used to support research on pathologies affecting the EHC of bile acids.
Bile acids are essential for the absorption of lipophilic molecules through their solubilizing action. They are water soluble, amphipathic molecules formed in the liver as an end product of cholesterol metabolism. The total bile acids’ (TBAs) pool consists of primary and secondary bile acids found as glycine‐conjugated, taurine‐conjugated, and unconjugated forms.1, 2 Bacteria in the terminal part of the small intestine are responsible for the deconjugation of conjugated bile acids and the synthesis of secondary bile acids.2
During the inter‐digestive phase, most bile acids are stored and concentrated in the gallbladder. Approximately 10% of the bile coming from the liver can flow into the duodenum during this period.3 In the postprandial state, the entry of macronutrients (i.e., fats, proteins, and carbohydrates) in the duodenum triggers gallbladder contractions and opening of the Oddi sphincter, resulting in the flow of bile to the duodenum.2, 3, 4 About 30% of the bile acids (mostly unconjugated bile acids) are absorbed in the upper small intestine by passive diffusion.5, 6 Due to ionization, the remaining 70% are unable to cross the cell membranes and are propelled intraluminally down the small intestine. Along the small intestine, the bile acid concentration increases as water is progressively being absorbed. When the intestinal bile acid concentration reaches the critical micellar concentration, micelles start to form and emulsify lipophilic molecules.1, 7 In the terminal ileum, about 95% of bile acids are reabsorbed by active transport and transferred to the liver via the portal vein, the remaining 5% is excreted in the feces.1 In the liver, bile acids are efficiently conjugated and extracted (55–90%). A fraction escapes the hepatic extraction and reaches the systemic circulation: this process constitutes the spillover of bile acids from the portal vein into the systemic circulation.2, 8 The distribution of bile acids to the peripheral tissues is limited due to their high affinity for serum proteins (>42%) and to the efficiency of the hepatic extraction.2, 9 The extracted bile acids are actively secreted into the biliary canaliculus, from which they either flow back to the gallbladder or directly to the small intestine.2, 3 This efficient recycling is known as the enterohepatic circulation (EHC) of bile acids and can occur several times throughout the postprandial period.2
Lipophilic drug compounds suffer from low bioavailability if administered in fasting condition. However, the concomitant administration of food can increase their bioavailability thanks to the solubilizing action of bile acids.10, 11 Given the complexity of the EHC of TBA and the influence of external factors (e.g., meal properties), the time‐course of bile acids’ intestinal concentrations is subject to substantial variability between and within individuals.10, 12, 13 The identification and quantification of factors causing this variability is challenged by the complex and disruptive procedures required to directly measure TBA concentrations in different phases of the EHC.8, 14, 15 Thus, accurate in vivo predictions of the rate and extent of lipophilic compounds’ absorption is complex.13, 16
Nonlinear mixed effect (NLME) models have demonstrated their utility in the development of complex dynamic systems.17, 18 Mechanism‐based NLME models can be used to simultaneously predict the concentration time‐course in multiple compartments while investigating the sources of variability.18 An NLME approach was used to develop a modeling framework predicting the EHC of TBA in response to various caloric intakes. The objectives were set (i) to establish the relationship between postprandial gallbladder emptying and the kinetics of nutrients in the upper small intestine and (ii) to link gallbladder emptying to the spillover of TBA in plasma.
Materials and methods
Study design
Data were obtained from a previously published clinical study in 15 patients with type 2 diabetes (T2D) and 15 healthy control subjects matched based on gender, age, and body mass index.19, 20 Details of the population demographics are provided in Table S1 . The study was approved by the scientific‐ethical committee of the Capital Region of Denmark and conducted according to the principles of the Helsinki Declaration II.
In a crossover design, all subjects were successively administered four test drinks after an overnight (10‐hour) fast. Test drinks consisted of a 75‐g oral glucose tolerance test (OGTT) and three isocaloric, isovolemic solutions with low, medium, and high fat content (Table 1). The plasma concentrations of the 12 most common bile acids (i.e., the glycine‐conjugated, taurine‐conjugated and unconjugated forms of the following bile acids: cholic acid (CA), chenodeoxycholic acid, deoxycholic acid, and ursodeoxycholic acid), were repeatedly measured from 20 minutes prior and up to 240 minutes after test drink administration (Figure 1). TBA concentrations were determined by calculating the molar sum of the 12 measured bile acids. Gallbladder volumes were measured from 10 minutes prior and up to 60 minutes after test drink administration (Figure 1). Gallbladder volumes were determined by ultrasonography, as described elsewhere.20 The detailed composition and conjugation of TBA plasma concentration is provided in Figure 2 for healthy individuals and in Figure S1 for patients with T2D.
Table 1.
Properties of the test drinks
| Test drink | OGTT 75 g | Low fat | Medium fat | High fat |
|---|---|---|---|---|
| Volume (ml) | 300 | 350 | 350 | 350 |
| Carbohydrate (g) | 75 | 107 | 93 | 32 |
| Protein (g) | 0 | 13 | 11 | 3 |
| Fat (g) | 0 | 2.5 | 10 | 40 |
| Energy (kcal)a | 300 | 503 | 506 | 500 |
OGTT, oral glucose tolerance test.
Caloric content calculated using 4 kcal/g for carbohydrates and proteins and 9 kcal/g for fats.41
Figure 1.

Postprandial mean gallbladder volumes (top) and total plasma bile acid concentrations (bottom) in response to the intake (vertical line) of a 75‐g oral glucose tolerance test (OGTT) and three isocaloric (500 kcal), isovolemic (350 ml) test drinks with low (2.5 g fat, 107 g carbohydrate, 13 g protein), medium (10 g fat, 93 g carbohydrate, 11 g protein), and high (40 g fat, 32 g carbohydrate, 3 g protein) fat content (colors) in 15 healthy subjects (left) and 15 patients with type 2 diabetes (right). Error bars represent the standard error of the mean.
Figure 2.

Composition (top) and conjugation (bottom) of the mean plasma concentration of total bile acids vs. time for each of the four test drinks in healthy subjects. The vertical lines represent the time of the test drink intake. CA, cholic acid; CDCA, chenodeoxycholic acid; DCA, deoxycholic acid; OGTT, oral glucose tolerance test; UDCA, ursodeoxycholic acid.
Parameter estimation and model selection
The NLME models were developed using the first‐order conditional parameter estimation method with interaction in NONMEM version 7.3.0 (Icon Development Solutions, Ellicott City, MD) and aided by PsN version 4.7.9 (Department of Pharmaceutical Biosciences, Uppsala University, Uppsala, Sweden).21 Model selection was based on changes in the objective function value using a significance level of P < 0.05, physiological plausibility, parameter uncertainty, and graphical diagnostics. Parameter uncertainty was obtained from the NONMEM sandwich estimator computed following an importance‐sampling step. Visual predictive checks, comparing percentiles of the observations with the confidence intervals (CIs) of the corresponding percentiles from 1,000 simulations, were used for evaluation of the models’ predictive performances.22
Model development
Gastric emptying model integration
A previously published gastric emptying (GE) model was used to predict the kinetics of ingested nutrients in the upper small intestine. The latter was subsequently used to predict gallbladder emptying in response to different test drinks.20, 23 The GE model was developed based on data from the same clinical trial as the present study meaning that individual GE parameter estimates (i.e., empirical Bayes estimates) were available. In this model, the ingested nutrients remain in the stomach until the onset of GE. The GE rate is controlled by a feedback loop of the caloric content in the upper small intestine. The model was implemented via an individual pharmacokinetic parameter with standard errors approach, allowing for proper handling of the uncertainty in the individual GE parameters estimates.24
Total bile acids distribution model
Due to the continuous recirculation of TBA, the determination of their plasma distribution was not possible solely based on the clinical data. Instead, published longitudinal data on radiolabeled total CA administered intravenously were used as surrogate for TBA distribution; the distribution of total CA and TBA were herein assumed to be similar.25 One‐compartment and two‐compartment candidate models were compared. In both cases, the total CA elimination was mediated through a liver compartment for which the volume was calculated using the Small et al.26 equation (fasting hepatic blood flow set to 1.5 l/min).
Enterohepatic circulation modeling framework development
The general structure of the EHC modeling framework of TBA was designed around the key physiological components characterizing the EHC. Gallbladder volume and TBA data were herein modeled simultaneously. Gallbladder emptying was driven by a stimulatory function of the amount of fat equivalents in duodenum (efatduod). Linear and Michaelis‐Menten type functions were investigated. The efatduod was generated by converting the amount of carbohydrates and proteins in duodenum into a fat equivalent by estimating their relative potency (Eq. (1)).
| (1) |
where g carb,duod, g fat,duod, and g prot,duod represent the amount in grams of carbohydrates, fats, and proteins in the duodenum predicted by the GE model. The P carb and P prot represent the relative potency of carbohydrates and proteins in relation to fat (e.g., P carb of 10% would indicate that 10 g of carbohydrates give the same effect on gallbladder as 1 g of fat). Graphical exploration of observed postprandial TBA plasma concentrations revealed the occurrence of two peaks commonly occurring around 30 and 120 minutes (Figure 1, lower panels), which were assumed to be associated with TBA recirculation.8 The assumption of a temporary postprandial gallbladder refilling (GBrefill) period (Eq. (2)) was tested on the rate of gallbladder emptying (R GB,out) in order to predict double peaks despite a sustained emptying signal of efatduod.15
| (2) |
where t represents the time since test drink intake, and Sloperefill the onset and offset steepness of gallbladder refilling. The T refill_onset represents the time to 50% of the maximal gallbladder refilling onset and T refill_duration the duration for which gallbladder refilling was at more than half of its maximal effect. The R GB,out was converted from a volume per unit of time to an amount of TBA entering the upper small intestine compartment per unit of time by assuming a mean TBA concentration of 113 mM in the gallbladder.15 The parameter F AU determined the TBA fraction absorbed in the upper small intestine. Delays throughout the TBA small intestine transit were investigated by successively splitting the upper and lower small intestine into one, two, or three subcompartments. The size of the TBA pool was assumed to be constant (i.e., the model predicted no TBA loss to the colon or de novo TBA production by the liver). This was justified as these two processes would under physiological condition cancel out each other.
The liver compartment was implemented using a well‐stirred type model, for which the volume was calculated using the Small et al. equation.26, 27 The fasting hepatic blood flow was set to 1.5 l/min and increased by 35% upon test drink intake.28 The hepatic extraction (E H) determined the TBA fraction arriving to the liver returned to the gallbladder. Constant and concentration‐dependent Michelis‐Menten E H functions were evaluated. The fraction escaping E H (F H = 1 − E H) was directed to the plasma compartment. The previously described TBA distribution model was integrated into the EHC model framework, without re‐estimating the distribution parameters.
Sensitivity analysis
The sensitivity of the selected model to fixed parameter (i.e., literature) values was evaluated through (i) simulations and (ii) re‐estimation. In step one, alternative versions of the selected model were created by modulating the value of each fixed parameter by ±25%. For each model, 1,000 simulated datasets were created and summarized into the 95% CI around the population median for the simulated gallbladder volume and TBA plasma concentrations. Simulations from the alternative models were then graphically compared to simulations from the reference model. In step two, the alternative models for which meaningful differences could be observed in step one were re‐estimated. The predictions of each re‐estimated model were again compared to the reference model (see step one) in order to ensure for the unidentifiability of the fixed parameters.
Covariate analysis
Weight‐based allometric scaling was applied to volumes and clearance parameters using exponents of 1 and 3/4, respectively, and a reference body weight of 70 kg.29 Effects of age, gender, T2D, test drink fat, and carbohydrate contents were investigated on key EHC model parameters. Covariate selection was performed through a stepwise covariate modeling approach with forward inclusion (P < 0.05) and backward deletion (P ≥ 0.01) steps. Continuous covariates were implemented linearly as fractional change in the typical parameter value for each unit change in the covariate to its median value. Categorical covariates were implemented as fractional change in the typical parameter value in relation to the most common category.
Stochastic models
Due to long runtimes, a single variability term accounting for both between‐subject variability (BSV) and between‐occasion variability (BOV) was estimated for each parameter. The relative contribution of BSV and BOV were computed from the empirical Bayes estimates of the total variability. For parameters bound between 0 and 1, a logit transformation was applied prior to the variability implementation.30 Log‐normal distributions were used for parameters in the normal domain and normal distributions for parameters in the logit domain. Correlations between parameters at the individual level were evaluated. Occasions were defined by the intake of one of the four test drinks. Proportional, additive, and combined models were tested for the residual unexplained variability.
Results
A schematic representation of the TBA EHC modeling framework is provided in Figure 3. Parameter estimates are reported in Table 2 and the model code in Figure S2 . Contributions of BSV and BOV to the estimated total variability in each parameter are provided for reference in Table S2 .
Figure 3.

Schematic representation of the developed model. Test drinks were administered into the stomach. The gastric emptying rate constant (K G) was inhibited by calories in the upper small intestine. K UL was the rate constant of calories disappearance from the upper small intestine (SI), and K DJ from the duodenum. Nutrients (i.e., fats, proteins, and carbohydrates) and calories were also nonlinearly absorbed, RA MAX describing the maximal rate and K M the potency of their absorption. The gallbladder release rate constant (K RB) was stimulated by a signal of the fat equivalent amount in the duodenum (efatduod). The gallbladder had refilling periods starting at the onset (T refill_onset) and for a duration determined by T refill_duration. The steepness of the onset and offset were determined by the refilling slope (Sloperefill). Once released from the gallbladder, total bile acids (TBAs) were either absorbed in the upper small intestine at the rate K A,U or transited toward the lower small intestine at the rate K TUL. K A,L mediated the lower small intestine transit and the absorption rate constant of bile acids. Upon arrival to the liver, the TBAs were extracted back to the gallbladder against the concentration gradient (C H/C GB). The fraction escaping the hepatic extraction (F H) spilled to the plasmatic and peripheral compartments. The Q H and Q D, respectively, represented the hepatic blood flow and the distribution clearance. The rate constant of transit from the lower small intestine to the colon (K TLC) and the liver TBA production rate (R TBA) were assumed to compensate each other in the model and were herein represented for illustration purpose only. Magnifying glasses indicate variables that were simultaneously modeled: gallbladder volume and TBA plasma concentrations.
Table 2.
Parameter estimates and uncertainty for the selected models
| Gallbladder emptying model | Enterohepatic circulation model | ||||
|---|---|---|---|---|---|
| Parameters (unit) | Estimates (CI95) | BSVa CV% (CI95) | Parameters (unit) | Estimates (CI95) | BSVa CV% (CI95) |
| Base GB (ml)b | 29.4 (25.3 to 33.4) | 27 (22 to 31) | HLTUL (minutes) | 59.7 (42 to 77.3) | |
| HLRB (minutes) | 1,250 (897 to 1,610) | 95 (78 to 110) | F AU (%) | 21.6 (15.8 to 27.3) | 0.62 (0.43 to 0.77)c |
| T2D–HLRB (%) | −48.1 (−69.1 to −27.2) | OGTT–F AU (%) | +125 (93.8 to 157) | ||
| Slopeefat | 101 (69.6 to 133) | 100 (76 to 120) | MTTA,L (minutes) | 109 (85.5 to 133) | 47 (27 to 61) |
| Age–Slopeefat (%/year) | −2.50 (−4.00 to −1.00) | Carbs–MTTA,L (%/g) | +0.614 (0.305 to 0.924) | ||
| T2D–Slopeefat (%) | −32.9 (−55.7 to −10.1) | Female–MTTA,L (%) | −27.9 (−62.6 to +6.87) | ||
| RAMAX (kcal/minutes) | 2.29 fixed | E H (%) | 63.8 (54.1 to 73.6) | 0.59 (0.3 to 0.78) c | |
| K M (kcal) | 25.1 fixed | High fat–E H (%) | −29.4 (−109 to +50.1) | ||
| HLDJ (minutes) | 2.52 (1.78 to 3.27) | Q H (l/minutes) b |
1.5 fixed (fasting) 2.0 fixed (fed) |
||
| P fat (%) | 100 fixed | V C (l) b | 2.84 fixed | ||
| P carb (%) | 5.74 (3.99 to 7.48) | V P (l) b | 4.07 fixed | ||
| P prot (%) | 82.3 (32.7 to 132) | Q D (l/minutes) b | 0.173 fixed | ||
| Sloperefill | 0.155 (0.055 to 0.255) | TBA conc. GB (mM) | 113 fixed | ||
| T refill_onset (minutes) | 25.6 (20.3 to 30.9) | 70 (28 to 95) | |||
| T refill_duration (minutes) | 156 (130 to 182) | 35 (15 to 47) | |||
| Add. err. (ml) | 4.27 (1.85 to 6.7) | Prop. err. (%) | 31.8 (25.9 to 36.8) | ||
| Prop. err. (%) | 10.2 (7.54 to 12.3) | ||||
Add. Err., additive part of the residual unexplained variability; AGE‐slopeefat, effect of age on slopeefat; Base GB, baseline gallbladder volume; BSV, between‐subject variability; Carbs‐MTTA,L, effect of the amount of ingested carbohydrates on MTTA,L; CI95, 95% confidence interval; CV, coefficient of variation; E H, hepatic extraction; F AU, fraction of total bile acids absorbed in the upper small intestine; Female‐MTTA,L, relative difference in MTTA,L with female subjects in comparison to males; High fat‐E H, relative difference in E H with the high‐fat test drink in comparison to the other test drinks; HLDJ, half‐life of the nutrient transfer rate between duodenum and jejunum; HLRB, half‐life of the basal (i.e., fasting) gallbladder emptying rate; HLTUL, half‐life of total bile acids transfers from upper to lower small intestine; K M, potency of the caloric absorption; MTTA,L, mean transit time of total bile acids throughout the lower small intestine; OGTT‐F AU, relative change in F AU with the oral glucose tolerance test 75 g test drink; P carb, P fat, P prot, potency on gallbladder emptying per gram of carbohydrates, fats, and proteins in relation to 1 g of fat; Prop. err., proportional part of the residual unexplained variability; Q D, total bile acids intercompartmental clearance; Q H, hepatic blood flow; RAMAX, maximal nutrients absorption rate; Slopeefat, slope of the effect of the amount of fat equivalent on gallbladder emptying; Sloperefill, steepness of the onset and offset of gallbladder refilling; T2D–HLRB, effect of type 2 diabetes on HLRB; T2D–Slopeefat, effect of type 2 diabetes on Slopeefat; TBA conc. GB, fasting total bile acid concentration in the gallbladder; T refill_duration, duration for which the gallbladder refilling is at more than half of its maximal effect; T refill_onset, time to 50% of maximal gallbladder refilling onset; V C, V P, total bile acids central and peripheral volumes of distribution.
In the present case BSV represents the sum of the between‐subject variability and between‐occasion variability. The contribution of each of these two components is provided in Table S2 . The off‐diagonal elements are reported in Table S3 .
Parameter allometrically scaled in reference to a 70‐kg individual and using an allometric exponent of 1 for volumes and 3/4 for clearances.
Standard deviation for additive variability on the logit scale.
Total bile acids distribution model
The two‐compartment distribution model was retained (P < 0.001) and appropriately described the data (Figure S3 ). The estimated typical volume of central (V C = 2.84 l) and peripheral (V P = 4.07 l) compartments, and the intercompartmental clearance (Q D = 0.173 l/min) for a 70‐kg individual indicated a rapid and contained distribution.
Enterohepatic circulation modeling framework development
A total of 920 gallbladder measurements and 1,236 TBA plasma concentration samples were gathered from 30 subjects. One patient exhibited unphysiological TBA concentrations at 15 minutes (~27 times higher than baseline), thus, this sample was excluded from the analysis.
The rate of gallbladder emptying, R GB,out, was best described by a linear function of efatduod on the basal (i.e., fasting) gallbladder emptying rate constant (K RB; Eq. (3)).
| (3) |
where GBvol is the gallbladder volume at a given time, and Slopeefat is the slope of the effect of efatduod on K RB. The total variability linked to gallbladder emptying parameters was substantial, with a 95% coefficient of variation (CV) for the half‐life of gallbladder emptying (HLRB = 0.693/KRB) and 100% CV for Slopeefat. Throughout the covariate search, HLRB was found to be decreased in subjects with T2D (P < 0.001; Eq. (4)).
| (4) |
where TVHLRB is the typical value of HLRB, T2D is a variable set to 0 for healthy volunteers, and 1 for subjects with T2D and ηi1 the total variability on HLRB. The parameter Slopeefat was found to be negatively correlated with individual's age (AGE, P < 0.001) and T2D status (P = 0.104; Eq. (5)).
| (5) |
where TVSlopeefat is the typical value of Slopeefat, and ηi1 the total variability on Slopeefat. Implementation of the gallbladder refilling function (Eq. (2)) significantly improved the prediction of the double peaks observed in the TBA plasma concentration data (Figure 1, lower panels). The T refill_onset and T refill_duration parameters were estimated to 25.6 minutes (70% CV) postdose and 156 minutes (35% CV), respectively, indicating an early and prolonged effect throughout the postprandial state. The typical value of Sloperefill was small (0.155), indicating a progressive transition throughout the onset and offset of refilling.
The F AU was found to increase from 21.6% for fat‐containing drinks to 48.6% for OGTT 75 g. Splitting the upper small intestine into subcompartments did not improve model predictions. However, significant improvements were seen when the lower small intestine was split into three subcompartments and absorption restricted to the terminal part. The mean TBA transit time throughout the lower small intestine (MTTA,L) was estimated to 109 minutes (47% CV). The MTTA,L was shorter in female subjects (−27.9%; P < 0.001) and positively correlated with the amount of ingested carbohydrates (+0.614%/g; P < 0.001) as illustrated in Eq. (6).
| (6) |
where TVMTTA,L is the typical value of MTTA,L, FEM a variable set to 1 for female subjects and 0 for male subjects, g carb the total amount of carbohydrates ingested, and ηi3 the unexplained variability on MTTA,L. An E H of 63.8%, constant over time, best fitted the TBA plasma concentration data. The high fat test drink was, however, associated with a lower E H, estimated to 45.0%.
Estimating the covariance between individual model parameters (gallbladder baseline volume, HLRB, Slopeefat, T refill_onset, T refill_duration, F AU, MTTA,L, and E H) greatly improved the fit of the model. The full variance‐covariance matrix (i.e., NONMEM $OMEGA BLOCK) is reported in Table S3 . The residual unexplained variability was best described by a combined model for gallbladder volume and a proportional model for TBA plasma concentrations. Overall, the selected models displayed good predictive performances across the range of test drinks (Figure 4). Simulation‐based model predictions of gallbladder volume and TBA plasma concentrations are illustrated in Figure 5.
Figure 4.

Visual predictive checks of the gallbladder volume (top) and total bile acids plasma concentration (bottom) time‐courses for each of the four test drinks. The vertical lines represent the time of the test drink intake. OGTT, oral glucose tolerance test. Shaded areas represent the 95% confidence interval around the specified percentiles, based on 1,000 simulations.
Figure 5.
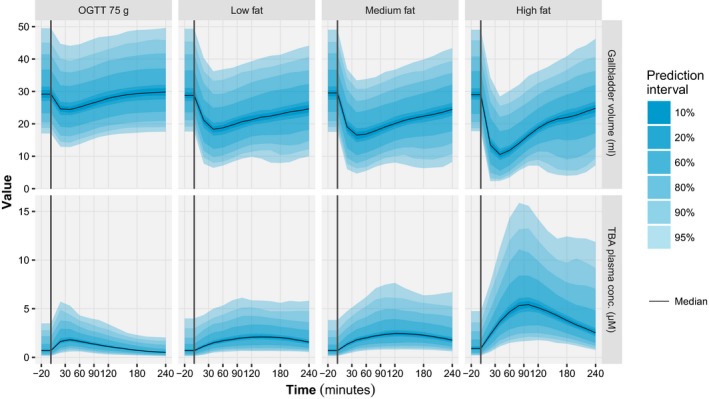
Model‐based simulations of gallbladder volume (top) and total bile acids plasma concentration (bottom) time‐course for each of the four test drinks. For each panel, different prediction intervals (shaded areas) and the median (solid lines) were calculated based on 1,000 model simulations for a typical individual (i.e., non‐diabetic, sex: male, weight: 70 kg, height; 1.7 m, and age: 64 years old). The vertical lines represent the time of the test drink intake. OGTT, oral glucose tolerance test.
Sensitivity analysis
A local sensitivity analysis was carried out on all fixed parameters, namely: TBA concentration in the gallbladder, Q H, Q D, V C, and V P parameters. The model simulations revealed that a change in Q D, V C, or V P only had minor effect on gallbladder volume and TBA plasma concentration predictions. However, ±25% change in TBA concentration in the gallbladder or Q H resulted in meaningful differences in the simulated medians in comparison to the reference model. After a re‐estimation step, the model predictions medians were, however, similar to the reference model.
Discussion
The proposed EHC modeling framework was predictive of the central trend and the variability in gallbladder emptying and TBA plasma concentration longitudinal data in response to test drink intakes. The use of an NLME approach allowed the simultaneous integration of clinical data, a previously developed GE model,23 published radiolabeled bile acids data25, and of published physiological parameter values.15, 26, 28 Our main findings suggest that the multiple peaks observed in the TBA plasma concentration data can be explained by postprandial gallbladder refilling periods and the presence of a high fat effect due to reduced hepatic extraction.
The postprandial emptying of the gallbladder is primarily attributed to the increase in plasma cholecystokinin concentrations, a gut hormone released when food comes in contact with cells of the upper small intestine.4, 31 Our previous work has, however, shown that postprandial plasma cholecystokinin concentrations were not a good predictor of gallbladder emptying. Instead, using efatduod, the amount of fat equivalent in the duodenum to stimulate gallbladder emptying offered better predictive performances.23 Thus, a GE model was integrated to predict efatduod kinetics for the different test drinks. Our results are in line with previous findings, carbohydrates had a relatively low potency (P carb = 5.7%) to trigger gallbladder emptying as compared to fats (P fat = 100%), unlike proteins (P prot = 82%).4, 31
The T2D status was associated with a shortened HLRB and a decreased R GB,out resulting in higher fasting (baseline) and postprandial (peak) TBA plasma concentrations in comparison to healthy volunteers. Consistent with our findings, alterations of the bile acid homeostasis (e.g., elevated plasma concentrations) have previously been described in subjects with T2D, and are likely due to their close relationship with the glucose and energy metabolism.19, 32 The R GB,out was also found to be inversely correlated with age, and is likely the result of a decreased gallbladder responsiveness with age.33 However, unlike our previous findings, a linear relationship between efatduod and R GB,out was selected over a Michaelis‐Menten, our previous gallbladder emptying model did not, however, account for the EHC of bile acids.23
Angelin et al.8 suggested that the multiple postprandial peaks in TBA plasma concentrations are likely result of the recirculation of reabsorbed bile acids. Nevertheless, only assuming a constant gallbladder emptying did not allow the model to predict the secondary peaks and, thus, the hypothesis of postprandial gallbladder refilling periods was made. Despite the absence of gallbladder volume data beyond 60 minutes, signs of postprandial refilling could be seen in the data for all test drinks (Figure 1, top panels). This theory is also supported by the work from Howard et al.34 and Jazrawi et al.35 who showed that postprandial gallbladder motility is characterized by sequences of emptying and refilling phases of different intensities.
Throughout model development, the use of the TBA data was preferred over the use of the individual bile acids data for being relatively constant (Figure 2). Indeed, focusing the modeling on TBA circumvented the need for implementation of conjugation and deconjugation processes into the model.1, 2 The proposed model is thought to be adaptable to the prediction of specific bile acids’ kinetics.
The determination of the structure and parameters of TBA distribution was not possible solely based on their endogenous plasma concentrations. A two‐compartment model linked to a liver compartment (clearance site) was developed based on radiolabeled total CA data.25 The estimated volume and clearance values were in line with the reported rapid and contained distribution of TBA.2, 9 The total CA serum concentrations were used as surrogate of TBA distribution. This assumption is supported by results from Cowen et al.9 showing that principal bile acids had similar protein binding and disappearance rates. Additionally, the sensitivity analysis revealed the model was not sensitive to the TBA distribution parameters.
The general structure of the EHC TBA model was based on the different anatomical sections of the EHC, an approach comparable to the model developed by Hofmann et al.36 (Figure 3). However, unlike the bottom‐up approach used by Hofmann et al.36, our model development was mostly data driven (top‐down approach) leading to a few noticeable differences. Transit compartments were used to account for the delay of bile acids transiting through the small intestine. The MTTA,L, the mean transit time of bile acids to the lower small intestine, was found to be influenced by gender and the amount of ingested carbohydrates. An effect of gender on the response of bile acids to nutritional intake was also reported by Fiamoncini et al.37 The effect of carbohydrates has, to our knowledge, not been reported, but might be linked to an effect of gut hormones, such as the glucagon‐like peptides.38 Meal‐specific effects could also be seen with the OGTT 75 g for which F AU, the fraction of TBA absorbed in the upper small intestine, was increased from 21.6% to 48.6%. Although the reason behind this effect remains unclear it could be linked to the properties of the test drink, such as pH acting on the ionization of the bile acids in the small intestine.1, 2 The decreased hepatic extraction with the high‐fat test drink was unexpected and differs from finding by Angelin et al.8, who reported constant hepatic extraction before and after meal intake in cholecystectomized patients. A possible explanation for this effect may lay in the interaction of bile acids with the lipoproteins, which are absorbed via the lymphatic system, thus, possibly allowing them to evade the first‐pass metabolism.12, 39
The total parameter variability (BSV and BOV) was dominated by BOV for all parameters except E H and the baseline gallbladder volume (Table S2 ). The large BOV indicates that variability is not primarily explained by genetic factors, as described by Fiamoncini et al.37 Nonetheless, restricting the parameter space by accounting for individual parameter correlations (Table S3 ) significantly improved the predictive performance of the model (Figure 4).
This study presents several limitations. First, the predictions of the kinetics of TBA in the lower small intestine, upper small intestine, and liver compartments remain to be evaluated based on appropriate data. Second, the gallbladder data were evaluated by ultrasonography only and no later than 60 minutes following the intake of test drinks. Measurements beyond 60 minutes would have helped to confirm our hypothesis regarding gallbladder refilling. Furthermore, as described by Jazrawi et al., 35 the combined use of scintigraphy and ultrasonography measurements would have provided more information on the emptying and refilling patterns of the gallbladder. Third, in vivo the hepatic clearance Q H is varying continuously between fasting and postprandial states.40 However, such dynamic changes could not be identified solely based on the current data and Q H was, hence, fixed to literature values.28 Fourth, TBA distribution parameters were obtained using data from radiolabeled total CA, and fifth the TBA pool was assumed to be constant throughout time. Finally, the models were developed based on test drinks (i.e., liquid meals), data and extrapolation to solid meals has yet to be tested as it could influence GE rate and the EHC of bile acids. Despite these limitations we consider the established model an important step toward better predictions of functional bile concentrations in response to caloric intake.
In conclusion, an NLME approach was used to develop an EHC modeling framework describing the postprandial relationship among the GE, the gallbladder emptying–refilling patterns, and the spillover of TBA in plasma. The presented modeling framework could support drug development by improving the prediction food effect on rate and extent of drug absorption or drug‐drug interactions related to the EHC of bile acids. These applications could be facilitated by the integration of this model into larger systems pharmacology models. Finally, the model could aid in the research on the onset and evolution of bile acid‐related pathologies.
Funding
This work has received support from the Innovative Medicines Initiative Joint Undertaking (http://www.imi.europa.eu) under grant agreement number 115369, resources of which are composed of financial contribution from the European Union's Seventh Framework Programme (FP7/2007‐2013) and EFPIA companies in kind contribution.
Conflict of Interest
The authors declared no competing interests for this work.
Author Contributions
B.G., D.P.S., M.B., T.V., F.K.K., and M.O.K. wrote the manuscript. B.G., D.P.S., M.B., T.V., F.K.K., and M.O.K. designed the research. B.G., D.P.S., M.B., and M.O.K. performed the research. B.G. analyzed the data. F.K.K. and M.O.K. contributed to new reagents/analytical tools.
Supporting information
Supporting Information Supplementary information accompanies this paper on the CPT: Pharmacometrics & Systems Pharmacology website.(www.psp‐journal.com)
Figure S1. Plasma bile composition and conjugation in subjects with type 2 diabetes.
Figure S2. NONMEM code for the modeling framework of gastric emptying and the enterohepatic circulation of total bile acids.
Figure S3. Fit of the intravenous radiolabeled total cholic acid data.
Table S1. Population demographics.
Table S2. Contributions of the between subject and the between occasion variability to the total variance.
Table S3. The variance–covariance of the eta variables estimated from the selected model.
Acknowledgments
The authors thank Professor Alan Hofmann and Doctor Emilie Schindler for their valuable input.
References
- 1. Stamp, D. & Jenkins, G. . An overview of bile‐acid synthesis, chemistry and function In Bile Acids: Toxicology and Bioactivity (eds. Jenkins G. & Hardie L.J.) 1–13 (Royal Society of Chemistry, United Kingdom, 2008). 10.1039/9781847558336-00001 [DOI] [Google Scholar]
- 2. Hofmann, A.F. Enterohepatic circulation of bile acids. Compr. Physiol. 19, 567–596 (2011). [Google Scholar]
- 3. Behar, J. Physiology and pathophysiology of the biliary tract: the gallbladder and sphincter of Oddi—a review. ISRN Physiol. 2013, 1–15 (2013). [Google Scholar]
- 4. Froehlich, F. , Gonvers, J.J. & Fried, M. Role of nutrient fat and cholecystokinin in regulation of gallbladder emptying in man. Dig. Dis. Sci. 40, 529–533 (1995). [DOI] [PubMed] [Google Scholar]
- 5. Angelin, B. , Einarsson, K. & Hellström, K. Evidence for the absorption of bile acids in the proximal small intestine of normo‐ and hyperlipidaemic subjects. Gut 17, 420–425 (1976). [DOI] [PMC free article] [PubMed] [Google Scholar]
- 6. Angelin, B. & Björkhem, I. Postprandial serum bile acids in healthy man. Evidence for differences in absorptive pattern between individual bile acids. Gut 18, 606 (1977). [DOI] [PMC free article] [PubMed] [Google Scholar]
- 7. Roberts, M.S. , Magnusson, B.M. , Burczynski, F.J. & Weiss, M. Enterohepatic circulation: physiological, pharmacokinetic and clinical implications. Clin. Pharmacokinet. 41, 751–790 (2002). [DOI] [PubMed] [Google Scholar]
- 8. Angelin, B. , Björkhem, I. , Einarsson, K. & Ewerth, S. Hepatic uptake of bile acids in man. J. Clin. Invest. 70, 724–731 (1982). [DOI] [PMC free article] [PubMed] [Google Scholar]
- 9. Cowen, A.E. , Korman, M.G. , Hofmann, A.F. & Thomas, P.J. Plasma disappearance of radioactivity after intravenous injection of labeled bile acids in man. Gastroenterology 68, 1567–1573 (1975). [PubMed] [Google Scholar]
- 10. Fleisher, D. , Li, C. , Zhou, Y. , Pao, L.H. & Karim, A. Drug, meal and formulation interactions influencing drug absorption after oral administration. Clinical implications. Clin. Pharmacokinet. 36, 233–254 (1999). [DOI] [PubMed] [Google Scholar]
- 11. Wiedmann, T.S. & Kamel, L. Examination of the solubilization of drugs by bile salt micelles. J. Pharm. Sci. 91, 1743–1764 (2002). [DOI] [PubMed] [Google Scholar]
- 12. Charman, W.N. , Porter, C.J. , Mithani, S. & Dressman, J.B. Physicochemical and physiological mechanisms for the effects of food on drug absorption: the role of lipids and pH. J. Pharm. Sci. 86, 269–282 (1997). [DOI] [PubMed] [Google Scholar]
- 13. Kostewicz, E.S. et al PBPK models for the prediction of in vivo performance of oral dosage forms. Eur. J. Pharm. Sci. 57, 300–321 (2014). [DOI] [PubMed] [Google Scholar]
- 14. Lennernäs, H. et al Regional jejunal perfusion, a new in vivo approach to study oral drug absorption in man. Pharm. Res. 9, 1243–1251 (1992). [DOI] [PubMed] [Google Scholar]
- 15. Matyja, A. et al Telocytes: new insight into the pathogenesis of gallstone disease. J. Cell. Mol. Med. 17, 734–742 (2013). [DOI] [PMC free article] [PubMed] [Google Scholar]
- 16. Brouwers, J. & Augustijns, P. Resolving intraluminal drug and formulation behavior: gastrointestinal concentration profiling in humans. Eur. J. Pharm. Sci. 61, 2–10 (2014). [DOI] [PubMed] [Google Scholar]
- 17. Jamei, M. et al Population‐based mechanistic prediction of oral drug absorption. AAPS J. 11, 225–237 (2009). [DOI] [PMC free article] [PubMed] [Google Scholar]
- 18. Mould, D.R. & Upton, R.N. Basic concepts in population modeling, simulation, and model‐based drug development. CPT Pharmacometrics Syst. Pharmacol. 1, e6 (2012). [DOI] [PMC free article] [PubMed] [Google Scholar]
- 19. Sonne, D.P. et al Postprandial plasma concentrations of individual bile acids and FGF‐19 in patients with type 2 diabetes. J. Clin. Endocrinol. Metab. 101, 3002–3009 (2016). [DOI] [PubMed] [Google Scholar]
- 20. Sonne, D.P. , Rehfeld, J.F. , Holst, J.J. , Vilsboll, T. & Knop, F.K. Postprandial gallbladder emptying in patients with type 2 diabetes: potential implications for bile‐induced secretion of glucagon‐like peptide 1. Eur. J. Endocrinol. 171, 407–419 (2014). [DOI] [PubMed] [Google Scholar]
- 21. Keizer, R.J. , Karlsson, M.O. & Hooker, A. Modeling and simulation workbench for NONMEM: tutorial on Pirana, PsN, and Xpose. CPT Pharmacometrics Syst. Pharmacol. 2, e50 (2013). [DOI] [PMC free article] [PubMed] [Google Scholar]
- 22. Keizer, R. vpc: Create Visual Predictive Checks. <https://cran.r-project.org/package=vpc> (2017).
- 23. Guiastrennec, B. et al Mechanism‐based modeling of gastric emptying rate and gallbladder emptying in response to caloric intake. CPT Pharmacometrics Syst. Pharmacol. 5, 692–700 (2016). [DOI] [PMC free article] [PubMed] [Google Scholar]
- 24. Lacroix, B.D. , Friberg, L.E. & Karlsson, M.O. Evaluation of IPPSE, an alternative method for sequential population PKPD analysis. J. Pharmacokinet. Pharmacodyn. 39, 177–193 (2012). [DOI] [PubMed] [Google Scholar]
- 25. Engelking, L.R. , Barnes, S. & Dasher, C.A. Radiolabeled bile acid clearance in control subjects and patients with liver disease. Clin. Sci. 57, 499–508 (1979). [DOI] [PubMed] [Google Scholar]
- 26. Small, B.G. , Wendt, B. , Jamei, M. & Johnson, T.N. Prediction of liver volume – a population‐based approach to meta‐analysis of paediatric, adult and geriatric populations – an update. Biopharm. Drug Dispos. 38, 290–300 (2017). [DOI] [PubMed] [Google Scholar]
- 27. Yang, J. , Jamei, M. , Yeo, K.R. , Rostami‐Hodjegan, A. & Tucker, G.T. Misuse of the well‐stirred model of hepatic drug clearance. Drug Metab. Dispos. 35, 501–502 (2007). [DOI] [PubMed] [Google Scholar]
- 28. Svensson, C.K. , Mauriello, P.M. , Barde, S.H. , Middleton, E. Jr & Lalka, D. Effect of carbohydrates on estimated hepatic blood flow. Clin. Pharmacol. Ther. 35, 660–665 (1984). [DOI] [PubMed] [Google Scholar]
- 29. Anderson, B.J. & Holford, N.H.G. Mechanistic basis of using body size and maturation to predict clearance in humans. Drug Metab. Pharmacokinet. 24, 25–36 (2009). [DOI] [PubMed] [Google Scholar]
- 30. Petersson, K.J.F. , Hanze, E. , Savic, R.M. & Karlsson, M.O. Semiparametric distributions with estimated shape parameters. Pharm. Res. 26, 2174–2185 (2009). [DOI] [PubMed] [Google Scholar]
- 31. Liddle, R.A. Cholecystokinin cells. Annu. Rev. Physiol. 59, 221–242 (1997). [DOI] [PubMed] [Google Scholar]
- 32. Prawitt, J. , Caron, S. & Staels, B. Bile acid metabolism and the pathogenesis of type 2 diabetes. Curr. Diab. Rep. 11(3), 160–166 (2011). 10.1007/s11892-011-0187-x. [DOI] [PMC free article] [PubMed] [Google Scholar]
- 33. Khalil, T. et al Effect of aging on gallbladder contraction and release of cholecystokinin‐33 in humans. Surgery 98, 423–429 (1985). [PubMed] [Google Scholar]
- 34. Howard, P.J. , Murphy, G.M. & Dowling, R.H. Gall bladder emptying patterns in response to a normal meal in healthy subjects and patients with gall stones: ultrasound study. Gut 32, 1406–1411 (1991). [DOI] [PMC free article] [PubMed] [Google Scholar]
- 35. Jazrawi, R.P. et al Postprandial gallbladder motor function: refilling and turnover of bile in health and in cholelithiasis. Gastroenterology 109, 582–591 (1995). [DOI] [PubMed] [Google Scholar]
- 36. Hofmann, A.F. , Molino, G. , Milanese, M. & Belforte, G. Description and simulation of a physiological pharmacokinetic model for the metabolism and enterohepatic circulation of bile acids in man. Cholic acid in healthy man. J. Clin. Invest. 71, 1003–1022 (1983). [DOI] [PMC free article] [PubMed] [Google Scholar]
- 37. Fiamoncini, J. et al Determinants of postprandial plasma bile acid kinetics in human volunteers. Am. J. Physiol. ‐ Gastrointest. Liver Physiol. 313, G3000–G312 (2017). [DOI] [PubMed] [Google Scholar]
- 38. Marathe, C.S. , Rayner, C.K. , Jones, K.L. & Horowitz, M. Glucagon‐like peptides 1 and 2 in health and disease: a review. Peptides 44, 75–86 (2013). [DOI] [PubMed] [Google Scholar]
- 39. Salvioli, G. , Lugli, R. , Pradelli, J.M. & Gigliotti, G. Bile acid binding in plasma: the importance of lipoproteins. FEBS Lett. 187, 272–276 (1985). [DOI] [PubMed] [Google Scholar]
- 40. Rose, R.H. , Turner, D.B. , Neuhoff, S. & Jamei, M. Incorporation of the time‐varying postprandial increase in splanchnic blood flow into a PBPK model to predict the effect of food on the pharmacokinetics of orally administered high‐extraction drugs. AAPS J. 19, 1205–1217 (2017). [DOI] [PubMed] [Google Scholar]
- 41. Merrill, A.L. , & Watt, B.K. Energy values of food: basis and derivation. Agric. Handboook 74, 1–105 (1973). [Google Scholar]
Associated Data
This section collects any data citations, data availability statements, or supplementary materials included in this article.
Supplementary Materials
Supporting Information Supplementary information accompanies this paper on the CPT: Pharmacometrics & Systems Pharmacology website.(www.psp‐journal.com)
Figure S1. Plasma bile composition and conjugation in subjects with type 2 diabetes.
Figure S2. NONMEM code for the modeling framework of gastric emptying and the enterohepatic circulation of total bile acids.
Figure S3. Fit of the intravenous radiolabeled total cholic acid data.
Table S1. Population demographics.
Table S2. Contributions of the between subject and the between occasion variability to the total variance.
Table S3. The variance–covariance of the eta variables estimated from the selected model.