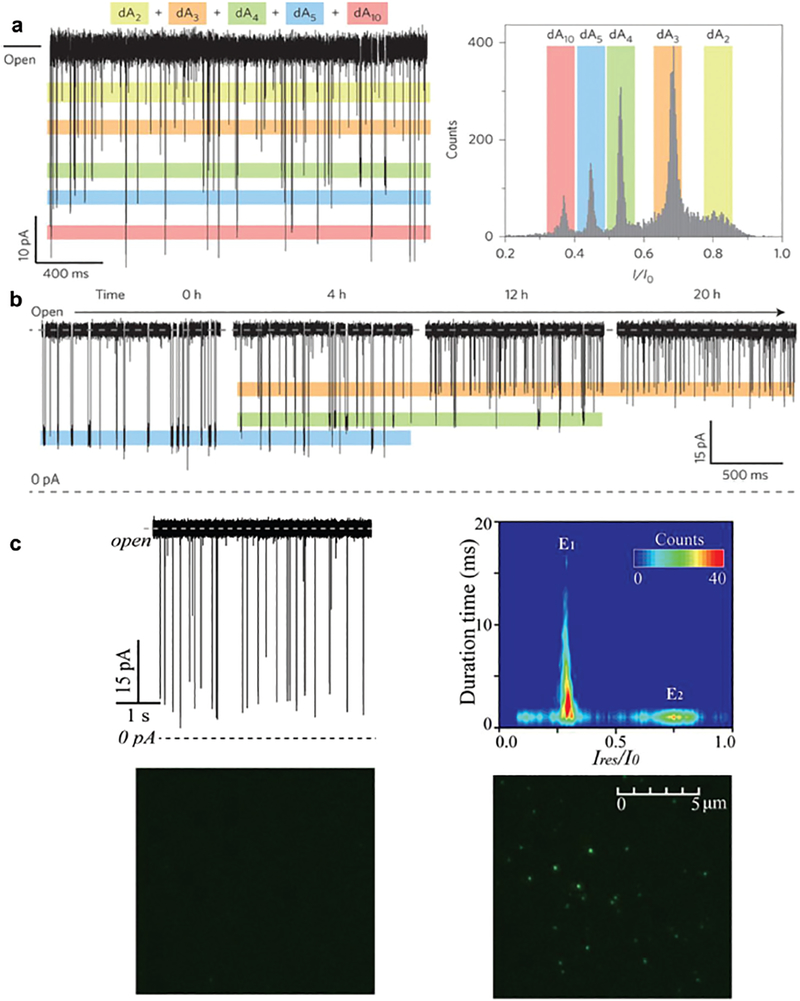
Fig. 2.
(a) A continuous trace showing the distinctive current levels for dAn (left) and their histograms in a mixture of dAn (n = 2, 3, 4, 5 and 10). (b) In the presence of 1.0 μM dA5 and 2000 U ExoI, demonstrating the cleavage process of dA5into short fragments at 0, 4, 12 and 20 h. Reprinted with permission from DOI: 10.1038/NNAN0.2016.66, Nat. Nano., 2016. (c) Raw current traces produced by DNA 5’-ACTG-3’ (with a 5’-hexachloro-fluorescein tag) and its contour plots produced by DNA (upper panel). The TIRF images of solution collected from the trans side of aerolysin in the absence (left) and presence of DNA (right) after continuous single-channel recording for 6 h (bottom panel). Reprinted with permission from DOI: 10.1021/acs.analchem.6b01514, Anal. Chem., 2016.

