

Abstract
Nanoparticle therapeutic delivery is influenced by many factors including physical, chemical, and biophysical properties along with local vascular conditions. In recent years, nanoparticles of various shapes have been fabricated and have shown significant impact on transport efficiency. Identification of which nanoparticle shape helps to improve the therapeutic delivery process allows for enhanced therapeutic effects, yet is hard to be quantified in vivo due to the complex nature of the in vivo environment. In this work, we turn to biological models as a guide for informing improved nanoparticle therapeutic delivery, and quantify the contribution of various factors on delivery efficiency. Here we show that with a mimetic blood vessel, improved therapeutic delivery is achieved using long filamentous rod nanoparticles under low pressure conditions. When considering medium pressure conditions, a combination of nanoparticle shapes presents improved therapeutic delivery over the treatment time-course starting with long filamentous rod nanoparticles, followed by short rod nanoparticles. Conditions of high pressure required a combination of short rod nanoparticles, followed by spherical nanoparticles to achieve enhanced therapeutic delivery. Overall, improvement of therapeutic delivery via nanoparticle carriers is likely to require a combination of nanoparticle shapes administered at different times over the treatment time-course, given patient specific conditions.
Microfluidic platform analysis of therapeutic carrier delivery to cancerous sites for optimization of drug delivery efficiency over time-course treatment plans.
Introduction
Within biological models, the transportation and delivery of cellular building blocks, waste, and other materials is required in order to sustain life which in turn requires energy.1–5 Biological models such as vesicles, virions, and DNA transport/translocation have adapted various techniques to accomplish transport tasks while expending as little energy as possible.6–8 This invaluable evolutionary fine-tuning was turned toward attempting to maximize the transport and delivery of therapeutics stored within nanoparticle carriers based on their shape. In order to compare various nanoparticle designs, a suitable biological model must be chosen which replicates many of the factors encountered within the system. A model mimicking microvasculature must be used which contains many characteristics of the biological model while not becoming overly complicated and difficult to sustain. Previous attempts in the literature to mimic vasculature for the sake of nanoparticle analysis have been oversimplified with subpar results.9–13
Current techniques for investigating nanoparticle transport utilize living in vivo models which show targeting efficiency around or below 10% based on the amount of nanoparticles introduced into the system.14–16 Such low efficiency of delivery to targeted sites is often due to particle shapes which are not suitable for delivering maximized drug loads while enhancing characteristics required for migration across biological barriers. Despite the poor efficiencies achieved in the past using synthetic designs, we turn to nature in order to overcome the challenge of nanoparticle transport across biological barriers. Specifically, vesicle and viral transport have adopted rod and filament-like carrier shapes in order to maximize the amount or volume of material being passed across a membrane while limiting the energy required to do so.17–20 Additionally, previously reported characteristics such as longer circulation times in vivo and lower rates of accumulation for larger sized filamentous particles in organs such as the liver, lungs and spleen are beneficial when delivering therapeutic loads.17,21–23 As such, the application of long filamentous nanoparticle carriers towards the goal of therapeutic delivery is of interest. Previous attempts in literature to design filamentous nanoparticles have occurred, however there has not yet been any systematic study towards the improvement of such delivery vehicles.17,22,23
In turn, this study investigates the effectiveness of spherical, short rod, and long rod particles in a variety of conditions experienced by nanoparticle carriers in vivo. The goal of this study is to identify which nanoparticle shape is able to most efficiently deliver therapeutics and to see if the evolutionary preference of long filamentous rods is ideal for the application of therapeutic delivery to diseased conditions. A range of in vitro based microfluidic experimental setups are utilized to mimic certain aspects of vasculature important for understanding the effectiveness of each nanoparticle shape towards maximizing therapeutic delivery, as seen in Fig. 1. The developed microfluidic model serves as a biomimetic blood vessel testing platform which provides novel insight into nanoparticle performance by allowing for the direct quantification of various factors influencing transport. Factors such as nanoparticle binding, endothelial permeability, flow, and pressure conditions are all capable of being precisely measured and locally controlled which in turn allows for a more systematic study of nanoparticle transport efficiency. This novel approach to quantify nanoparticle transport performance allows for the maximization and enhancement of therapeutic delivery crucial for maintaining relatively low therapeutic loads which are safe for patients. From this work, we demonstrate the capabilities of the developed microfluidic system to quantify the influence of key factors on nanoparticle transport while drawing conclusions on which particle shape tested is most ideal for the therapeutic delivery process compared to the solution offered over time by biological evolution. We believe this to be the first work to quantitatively study the effect of particle shape on key factors influencing transport efficiency such as nanoparticle distribution, binding, degree of vascular permeability, along with controlled flow and pressure conditions in a mimetic platform mimicking the vascular system.
Fig. 1. Microfluidic device design and channel orientation. (a) Image of bi-layer device showing apical and basal channel along with respective inlets and outlets. (b) Schematic depicting EC growth on semi-permeable membrane and nanoparticle suspension introduction and transport through intracellular gaps.

Experimental
Experimental design
Improvement of nanoparticle carriers requires the use of mimicked vasculature capable of recreating many of the characteristics found within human vasculature. In order to achieve this goal, microfluidic devices were designed and fabricated with similar geometries as human microvasculature. The microfluidic devices then received coatings of endothelial monolayers to further mimic natural microvasculature in an in vitro setting. Fully prepared devices could then receive nanoparticle and therapeutic flows as a means of understanding the performance of each particle shape. Improvement of nanoparticle delivery was then possible through the selection of particle shapes which most efficiently delivered the largest loads of therapeutics to the mimicked diseased region. Specifics for how each step of the experimental process as a whole was carried out are found in the following sub-sections below.
Device fabrication
Microfluidic devices were fabricated using polydimethylsiloxane (PDMS) (SYLGARD 184, Dow Corning) and assembled into a bi-layer device as observed in Fig. 1. The devices were fabricated using two separate pieces of PDMS with channel molded into them and a polycarbonate semi-permeable membrane (Whatman Cyclopore, Sigma-Aldrich). The semi-permeable membrane is adhered to both pieces of PDMS and sandwiched between the overlapping regions of the channels. The regions where the channels in both pieces of PDMS overlap facilitates transport from one channel into the other through the pores in the semi-permeable membrane. As a result, the pores of the membrane act to dictate the maximum size of materials which can be transferred. In order to only allow for culturing media and small chemical components to pass from one channel to the other while restricting the transport of cells, a membrane with pore size of one micrometer has been chosen. Because cells are not capable of passing through the membrane, a co-culture setup is achievable by growing bovine aortic endothelial cells (BAOECs) on the top surface of the membrane within the apical channel, while human colorectal cancer cells (HCT116s) are grown on the bottom surface of the lower channel termed the basal channel. Additional devices were prepared which consisted of single channels adhered to glass slides. These devices were used for particle distribution and binding studies where a bi-layer setup was not required. Sterilization of the microfluidic devices was carried out by running the fully assembled devices through the autoclave at 134 °C for one hour. The choice of PDMS and polycarbonate as materials for the fabrication of the devices was made in order to prevent any cytotoxic effect on the endothelial or cancer cells. Both PDMS and polycarbonate have been shown to have little cytotoxic effect on cells when properly cured and sterilized.24–28 It is for this reason that both materials are often popular choices when fabricating microfluidic system designed to study the cytotoxic effect of other chemical compound and materials, especially in therapeutic delivery applications.24–30
Nanoparticle fabrication
The fabrication process of monomethoxy poly(ethylene glycol)-block-poly(ε-caprolactone) (mPEG-PCL, Mw = 1.25 kDa) copolymer nanoparticles with spherical and rod-like shapes was performed as follows. In brief, mPEG-PCL freeze-dried powder (10 mg) and fluorescent dye nile red were dissolved in 5 mL tetrahydrofuran (THF). Later, 10 mL of deionized water was added dropwise to the mixture with stirring. After the evaporation of the organic solvent, the final solution was transferred to a dialysis bag (MWCO 1000) and submerged in distilled water for 2 days to remove the unloaded dye. Thus, the spherical nanoparticles were obtained. The fabrication process of the rod-like nanoparticles was similar with that mentioned above. The only difference was that the deionized water was replaced by sodium chloride (NaCl) solution. The length of the nanoparticles was changed by varying the concentration of NaCl solution. Similarly to the PDMS and polycarbonate used to produce the microfluidic devices, the mPEG-PCL is also known to be non-cytotoxic. A large body of literature exists supporting the choice of the mPEG-PCL as a safe and non-toxic material from therapeutic delivery via micelles.31–33
Cell growth on device
After fabrication of the microfluidic devices, both the apical and basal channels were filled with a 0.5% porcine gelatin (PG) (0.5%, Sigma-Aldrich) solution and incubated for 30 minutes at 37 °C and 5% CO2. After incubation, the PG is removed and replaced with BAOEC (Cell Applications, San Diego, CA) suspension in the apical channel and incubated for 12 hours to allow for cell adhesion to the top side of the semi-permeable membrane. After 12 hours, all remaining cell suspension is flown away by establishing media (DMEM (1×) + GlutaMAX-I (Gibco, Life Technologies), 10% HI-FBS (Sigma-Aldrich), 1% Penn/Strep antibiotic (1×) (Gibco, Life Technologies)) flow within the channel using sterile tubing, syringe and syringe pump (PHD 2000, Harvard Apparatus). The flow rate established within the channel is kept low for purposes of media exchange and aligning the BAOECs to flow. These flow based incubation conditions are held constant typically for 3 to 4 days until the endothelial monolayer on the semi-permeable membrane reaches confluency. Upon achieving a confluent BAOEC monolayer in the apical channel, HCT116s (ATCC, Manassas, VA) are flown into the basal channel and allowed to settle and adhere to the bottom of the basal channel for 24 to 48 hours. HCT116 cells are introduced into the devices in order to permeabilize BAOEC monolayers similar to conditions found in various cancerous disease states. Once the HCT116 cells have properly adhered, a flow rate equivalent to that established in the apical channel is setup in the basal channel using a secondary syringe pump. Both the BAOEC and HCT116 cells are grown within the bi-layer device under these flow conditions within an incubator for the remainder of the experimental proceedings.
Establishing shear rate
The effect of fluid shear on the growth of cells and transport of compounds from channel to channel is established using syringe pumps (PHD 2000, Harvard Apparatus). The syringe pumps allow for control over the flow rates established in both channels of the device. By altering the flow rate within the channels, we are able to specifically set and control the shear rate imparted on the cells growing within each channel and any other materials introduced into the channel along with the flowing media. The equation governing the shear rate established in each of the channels is as follows: 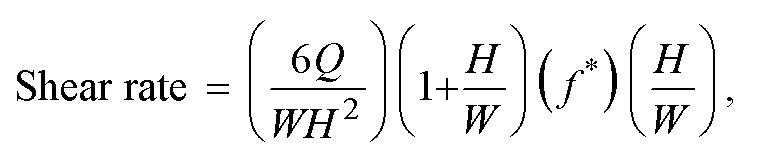 where Q is the established flow rate within the given channel, W is the channel width, H is the channel height, and f* is a geometrical factor based on channel dimensions which for the microfluidic devices used is 0.7946.34 The width and height dimensions for the channels utilized in this study were 500 micrometers and 100 micrometers, respectively. In order to stay within a physiologically relevant range, the shear rate in the apical channel containing the BAOECs was held at 200 s−1 which is at the lower end of range typically experienced within the arterioles of the body.35–37 The shear rate established within the basal channel containing HCT116s was held constant with the shear in the apical channel to prevent any convective flux between channels when not desired. While initially culturing cells within both channels, the shear rate was typically set around 50 s−1 as a means of simply refreshing media exposed to the cells for continued growth while not imparting drastically high shear. It should be noted that equal shear rates were established in both the apical and basal channels in order to prevent the formation of a pressure gradient across the semi-permeable membrane. As a final note, the use of channel dimensions defined above, resulted from several factors which required consideration. Namely, the desire to work within the length scale of smaller human vasculature, ease of endothelial and cancer cell growth, ease of microfluidic device production and long-term device stability factored into the decision of the final channel dimensions. Ideally, producing microfluidic devices on the length scale of less than or equal to 100 micrometers would be more realistic for mimicking human microvasculature.38–40 However, the production of photoresist features on silicon wafers at such a small size is difficult and is not conductive for several round of PDMS casting to form channels. In order to better facilitate the growth of both endothelial and cancer cells, the use of wider channels was opted for in order to enlarge the total volume of media contained within the channels at any given point in time. This factor is especially important once a confluent monolayer of endothelial cells is formed within the channels and cancer cell seeding is attempted. In order to allow the cancer cells enough time to settle and anchor to the surface of the basal channel, the media flow within the devices must be halted otherwise, the cancer cells would wash away down-stream. This period of static incubation can last anywhere from 12 to 24 hours, during which time, the nutrients contained within the channel is limited. If the channel dimensions are made too small, the amount of media contained within the channels would not be sufficient to sustain both cell types unit normal media flow can be re-established. As a final consideration, larger channel dimensions were chosen in order to help keep the resistance of the overall system low. Use of small channel dimensions would have resulted in a very large resistance to the flow of media established with syringe pumps. Having large resistance in the system leads to increased pressures within the devices which in turn result in leakage and rupturing of the bi-layer microfluidics. In order to avoid such conditions, the use of a wider channel geometry allows for the resistance of the system to be maintained at a reasonable level to allow for the experimental proceedings.
Cell imaging and confluency measurements
Cells grown on devices were imaged utilizing standard fluorescence imaging microscopy (Olympus IX70, Hamamatsu C9300, Plan Fluor 10× & 20×, NA: 0.3, RI: 1). For fluorescence imaging, the plasma membranes of the cultured cells were stained with CellMask™ Orange (2.5 μg mL−1, Invitrogen) plasma membrane stain to identify the outer most boundaries of the cells occupying the culturing area. This method of cell plasma membrane (PM) staining allows for the quantification of the area specifically covered by cells within the viewing area of the various fluorescence microscopes. Images taken via conventional fluorescence microscopy were utilized to determine the overall cellular monolayer confluency. These measurements were carried out using the FIGI (ImageJ) software suite and the collected image. The imaging technique was used to obtain the average degree of monolayer confluency as well as to quantify the area occupied by gaps between cells.41,42 The analysis for the cell coverage measurements were taken once the cells had reached confluency within the apical channel of the device just before HCT116s were introduced into the basal channel. A second measurement of all devices was taken at 72 to 96 hours after introduction of HCT116s into the basal channel. Lastly, final measurements for each device were taken 12, 24, 48, 72, 96, and 120 hours after introduction of anti-cancer therapeutics into the device. Image acquisition software utilized includes HCImage Live (Hamamatsu Photonics) for standard fluorescence imaging and NIS-Elements (Nikon) for acquisition of confocal images.
Anti-cancer therapeutics
In order to study how particle transport is influenced by variations in endothelial monolayer permeability, BAOECs were exposed to HCT116s. Treatment of the microfluidic system with the anti-cancer therapeutic, paclitaxel, allowed for varying degrees of BAOEC permeability within the diseased state setup. Paclitaxel functioned to eliminate cancer cells and was chosen due to its wide use, high degree of documentation for in vitro and in vivo data, and relatively inexpensive cost. This anti-cancer therapeutic was introduced into the apical channel of the device in order to mimic an intravenous administration. Any therapeutic introduced into the microfluidic system was subjected to the shear established within the device in order to mimic the situation or blood flow within the body. Therapeutic which successfully transitioned from the apical channel through the semi-permeable membrane into the basal channel were able to act on the HCT116s present. Interaction of the anti-cancer drug with the HCT116s resulted in the death of affected cells, which in turn were washed away downstream and eventually out of the device into the waste media collection containers. As such, the HCT116 cells which were killed off and washed away could no longer contribute to the secretion of permeabilizing agents. Lastly, in order to ensure that the presence of the anti-cancer therapeutic in the apical channel interacting with the BAOECs did not result in the death of healthy BAOEC cells, a high dose of the therapeutic agent was statically incubated with BAOECs prior to the cells reaching confluence in order to determine if the presence of the drug would severely inhibit cell proliferation or cause severe cell death. Chemical authentication and validation data of the paclitaxel utilized in this work was provided by LC Laboratories (Prod. no. P-9600 Lot: ASM-118).
Particle distribution studies
Particle location within the vessel can influence the likelihood of interaction with the endothelial layer of the vessels. In order to understand how well the particles interact with the vascular wall, their distributions under flow conditions was studied. For these studies, particles of each shape were flown through single layer microfluidic devices at varying shear rates. The shear rates chosen were 200 s−1, 800 s−1, and 1600 s−1, which fall within the physiologically relevant range for humans.35–37 In addition to altering shear, test conditions were run with 25% RBCs (Innovative Research, Inc., single donor human RBCs, type O+) and without RBCs. During each flow, fine resolution confocal scans (Nikon C2plus, Plan Fluor 10× & 20×, NA: 0.3, RI: 1) were captured at various points along the channel. The step size utilized for these scans was 50 nm per step, and each scan was made over the entire cross-section of the microfluidic channel. Image data collected from the confocal microscope was then imported into FIGI (ImageJ) and the fluorescence intensity of each scanned layer was calculated and normalized.41 Plotting the measured fluorescence intensities and layer data allows for the distribution of each particle shape to be visualized under the specific flow conditions established during the time of each scan. Comparisons could then be made based on changes in particle shape, established shear rate, and blood conditions.
Particle binding studies
The next important step in the therapeutic delivery process is achieving nanoparticle adhesion to the inner wall of the human vasculature. As such the influence of particle shape, blood conditions, and shear rate on particle binding were investigated. All binding studies were conducted under non-specific conditions, as the particles utilized had no antibody coating. Due to the non-specific binding regime utilized, the binding studies were conducted in microfluidic devices which did not contain cells. The absence of cells within the devices also allowed for improved imaging. Each particle was flown through single layer microfluidic devices at varying shear rates as well as varying blood conditions. As noted above, the shear rates utilized were 200 s−1, 800 s−1, and 1600 s−1, and the blood conditions utilized were no RBCs and 25% RBCs. Particle flows were established using a syringe pump for an established period of time. The total number of particles flown in each test were held constant by varying the duration of the flow to shorter and shorter timeframes as the shear rate utilized increased. This was done to ensure normalized testing conditions across all setups. At the completion of each flow, PBS (1×, Sigma-Aldrich) buffer was flown through the channels to wash away any unbound particles prior to confocal imaging. After washing, confocal scans were made across the entire internal surface of each channel to collect fluorescence intensity data. The scans were then loaded into FIGI (ImageJ), and reconstructed back into a bulk 3D image.41 Final image processing was carried out to determine the fluorescence intensity of particles bound to the inner walls of each channel. Comparisons were then made across varying particle shape, shear rate and blood condition. Finally, for comparative purposes, static binding cases were run, where particle solutions were introduced into the channel and statically incubated for 1 hour prior to rinsing and imaging.
Particle cross-vasculature transport studies
In order to identify the ability of each particle to undergo transport across a semi-permeable membrane, a bi-layer setup for the microfluidic devices was utilized. Particle transport was achieved by flowing particles into the bi-layer channel via syringe pump. In order to quantify, the degree of transport for each test case, the outlets of both the apical and basal channels was collected and measured. The basal outlet contained particles which successfully transported across the semi-permeable membrane, and particles exiting out of the apical outlet were collected and measured to ensure that the total particle concentration introduced into the devices was accounted for at both of the outlets.
The transport studies were carried out under three device conditions as follows, bare devices, devices with only a BAOEC confluent monolayer, and diseased devices containing a monolayer of BAOECs in the apical channel and a monolayer of HCT116s in the basal channel. The second and third device conditions established allowed for studies on the ability of particles to transport under varying degrees of BAOEC permeability.
All transport studies were carried out with flow established in the apical and basal channels. In order to best determine the effect of particle shape on the transport process, all tests were run so that no pressure difference was established across the semi-permeable membrane. The pressures established in both the apical and basal channels for these studies were 632.8, 4832.4, and 17 431.2 Pa. Bare device studies did not utilize any cell culturing within the channels prior to introduction of particle suspensions. Devices run with BAOEC confluent monolayers were established 3 to 4 days prior to particle suspension flows to ensure that a highly confluent monolayer was present in the apical channel over the semi-permeable membrane. Lastly, the diseased state devices, were prepared 6 to 8 days in advance of particle suspension flows. 3 to 4 days were spent growing a confluent apical BAOEC monolayer and the remaining days were spent producing a cancer cell monolayer in the basal channel. As with the binding studies, the transport studies were carried out under adjusted timeframes to ensure that the same number of particles were introduced into each devices regardless of the pressure being used. One final note for the diseased state devices, was the later introduction of an anti-cancer therapeutic to influence the cancer cells in the basal channel and the confluency of the BAOEC monolayer in the apical channel. The degree of particle transport was documented throughout a time-course treatment with the paclitaxel to understand how the BAOEC monolayer integrity influenced the particle transport capabilities.
Statistical analysis
Statistical analysis of all obtained results were run utilizing IBM's SPSS statistical software package (IBM Corp.). All of the figures have significant differences indicated above elements within the plots. One way ANOVA tests were run for each data set with confidence levels of 95% held throughout all plots. All analyses were carried out under conditions of Tukey equal variances assumed, along with tests of homogeneity of variance further verified by both Brown–Forsythe and Welch analyses. Based on the obtained statistical results, all bar graphs contain grouped pairs between groups and within groups indicating statistically significant differences between means indicated by “*”. For all line plots, statistically significant differences in means are compared against the baseline tests for the spherically shaped particles. Significance between both the short rod particle and long rod particle values are indicated by “*”. Significant differences between means for short rod and long rod particles are indicated by “**”, noting that all differences are given at a confidence level of 95%. Within group F values and degrees of freedom for each plot are noted in their respective legends. Sample sizes for all experimental testing were determined by performing estimation for multiple-sample one-way ANOVA pairwise comparison based on pilot studies utilizing the standard sample size approximation of:  All statistical comparisons are run under assumptions of equal variance between groups. This assumption is verified via the Levene's test where all p values must be greater than 0.05 in order to verify the equal variance assumption across groups. All data sets presented in this work pass the Levene's test with p values greater than 0.05.
Data availability
The datasets generated during and/or analyzed during the current study are available from the corresponding authors upon reasonable request.
Cell line authentication
The cell lines utilized in this work do not appear on the “List of Commonly Misidentified Cell Lines” maintained by the International Cell Line Authentication Committee (ICLAC). Cell line authentications (BAOEC: Cell Applications B304-05 & HCT116: ATCC CCL-247) have been provided directly from cell line source. Mycoplasma tests were negative for both cell types used via fluorescence mycoplasma detection kit (MycoFluor Mycoplasma Detection Kit, Sigma-Aldrich, M7006).
Results
Microfluidic device production
Microfluidic devices were successfully produced using polydimethylsiloxane (PDMS) and polycarbonate semi-permeable membranes assembled into a bi-layer device as observed in Fig. 1a with inlets and outlets for the apical and basal channels. Successful sterilization of the devices via an autoclave allowed for cell culture as represented by the diagram in Fig. 1b. The dimensions for the apical and basal channels of the microfluidic devices were 100 μm in height, 100 μm in width, and 25 mm in length.
Characterization of nanoparticle morphology
Three different shapes of polymer nanoparticles were achieved by self-assembly in NaCl–water solution at different concentrations. The morphologies of the particles were measured using transmission electron microscopy (TEM). Solutions without NaCl result in the production of spherical nanoparticles having an average diameter of 45 nm, at 0.05 M NaCl, short rod-like nanoparticles are obtained with an average diameter of ≈25 nm and average length of 150 nm and at 0.5 M NaCl, long rod-like nanoparticles are obtained with an average diameter of ≈25 nm and an average length of 400 nm, as seen in Fig. 2. The formation of nanoparticles with varying shapes was accomplished through the introduction of various NaCl concentrations. When the concentration of NaCl was less than 0.05 M, the resulting micelles were spherical in shape. When the concentration of NaCl reached 0.05 M, the resulting micelles were rod-like in shape (short rod). As the concentration of NaCl was increased, the nanoparticles were observed to elongate. Utilizing a concentration of NaCl equal to 0.1 M, the resulting micelles were 600 nm in length (long rod) where use of 0.05 M resulted in a micelle length of 300 nm.43 In addition, the stability of the nanoparticles has been previous tested and were shown to be stable over the course of 120 hours when subjected to 0.9% physiological saline solution, showing very little degradation.43 Lastly, in a previous study the nanoparticle micelles were shown to have very good cytocompatability over a range of concentrations from 25 μg mL−1 to 500 μg mL−1 for 24 hour incubations.43
Fig. 2. The morphology of polymer nanoparticles via TEM scans. (a) Spherical. (b) Short rod-like. (c) Long rod-like.

Cell confluency measurements
Cell confluency was measured utilizing a plasma membrane stain and fluorescence imaging. From these imaging results, FIGI was utilized to calculate the area within the field of view which was occupied by cells and the area occupied by gaps between cells.44 From the images collected, the degree of cell monolayer coverage, being the area covered by cells expressed as a percentage of the whole viewing area, was determined to be 99.7% when only BAOECs were cultured within the microfluidic devices. However, when HCT116s were introduced and grown in the basal channel in order to alter the BOAEC monolayer permeability, the degree of the BAOEC monolayer confluency dropped to 65.2%. This change in cell area coverage can be seen in Fig. 3, where conditions with HCT116s show lower BAOEC coverage.
Fig. 3. Normalized percentage of BAOEC monolayer permeability under various culturing conditions. Data shown as sum of means ± S.D. (n = 5 independent microfluidic devices). Percentage of confluent BAOEC monolayer intact without HCT116s, with HCT116s, after treatment with paclitaxel for 12 h, after treatment with paclitaxel for 24 h, after treatment with paclitaxel for 48 h, after treatment with paclitaxel for 72 h, after treatment with paclitaxel for 96 h, and after treatment with paclitaxel for 120 h, measured as a percentage of the entire imaging field, collected via standard fluorescent microscopy. One way ANOVA statistical analysis with Tukey equal variances assumed, along with tests of homogeneity of variance verified by Brown–Forsythe and Welch analyses. F7,32 = 108.86. Statistical significance indicated by * brackets in both plots at p ≤ 0.05. Sample collection was carried out from 5 independent devices (biological replicates). All statistical tests have been justified as appropriate.

Subsequent treatment of the permeabilized system with paclitaxel shows slow recovery back to near confluent BAOEC conditions over the course of 120 h. Additional data collected for the area of coverage for the gaps between cells agrees well with the measurements taken of the area covered by cells, see Fig. S1a.† The total area measured independently from the two groups of experiments sum to values near 100%, which would indicate that both methods of data collection resulted in similar results. Representative images of typical results experienced under the various conditions established within the devices can be seen in Fig. S1b–i.†
Particle distribution
In order to better understand where particles tend to concentrate in bulk fluid flow, and the effect which particle shape has on these zones of concentrated particles, confocal based scans were run on the spherical, short rod, and long rod particles. A representative confocal 3D reconstruction is presented in Fig. S2a.† From the confocal scans, the following data was observed for a range of shear rates and blood conditions within the devices. The flow condition which resulted in a peak closest to the channel wall was the long rod particles flown at a shear of 1600 s−1 with the presence of 25% RBCs in suspension. The conditions resulting in the furthest peak from the channel wall was the spherical particles flown at a shear rate of 800 s−1 without RBCs.
General trends observed in the data show that increases in shear rate, larger particle sizes, and conditions with 25% RBCs in suspension lead to concentration peaks closer to the channel walls. Conditions using the two smaller particle shapes run at 200 s−1 resulted in uniform distribution without any concentration peaks. Fig. 4a depicts an example plot of the fluorescence intensity distribution of the spherical particles without RBCs under various shear rates. From the figure peak positions can be observed where the spherical particle concentration is greatest through the cross-section of the channel as flow occurs. Fig. 4b depicts the maximum concentration peak position distance from the wall of the channel for all of the conditions tested. Fig. S2b–g† depicts the confocal fluorescence intensities of each particle shape throughout the depth of the 100 μm channel under various testing conditions.
Fig. 4. Particle concentration peak positions under various flow conditions. Data shown as sum of means ± S.D. (n = 5 independent microfluidic devices). (a) Example spherical particle fluorescence intensity distribution along channel cross-section measured via confocal microscope without RBCs under various shear rates. (b) Particle concentration peak position distances from the channel wall plotted for all particle shapes, blood conditions, and shear rates tested.

Particle binding
Fluorescence intensities of bound particles within the channels was collected via confocal microscopy. The initial scans show the greatest degree of binding for the spherical particles, followed by the short rod and long rod particles, respectively. The initial scans can be seen in Fig. S3a and b,† where increases in shear rate lead to lower levels of particle binding and the presence of RBCs increases the observed binding. However, it should be noted that the initial data does not reflect the differing volumes of each particle shape.
Once normalized for particle volume, the degree of binding shows that the long rod particles are able to bind the greatest amount of therapeutic to the walls of the mimicked vessel, as seen in Fig. 5a and b for conditions with and without RBCs. The short rod and spherical particles had lower degrees of binding after particle volume normalization, respectively. The same trends were observed after normalization for decreases in binding as shear rate increases, and increases in binding with the presence of RBCs. As a final comparison, the particle binding observed under static conditions showed that the presence of RBCs made no difference in the degree of binding. Overall the degree of static binding was substantially larger when compared to the flow based conditions and the long rod particles were determined to be able to bind the greatest amount of therapeutic after particle volume normalization. See Fig. S3c† for static binding data normalized for particle volume.
Fig. 5. Normalized bound particle fluorescence intensities under various shear rates, blood conditions & particle volume considerations coupled with schema. All data shown as sum of means ± S.D. (n = 5 independent microfluidic devices). (a) Normalized bound particle fluorescence intensities at various shear rates without RBCs. Data normalized for particle volume. F8,27 = 298.32. (b) Normalized bound particle fluorescence intensities at various shear rates with 25% RBCs. F8,27 = 69.31. Data normalized for particle volume. One way ANOVA statistical analysis with Tukey equal variances assumed, along with tests of homogeneity of variance verified by Brown–Forsythe and Welch analyses. Statistical significance indicated by * brackets in both plots at p ≤ 0.05. Sample collection was carried out from 5 independent devices (biological replicates). All statistical tests have been justified as appropriate. (c) Particle binding schema indicating larger contact area for long rod and short rod nanoparticles along with a larger magnitude shear stress placed on sphere nanoparticle.

After normalization for particle volume the ideal nanoparticle shape for the binding of therapeutics to the inner wall of a vessel would be the long rod particles flown under conditions with RBCs at the lowest shear rate as seen in Fig. 5. Fig. 5c depicts a schema of the differences in binding area and shear stress exposure for the three different nanoparticles tested. These differences depicted in Fig. 5c influence the overall nanoparticle binding observed which will be considered later in the Conclusion.
Particle cross-vascular transport
We turn to the final phase of therapeutic delivery which is the transport of particles from within the vasculature out into diseased tissues. As mentioned previously, a bi-layer microfluidic setup was utilized to facilitate particle transport with all tests being carried out under conditions without RBCs and equal pressures across the membrane. Fig. 6a depicts the particle diffusion process from the apical channel into the basal channel which results in a particle concentration gradient. The data presented in this section has been normalized for particle volume in order to determine the ideal particle shape for therapeutic delivery. Fig. 6b through Fig. 6d depict the therapeutic transport achieved based on the condition established in the devices. Under bare channel and diseased channel conditions, the long rod particles were capable of achieving the greatest amount of therapeutic transport for all equal pressure cases tested. The short rods showed the greatest therapeutic delivery under healthy BAOEC monolayer conditions at the two lower equal pressure cases tested and the spherical particles showed improved delivery at the greatest equal pressure case under healthy conditions. Reduction in therapeutic delivery with increased equal pressures during testing was observed for all device setups tested as seen in Fig. 6b–d.
Fig. 6. Cross-sectional fluorescence image of particles flowing through bi-layer microfluidic device & normalized drug transport for various particle shapes and device conditions. Data shown as sum of means ± S.D. (n = 5 independent microfluidic devices). (a) Particle diffusion is observed from the apical into the basal channel via gradient of particle concentrations, indicated by image brightness. Scale bar is 100 μm, blue arrows indicate flow directions in both apical and basal channels, and red dashed line indicates where the semi-permeable membrane is located in the cross-sectional view. (b) Normalized drug transport for particle shapes at various pressures in bare microfluidic devices. F8,18 = 413.70. (c) Normalized drug transport for particle shapes at various pressures in microfluidic devices containing confluent BAOEC monolayers. F8,18 = 632.71. (d) Normalized drug transport for particle shapes at various pressures in diseased state microfluidic devices with apical BAOECs and basal HCT116s. F8,18 = 5535.61. All data normalized for particle volumes. One way ANOVA statistical analysis with Tukey equal variances assumed, along with tests of homogeneity of variance verified by Brown–Forsythe and Welch analyses. Statistical significance between short rod/long rod and sphere (control) indicated by * at p ≤ 0.05 & statistical significance between short rod and long rod indicated by ** at p ≤ 0.05. Sample collection was carried out from 5 independent devices (biological replicates). All statistical tests have been justified as appropriate.

Taking the diseased state model one step further, the addition of paclitaxel to the disease state showed recovery in the BAOEC monolayer. The constant perfusion of paclitaxel along with the particles was carried out over the course of 5 days as particle transport was monitored as seen in Fig. 7. At 12 hours of treatment, the amount of particle transport began to drop slightly as the HCT116s began to die off and the BAOECs began to recover their confluency. After 24 hours, transport continued to drop, with a shift at 4832.4 Pa where the short rods began to perform noticeably better than the long rods and spherical particles. After 48 hours, transport of all three particle shapes continued to drop, with a very marked drop in long rod transport at 632.8 Pa. Also at 48 hours of treatment, the short rods perform the best at 4832.4 Pa. At 72 hours, the long rod transport dropped even further performing worse than the short rods at 632.8 Pa and worse than both of the other particles at 4832.4 Pa and 17 431.2 Pa. After 96 hours of treatment, the transport data begins to resemble the trends observed in the BAOEC confluent devices. The short rods perform the best at the two lower pressures and the spherical particles begin to show improved performance at the highest pressure. The long rods across all pressures perform the worst after 96 hours of treatment as the pores in the BAOEC monolayer begin to drastically reduce in size and frequency. Finally, after 120 hours of treatment, the transport data is quite indistinguishable from the data and trend observed for devices only containing confluent monolayer of BAOECs. The time-course of particle transport during the paclitaxel treatment can be observed in Fig. 7 at the three equal pressure cases tested. Break-downs of each time interval throughout the whole time-course can be seen in Fig. S4.†
Fig. 7. Normalized time-course plots of drug transport for various particle shapes and pressures during paclitaxel treatment. Data shown as sum of means ± S.D. (n = 5 independent microfluidic devices). (a) Normalized time-course drug transport for particle shapes over 120 h at 632.8 Pa. F20,42 = 2 479 376.58. (b) Normalized time-course drug transport for particle shapes over 120 h at 4832.4 Pa. F20,42 = 114.79. (c) Normalized time-course drug transport for particle shapes over 120 h at 17 431.2 Pa. F20,42 = 1.60. One way ANOVA statistical analysis with Tukey equal variances assumed, along with tests of homogeneity of variance verified by Brown–Forsythe and Welch analyses. Statistical significance between short rod/long rod and sphere (control) indicated by * at p ≤ 0.05 & statistical significance between short rod and long rod indicated by ** at p ≤ 0.05. Sample collection was carried out from 5 independent devices (biological replicates). All statistical tests have been justified as appropriate. Diagrams in (a)–(c) indicate the nanoparticle shape for maximum drug delivery across endothelial monolayer to diseased site.

Discussion
The goal of this study was to provide insight into improving therapeutic delivery performance through the application of variously shaped particles.
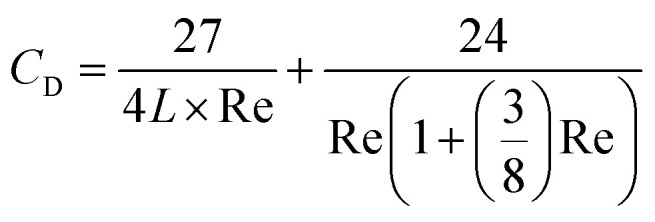
Enhanced conditions for distributing particles nearest to channel walls were achieved by using long rods with 25% RBCs at the shear rate of 1600 s−1. These results were observed because the long rods have larger surface area exposure to the inertial lift force pushing towards the walls and a drag force pushing towards the channel core.44–46 The distribution peaks follow the trends outlined by the theory of hydrodynamic lift and drag as predicted by the lift eqn (1) from Takemura & Magnaudet:
 |
1 |
along with the hydrodynamic drag eqn (2) from Vasseur & Cox:
 |
2 |
where CL is hydrodynamic lift, CD is hydrodynamic drag, β is a coefficient (0.50698 for this study), L is the distance away from the channel wall, and Re is the particle Reynolds number.44–48 Beyond particle distribution, the long rod particles were shown to undergo improved binding to the channel walls.
The binding section indicates that the best performer is the long rods at the lowest shear rate tested of 200 s−1 with 25% RBCs. The large volume of the long rod significantly outperforms the other shapes because adhesion of a single long rod is equivalent to more than 2 short rods and more than 4 spherical particles. Therefore the long rod particles are best at binding therapeutic to the vessel lumen because of the large surface area over which non-specific binding can occur. Additionally, long rods and short rods have less area exposed to shear flow within the channel reducing drag. These factors result in greater particle binding for the long rods as depicted in the schema of Fig. 5c.
Lastly, the transport portion of this study showed that short rods and spherical particles performed best due to their smaller size and small gaps in the EC monolayer for healthy vessels. Diseased conditions showed improved performance with long rods due to large gaps in the EC monolayer. However, treatment with paclitaxel resulted in changes in transport as the BAOEC monolayers regained confluency as in Fig. 3 with schema. The long rods performed best under low pressures throughout the treatment time-course because the particles had longer to undergo diffusion transport. However under medium pressure initial treatment with long rods followed by short rods after 12 hours performed best due to shorter particle diffusion times and reduced EC permeability as therapeutic treatment progressed. Lastly, treatment under high pressures were best for short rods followed by spherical particles after 24 hours due to the very brief diffusion timeframe and reduction in EC permeability with paclitaxel treatment. The low pressure conclusions agree well with in vivo mice tumor studies by Zhou and colleagues (2012), with the long rods delivering the greatest amount of drug under pressures near the lower end of the range tested in this work.49
One final consideration given to the process of therapeutic delivery via nanoparticle carries is the biodistribution of the carriers in vivo and the circulation times associated with various particle sizes and shapes. It is well documented in literature that smaller particles tend to be more readily absorbed by the tissue of organs such as the liver, lungs and spleen. In general, these three particular organs tend to have the greatest accumulation of nanoparticles, either due to filtration functions within the body or large surface area for material absorption and exchange.17,21–23 When compared to the results obtained from our blood vessel model we found that our conclusions were in good agreement with the trend observed in vivo. The spherical particles tended to most easily transport from the mimicked vessel over to the surrounding tissue. Likewise, it is well accepted in literature that larger particles or particles with larger aspect ratios, such as long filaments, tend to have longer circulation times in vivo.17,21–23 The longer circulation lifetime of larger particles results from lower rates of binding with vascular walls and being taken up by surrounding tissue less easily due to their size.17,21–23 Again these trends were observed in our model system, where the long rod particles bound in the lowest quantity to the walls of the mimicked vessel, however, due to their larger therapeutic carrying capacity were able to outperform the smaller particles when considering the characteristic of drug delivery.
Conclusion
Overall, the long rod filamentous nanoparticles have presented as the best option for the delivery of therapeutics from the three shapes studied in this work. The biomimetic nature of the long rods leverages the same effect observed in vesicle, virion, and DNA transport/translocation to efficiently deliver large payloads in as few packages as possible.19,20,50–53 Improving disease treatment also relies on the pressure or flow rate in the general zone of the disease, as well as the time-course over which treatment is administered. The best option for patients may not be as simple as picking a single particle shape and treating over the entire duration of the disease. Instead, consideration may be given to trying an initial combination of particle shapes, or changing particle shapes throughout treatment time-courses. Future work geared around additional nanoparticle shapes and shape changing particles may offer carrier even better adapted for therapeutic delivery to diseased sites. In addition more diverse future studies of various disease conditions beyond tumor environments are possible which could utilize nanoparticles carrying therapeutic loads.
Conflicts of interest
There are no conflicts to declare.
Supplementary Material
Acknowledgments
This work is partially supported by the National Natural Science Foundation of China (Grant No. 21574105, 51725303 to SZ) and by the National Science Foundation (Grant NSF IIP-1701136, CBET-1113040, CBET-1067502, DMS-1516236 to YL), the National Institutes of Health (NIH) (Grant R01HL131750 and EB015105 to YL), the Pennsylvania Infrastructure Technology Alliance (PITA) program and the Alternatives Research & Development Foundation.
Electronic supplementary information (ESI) available. See DOI: 10.1039/c8ra00033f
References
- Stein W., The movement of molecules across cell membranes, Elsevier, New York, USA, 2012 [Google Scholar]
- Simons K. Ikonen E. Nature. 1997;387:569. doi: 10.1038/42408. [DOI] [PubMed] [Google Scholar]
- Cevc G. Handb. Biol. Phys. 1995;1:465. [Google Scholar]
- Alder N. N. Theg S. M. Cell. 2003;112:231. doi: 10.1016/S0092-8674(03)00032-1. [DOI] [PubMed] [Google Scholar]
- Wilson M. A. Pohorille A. J. Am. Chem. Soc. 1996;118:6580. doi: 10.1021/ja9540381. [DOI] [PubMed] [Google Scholar]
- Inoki K. Zhu T. Guan K.-L. L. Cell. 2003;115:577. doi: 10.1016/S0092-8674(03)00929-2. [DOI] [PubMed] [Google Scholar]
- Müller V. Appl. Environ. Microbiol. 2003;69:6345. doi: 10.1128/AEM.69.11.6345-6353.2003. [DOI] [PMC free article] [PubMed] [Google Scholar]
- Thauer R. K. K. Jungermann K. Decker K. Microbiol. Mol. Biol. Rev. 1977;41:100. doi: 10.1128/br.41.1.100-180.1977. [DOI] [PMC free article] [PubMed] [Google Scholar]
- Decuzzi P. Ferrari M. Biomaterials. 2008;29:377. doi: 10.1016/j.biomaterials.2007.09.025. [DOI] [PubMed] [Google Scholar]
- Moghimi S. M. Hunter A. C. Andersen T. L. Annu. Rev. Pharmacol. Toxicol. 2012;52:481. doi: 10.1146/annurev-pharmtox-010611-134623. [DOI] [PubMed] [Google Scholar]
- Gentile F. Chiappini C. Fine D. Bhavane R. C. Peluccio M. S. Ming-Cheng Cheng M. Liu X. Ferrari M. Decuzzi P. J. Biomech. 2008;41:2312. doi: 10.1016/j.jbiomech.2008.03.021. [DOI] [PubMed] [Google Scholar]
- Decuzzi P. Ferrari M. Biomaterials. 2006;27:5307. doi: 10.1016/j.biomaterials.2006.05.024. [DOI] [PubMed] [Google Scholar]
- Sato K. Sasaki N. Svahn H. A. Sato K. Adv. Drug Delivery Rev. 2014;74:115. doi: 10.1016/j.addr.2013.08.009. [DOI] [PubMed] [Google Scholar]
- Weissleder R. Kelly K. Sun E. Y. Shtatland T. Josephson L. Nat. Biotechnol. 2005;23:1418. doi: 10.1038/nbt1159. [DOI] [PubMed] [Google Scholar]
- Moghimi S. M. Murray J. C. Hunter A. C. Pharmacol. Rev. 2001;53:283. [PubMed] [Google Scholar]
- Hood J. D. Bednarski M. Frausto R. Guccione S. Reisfeld R. A. Xiang R. Cheresh D. A. Science. 2002;296:2404. doi: 10.1126/science.1070200. [DOI] [PubMed] [Google Scholar]
- Geng Y. Dalhaimer P. Cai S. Tsai R. Tewari M. Minko T. Discher D. E. Nat. Nanotechnol. 2007;2:249. doi: 10.1038/nnano.2007.70. [DOI] [PMC free article] [PubMed] [Google Scholar]
- Cevc G. Gebauer D. Biophys. J. 2003;84:1010. doi: 10.1016/S0006-3495(03)74917-0. [DOI] [PMC free article] [PubMed] [Google Scholar]
- Prokhnevsky A. I. Peremyslov V. V. Napuli A. J. Dolja V. V. J. Virol. 2002;76:11003. doi: 10.1128/JVI.76.21.11003-11011.2002. [DOI] [PMC free article] [PubMed] [Google Scholar]
- Santa Cruz S. Roberts A. Prior D. Chapman S. Oparka K. Plant Cell. 1998;10:495. doi: 10.1105/tpc.10.4.495. [DOI] [PMC free article] [PubMed] [Google Scholar]
- Decuzzi P. Godin B. Tanaka T. Lee S. Y. Chiappini C. Liu X. Ferrari M. J. Controlled Release. 2010;141:320. doi: 10.1016/j.jconrel.2009.10.014. [DOI] [PubMed] [Google Scholar]
- Albanese A. Tang P. S. Chan W. C. W. Annu. Rev. Biomed. Eng. 2012;14:1. doi: 10.1146/annurev-bioeng-071811-150124. [DOI] [PubMed] [Google Scholar]
- Huang X. Li L. Liu T. Hao N. Liu H. Chen D. Tang F. ACS Nano. 2011;5:5390. doi: 10.1021/nn200365a. [DOI] [PubMed] [Google Scholar]
- Ma B. Zhang G. Qin J. Lin B. Lab Chip. 2009;9:232. doi: 10.1039/B809117J. [DOI] [PubMed] [Google Scholar]
- Mockers O. Deroze D. Camps J. Dent. Mater. 2002;18:311. doi: 10.1016/S0109-5641(01)00055-0. [DOI] [PubMed] [Google Scholar]
- Brown R. S. Akhtar P. Akerman J. Hampel L. Kozin I. S. Villerius L. A. Klamer H. J. C. Environ. Sci. Technol. 2001;35:4097. doi: 10.1021/es010708t. [DOI] [PubMed] [Google Scholar]
- Ziolkowska K. Jedrych E. Kwapiszewski R. Lopacinska J. Skolimowski M. Chudy M. Sens. Actuators, B. 2010;145:533. doi: 10.1016/j.snb.2009.11.010. [DOI] [Google Scholar]
- Prot J. M. Bunescu A. Elena-Herrmann B. Aninat C. Snouber L. C. Griscom L. Razan F. Bois F. Y. Legallais C. Brochot C. Corlu A. Dumas M. E. Leclerc E. Toxicol. Appl. Pharmacol. 2012;259:270. doi: 10.1016/j.taap.2011.12.017. [DOI] [PubMed] [Google Scholar]
- Thomas A. Wang S. Orr C. Sohrabi S. He R. Shi W. Liu Y. Biomicrofluidics. 2017;11(2):024102. doi: 10.1063/1.4977584. [DOI] [PMC free article] [PubMed] [Google Scholar]
- Uhl C. Muzykantov V. R. Liu Y. Biomicrofluidics. 2017 doi: 10.1063/1.5000377. [DOI] [PMC free article] [PubMed] [Google Scholar]; , accepted
- Gou M. Zheng X. Men K. Zhang J. Wang B. Lv L. Wang X. Zhao Y. Luo F. Chen L. Zhao X. Wei Y. Qian Z. Pharm. Res. 2009;26:2164. doi: 10.1007/s11095-009-9929-8. [DOI] [PubMed] [Google Scholar]
- Wang T. Jiang X. Tang Q. Li X. Lin T. Wu D. Zhang X. Okello E. Acta Biomater. 2009;5:2939. doi: 10.1016/j.actbio.2009.04.040. [DOI] [PubMed] [Google Scholar]
- Tanaka K. Kanazawa T. Shibata Y. Suda Y. Fukuda T. Takashima Y. Okada H. Int. J. Pharm. 2010;396:229. doi: 10.1016/j.ijpharm.2010.06.028. [DOI] [PubMed] [Google Scholar]
- Son Y. Polymer. 2007;48:632. doi: 10.1016/j.polymer.2006.11.048. [DOI] [Google Scholar]
- Nigro P. Abe J.-I. Berk B. C. Antioxid. Redox Signaling. 2011;15:1405. doi: 10.1089/ars.2010.3679. [DOI] [PMC free article] [PubMed] [Google Scholar]
- Nagaoka T. Yoshida A. Invest. Ophthalmol. Visual Sci. 2006;47:1113. doi: 10.1167/iovs.05-0218. [DOI] [PubMed] [Google Scholar]
- Thomas A. Tan J. Liu Y. Microvasc. Res. 2014;94:17. doi: 10.1016/j.mvr.2014.04.008. [DOI] [PMC free article] [PubMed] [Google Scholar]
- Sevick E. M. Jain R. K. Cancer Res. 1991;51:265. [PubMed] [Google Scholar]
- Fronek K. Zweifach B. W. Am. J. Physiol. 1975;228:791. doi: 10.1152/ajplegacy.1975.228.3.791. [DOI] [PubMed] [Google Scholar]
- Mayrovitz H. N. Roy J. Am. J. Physiol. 1983;245:H1031. doi: 10.1152/ajpheart.1983.245.6.H1031. [DOI] [PubMed] [Google Scholar]
- Jensen E. C. Anat. Rec. 2013;296:378. doi: 10.1002/ar.22641. [DOI] [PubMed] [Google Scholar]
- Rasband W., ImageJ, U. S. Natl. Institutes Heal. Bethesda, Maryland, USA, http://imagej.nih.gov/ij/, accessed: 01, 2017 [Google Scholar]
- Li D. Tang Z. Gao Y. Sun H. Zhou S. Adv. Funct. Mater. 2016;26:66. doi: 10.1002/adfm.201503664. [DOI] [Google Scholar]
- Zeng L. Balachandar S. Fischer P. J. Fluid Mech. 2005;536:1. doi: 10.1017/S0022112005004738. [DOI] [Google Scholar]
- Matas J. P. Morris J. F. Guazzelli E. Oil Gas Sci. Technol. 2004;59:59. [Google Scholar]
- Howard M. P. Gautam A. Panagiotopoulos A. Z. Nikoubashman A. Phys. Rev. Fluids. 2016;1:44203. doi: 10.1103/PhysRevFluids.1.044203. [DOI] [Google Scholar]
- Takemura F. Magnaudet J. J. Fluid Mech. 2003;495:235. doi: 10.1017/S0022112003006232. [DOI] [Google Scholar]
- Vasseur P. Cox R. J. Fluid Mech. 1977;80:561. doi: 10.1017/S0022112077001840. [DOI] [Google Scholar]
- Chen T. Guo X. Liu X. Shi S. Wang J. Shi C. Qian Z. Zhou S. Adv. Healthcare Mater. 2012;1:214. doi: 10.1002/adhm.201100040. [DOI] [PubMed] [Google Scholar]
- Storm A. J. Storm C. Chen J. Zandbergen H. Joanny J.-F. Dekker C. Nano Lett. 2005;5:1193. doi: 10.1021/nl048030d. [DOI] [PubMed] [Google Scholar]
- Wanunu M. Sutin J. McNally B. Chow A. Biophys. J. 2008;95:4716. doi: 10.1529/biophysj.108.140475. [DOI] [PMC free article] [PubMed] [Google Scholar]
- Storm A. J. Chen J. H. Zandbergen H. W. Dekker C. Phys. Rev. E: Stat., Nonlinear, Soft Matter Phys. 2005;71:1. doi: 10.1103/PhysRevE.71.051903. [DOI] [PubMed] [Google Scholar]
- Meller A. Nivon L. Branton D. Phys. Rev. Lett. 2001;86:3435. doi: 10.1103/PhysRevLett.86.3435. [DOI] [PubMed] [Google Scholar]
Associated Data
This section collects any data citations, data availability statements, or supplementary materials included in this article.
Supplementary Materials
Data Availability Statement
The datasets generated during and/or analyzed during the current study are available from the corresponding authors upon reasonable request.