Abstract
Dementia disorders are increasingly becoming sources of a broad range of problems, strongly interfering with the normal daily tasks of a growing number of individuals. Such neurodegenerative diseases are often accompanied with progressive brain atrophy that, at late stages, leads to drastically reduced brain dimensions. Currently, this structural change could be followed with X-ray computed tomography (XCT) or magnetic resonance imaging (MRI), but they share numerous disadvantages in terms of usability, invasiveness and costs. In this work, we aim to retrieve information concerning the brain-atrophy stage and its evolution, proposing a novel approach based on non-invasive time-resolved near infra-red (tr-NIR) measurements. For this purpose, we created a set of virtual human-head atlases in which we eroded the brain as it would happen in a clinical brain-atrophy progression. These realistic meshes were used to simulate a longitudinal tr-NIR study, investigating the effects of an increased amount of cerebral spinal fluid (CSF) in the photon diffusion. The analysis of late photons in the time-resolved reflectance curve–obtained via accurate Monte Carlo simulations–exhibited peculiar slope-changes upon CSF layer increase. The visibility of the effect under several measurement conditions suggested good sensitivity to CSF variation, even in the case of real measurement and under different geometrical models. The robustness of the results might promote the technique as a potential indicator of the dementia progression, relying only on fast and non-invasive optical observations.
1. Introduction
In modern societies, demographic changes related to population ageing are already exhibiting dramatic impact from a personal, societal and economical point of view. Invalidating diseases slowly and inexorably push the sufferers and their families at the edge of the society, allowing little possibilities to maintain decent life expectations. Medical science and closely related research fields are currently pursuing a broad counter attack to such health issues, aiming at the full comprehension and cure of the sickness. A clear understanding of the disease generation and its evolution are key-points for reducing, alleviating or arresting the progression of the illness, thus helping the individual to return back to a normal-life condition.
In this scenario, generic Dementia symptoms –that progressively impair mental abilities– are one of the most difficult enemies to tackle. Accounting for 60-80% of the total cases diagnosed, the Alzheimer’s disease (AD) is the most common type of dementia, followed by vascular dementia (VD), dementia with Lewy bodies (DLB), Parkinson’s disease (PD), normal pressure hydrocefalus (NPH), frontotemporal dementia (FTD) and other rarer conditions [1,2]. At the moment, this class of diseases have no cure nor a clear comprehension of the phenomena behind their evolution. Moreover, there are no validated ways to diagnose them –especially at early stages– and neither a way to arrest (or prevent) the disease progression. Several ongoing researches have selected potential biomarkers which exhibit good ability to indicate early stage of the dementia disorders. Brain imaging [3–5], amyloid-PET imaging [6], presence of proteins in cerebral spinal fluid (CSF) [7–9] or in blood [10] and genetic risk profiling [11] are exceptionally good candidates, but at the moment they lack in general validation. Almost all of them rely on invasive procedures to evaluate the markers: Contrast agent injection [12], CSF sampling from the spinal cord [13] or blood sampling [5,14] are the typical diagnostic options. Not only they are invasive, but they also rely on x-ray computed tomography (XCT), positron emission tomography (PET), magnetic resonance imaging (MRI) measurements or post-sampling chemical analysis: in general, these procedures are slow in measuring/interpreting the results and definitely very expensive for the healthcare system.
There is –without any doubt– a clinical need for a fast and easy way to detect, monitor and follow in time the disorders, helping Dementia research to reach a wider number of patients. Apart from monitoring symptoms of memory loss and difficulty in performing normal every-day tasks, one of the less invasive way to follow the dementia progression is the MRI-estimation of the cerebral atrophy. In fact, brain volume reduction is associated with many kinds of dementia such as in AD [3,4], NPH and FTD [15]. In turns, the disease progression implies the increase of CSF volume circulating in the braincase, compensating the reduction of the brain in specific regions. Such fluid plays the role of nutrient vector and mechanical cushion for the brain, having the potential to be one of the most reliable biomarker for the diagnosis of dementia disorders. In particular, the analysis of the CSF can report traces of beta-amyloid plaques developing on the brain external cortex when the AD progresses, leading to a quite reliable tool for the diagnosis of this disease. Interestingly this fluid –constituted by 99% of water– results to be optically transparent in the visible and near-infrared range, having almost negligible absorption and scattering coefficients. In these terms, a generic dementia development could be seen as a volume-increase of non-scattering regions within the head that would strongly affect the photon diffusion within the tissues, as already proven by several works on the fields [9,16,17].
In our work, we examine the possibility of retrieving information connected to the CSF variation -in the case of a generic dementia-related disorder- by making use of fast optical non-invasive techniques. Specifically, we will show how time-resolved near infrared (tr-NIR) measurements have the potential to extract information about the presence of the disease, being effectively capable of monitoring its development. Carrying on such kind of studies requires careful design and important investments that must be evaluated in advance, in order to estimate the impact of the proposed research. To do so, we propose a computational approach to study the visibility of the dementia evolution via optical techniques. We will firstly approach the schematization of brain atrophy progression (BAP) in two geometries: a simple cylindrical model with parallel layers and a more complex human-head atlas. Then we make use of Monte Carlo (MC) photon propagation technique to simulate the results of a hypothetical longitudinal experiment on a human being. The goal is to exploit modern optical imaging techniques aiming at the definition of a novel way to monitor dementia diseases, with less expensive and non-invasive laser-based measurements. Explicitly, MC simulations are designed to replicate exactly a tr-NIR measurement, in which photons are probed into the human body and their reflected signal is detected from the same side. In such a way, it is possible to estimate the distribution of time of flight (DTOF), which carries important information about the photon diffusion within the underlying tissues. From the results obtained by running MC simulations while changing the brain volume, we expect to appreciate and characterize variations in the DTOF, thus linking these features to the disease progression.
Although many types of dementia imply brain atrophy, we will refer to the specific case of the AD in which the whole brain shrinks due to a surface erosion mechanism. The same results could be extended to study other neurodegenerative diseases by taking into account more specific brain modifications, such as for example FTD and NPH. Furthermore, these studies could be of interest also for the detection and monitoring of hydrocephalus, where recent reports have demonstrated the possibility to detect such alterations by frequency-domain NIR (fd-NIR) measurements. Potential for assessing these alterations and monitoring drug therapy in low income countries is particularly fascinating [18]. This work, in fact, takes inspiration on recent computational studies on the role of CSF in photon propagation [19–21] and novel understandings in AD progress prediction [22].
2. Strategies to model brain atrophy
To mimic the disease evolution, we realized two different structural models making use of the mesh generator software iso2mesh [23]. As we already mentioned before, we focus our analysis mainly on dementia diseases that imply generalized neuronal atrophy affecting the external surface of the brain, leaving more specific structural effects as a further discussion. Without loss of generality, we will refer to this kind of degeneration as an ideal AD progression [24], which represents a large 80% of the total cases of diagnosed dementia in patients.
2.1 Brain atrophy progression assumption
In the current literature, no structural meshes are available to model the BAP of any dementia disorder. To compensate for the lack of models, we decided to create a set of atlases mimicking the AD progression. The creation of the models is grounded to a simple assumption, which is also one of the best candidates for the indication of the diseases itself: as the AD progresses, the brain starts losing neuronal tissues and its volume shrinks [16,17]. The effect associated with such tissue loss is that the grooves start to widen and the ridges get narrower [25], as if the tissue were eroded from its outer surface. Remarkably, the human body contrasts this cerebral-loss by filling up the empty volume left in the subarachnoid space with more CSF, increasing the thickness of the region where the fluid circulates. This is outright visible in MRI or XCT scans of the human head affected by the various kind of dementia [2,25] and promotes CSF variations as one of the possible biomarkers indicating the presence of the disease.
2.2 BAP in a cylindrical model
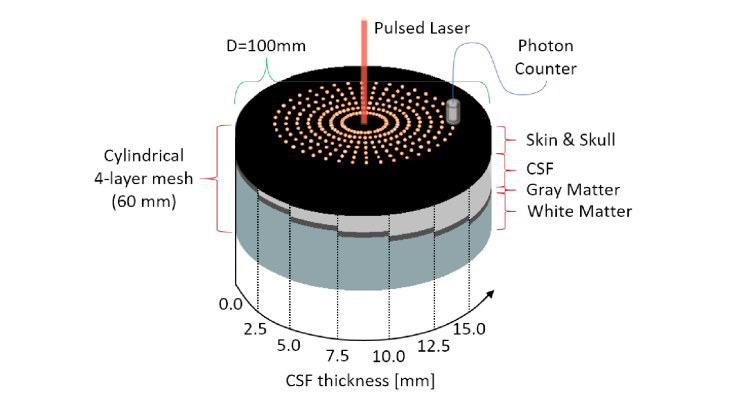
The use of layered samples with optical properties similar to those of the tissues of interest is a simple approach to study the photon diffusion within a biological sample. For this purpose, we created several 4-layered cylindrical mesh volumes, considering each layer as a different tissue: Skin and Skull (SS) as a unique entity, CSF, Gray Matter (GM) and White Matter (WM). The diameter of the cylinder is set to . In each mesh, the SS and GM tissues always have the same thickness, while the CSF increments in size to mimic the AD progression. The WM tissue was decreased to keep constant the total height of the cylinder, set to be . We assume that no photons will trespass the cylinder, due to the very high scattering properties of the WM region. In total, we considered seven CSF thicknesses ranging from to in steps of , which are shown at a glance in the infographic of Fig. 1. On top of the SS surface we inserted 280 nodes, arranged in a concentric fashion. Each node defines the location of a time-resolved photon detector, forming 7 ring-arrays constituted by 40 photon counters. The distance between each ring is increased in step of , having interfiber distances ranging from to . Each detector has a photon acceptance radius of and a total recording time window of from the moment of the launch. A pencil beam source impinges in the center of the mesh and the resulting detection functions are stored for each of the different meshes. The results obtained from all the detectors located at the same S-D distances are integrated –due to the bi-dimensional isotropicity of the cylindrical model– increasing the signal to noise ratio by a factor of . This is a common averaging approach used in simple geometries such as in Monte Carlo Multi Layered (MCML) [26].
Fig. 1.
Infographic showing a combined view of the cylindrical 4-layer mesh volumes used in the simulations and the locations of source and detectors on their top layer. Preserving the Skin & Skull and the Gray Matter thickness, a linearly increasing CSF layer is inserted in between, representing a hypothetical Alzheimer’s progression (or, in general, any brain-atrophy dementia-related disorder).
2.3 BAP in a realistic human head model
Although planar layered phantoms are commonly used to compare and test experimental measurements, the availability of more accurate models can be useful to understand the role of geometrical structures in the photon propagation [21,29]. Currently, one of the most accurate human-head mesh structure is the Colin27 model [30,31], composed by a 4-tissues atlas. On the other hand, nothing similar exists for modelling a patient exhibiting BAP at different temporal stages. The lack of such interesting models is compensated in our work by the creation of several meshes progressively reducing the brain dimensions. Since dementia-related phenomena evolve by eroding the brain structure, we decided to perform this operation directly on the WM and GM regions of the Colin27 mesh. Firstly, we separated the four tissues of the model, neglecting the inner closed surfaces in the brain that represent the ventricular cavities. For our specific purpose, there is no hope to detect photons reflected from such deep structures. The surface meshes extracted are enclosing each other with the same order as in the cylindrical model: starting from the outer layer toward the inner one we find the SS, the CSF, the GM and the WM. Each closed-surface was converted into a binary volume with an isotropic voxel (3D cubic pixel unit) resolution of in the three spatial dimensions, then the enclosed regions were filled. From now on, we abbreviate voxel as “”. The result of this operation returns four volumetric data sets containing the atlases of each structure considered. Two of them were left unaltered, SS and CSF regions, since the external shape of the scalp and the inner surface of the skull are not structurally affected by the AD disease. Every modification that follows was performed on both GM and WM binary data sets. Since the disease progression is associated with the loss of brain matter, we decided to operate in the exact same way as AD acts, aiming at miming the eroding nature of the disease.
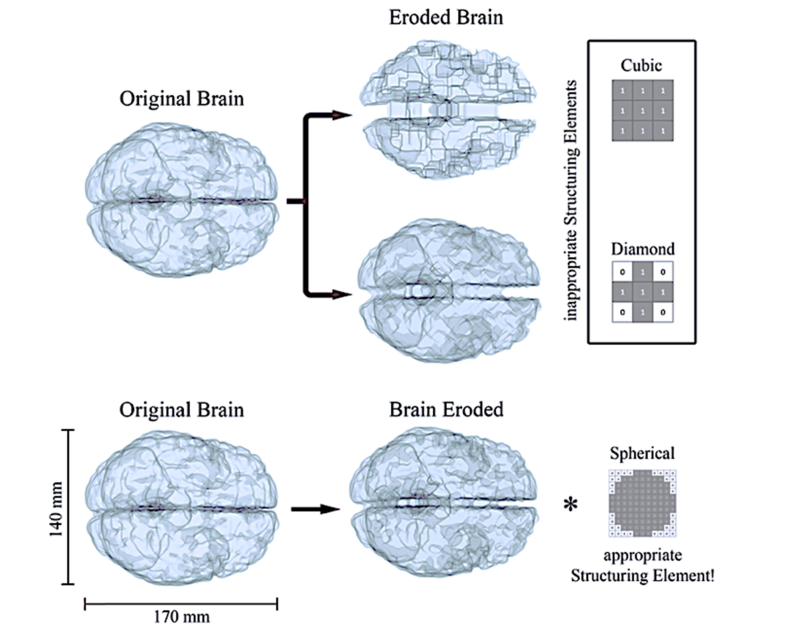
A binary erosion-operator [32] was applied to both GM and WM volumes, eroding the tissues with different structuring elements. Using first neighborhood erosion (cubic and diamond structuring elements in Fig. 2) resulted to be a bad choice: single point cavities in the brain, such as small foldings and grooves, started developing into artifacts similar to the structuring element used. The top panel of Fig. 2 shows what happens by eroding with such structures, where squared or triangular cavities start to be clearly visible at later erosion stages. Instead, spherical-like structuring elements gave smoother results, preserving the original curvature of the foldings at the exterior brain surface (Fig. 2, bottom part). In this preliminary study, we consider the latter to be a good approximation to model the brain erosion mechanism behind dementia diseases.
Fig. 2.
The brain erosion process in voxel coordinates. On the top, it is possible to notice how, using cubic or diamond structuring elements results in a developing of artifact as soon as the brain shrinks. The erosion modeled with a nearly-spherical element is more realistic (bottom), leading to rounded erosion and not leaving shape-artifacts. With the * operator we define the dilation, inverse of the erosion operation, which once applied to the eroded brain would return the original version. For graphical purposes we describe a 2D structuring element (right column), while in our work we have effectively used its 3D counterpart.
We point out that it is not possible to proceed stepwise (1 voxel erosion at each step) and the diameter in the spherical erosion core has to be greater than . In fact, choosing gives rise to cubic artifacts and has diamond evolution. In general, the larger the of the spherical structuring element, the smoother will be the erosion. In our work, we used erosion with spherical structuring element of diameter generating 11 meshes that mimic hypothetical stages of the disease. The whole process took around 2-5 minutes per mesh with a normal PC equipped with a CPU intel i7-4930K and 32 Gb of RAM depending on the BAP stage. More advanced stages have less nodes on the GM and WM surfaces and the meshing time decreases.
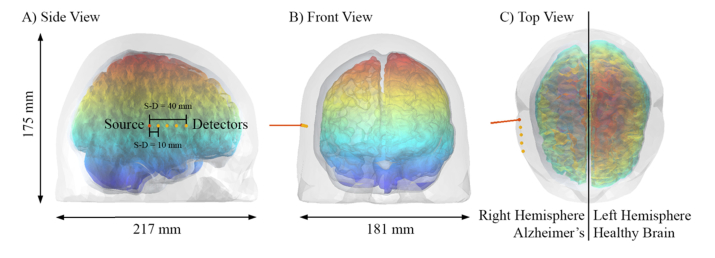
Once the AD models are created we compare their average geometrical features with those of the cylindrical phantoms, trying to be consistent with a real brain shrinking in human. Unfortunately, at the best of our knowledge, the literature is limited and there are no systematic studies on dementia progression that allow accurate quantitative comparison. On the other hand, a pretty variegated literature on structural brain imaging offers a rough estimation of the extents of the BAP in clinical cases. Here we report some analysis, assuming all the patients having the same head size of Colin27 (reported in Fig. 4). In this way we are able to calculate the distance of the brain surface with respect to the inner part of the skull, obtaining an indication for the CSF thickness in different zones affected by atrophy. As a first interesting example, we report the work of Yi et al. [25] that analyses several different patients affected by AD or FTD (Fig. 1), ordering them as a function of their BAP stage. Units are not displayed, but we can estimate the CSF thickening up to at stage 4. Another interesting example is reported in the review from Harper et al. [2], where they show in Fig. 4 various forms of brain-atrophy (although they do not insert any healthy control as a reference). In this case we can take advantage of a patient showing asymmetric atrophy (Fig. 4, 3rd image from the left, top row) clearly showing a right hemisphere strongly eroded if compared to the left one. In this case, the severe right hemisphere shrinkage was in the order of . In the next patient (Fig. 4, 4th image from the left, top row) showing parietal/occipital atrophy, the parietal lobe is apart with respect the skull. Unaffected by atrophy, the temporal lobe is distant a few mm in agreement with what we measured in our model at Stage 0. An extreme example, such as the case reported by DeBrito-Marques [33], shows a patient having amyotrophic lateral sclerosis with dementia (Fig. 2), exhibiting an impressive temporal lobe atrophy. Units are not displayed, but the normalization of the head dimension let us estimate that the brain shrinkage was . Such impressive atrophy was localized in the temporal lobe, the region of the brain that we are going to study in the present work. This, let us estimate that erosions in the range of still represents a clinical case of interest.
Fig. 4.
The pulsed laser source impinging the human head from its right hemisphere. The detector positions are shown in orange and their distance is with respect each other. In this figure, the right lobe of the brain is from the AD model Stage 6 while the left is the original Colin27 model [31]. To help the visualization of the modeled disease progression, we label the z-coordinate with jet color bar.
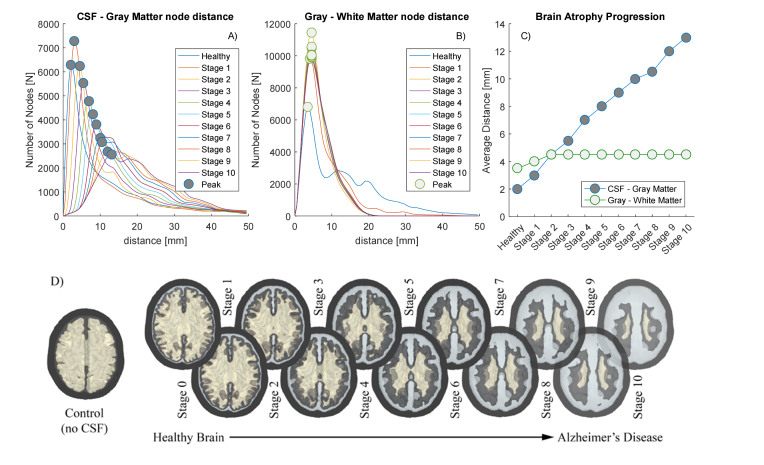
In total, we have built 11 meshes: Stage 1 to Stage 10 for the AD and Stage 0 for the original Colin27 model. As a plus, we consider another mesh that we call Control, obtained by removing the CSF layer (substituted with GM) and dilating the WM one step (). The results of the erosion process and successive re-meshing are presented in Fig. 3 panel D together with their geometric characteristics. Per each surface, we calculated the nodal distance probability distribution (NDPD) of each couple of enclosing layers (SS surface encloses CSF, CSF encloses GM and GM encloses WM). Per each node of the inner surface we find the minimum distance from the outer surface, allowing us to build the NDPD histogram (Fig. 3 panels A-B). Considering its maximum as the average distance between two surfaces, it is possible to estimate the mean thickness of every tissue considered. In agreement with the cylindrical model, the nodal distance between SS and CSF surfaces is and it represents the average thickness of the skin and skull tissue that we assume to be unaltered for every AD Stage. From the plots of Fig. 3 results clear that the average thickness of the GM is preserved during the erosion, while the CSF’s increases approximately in a linear fashion. Once the CSF thickness is characterized at every Stage, it is possible to simulate the time-resolved photon propagation using the tissue properties reported in Table 1. We define a pulsed beam source positioned on the right hemisphere, as show in Fig. 4 panel A), pointing perpendicularly to the SS surface. The underlying cerebral region corresponds to the temporal lobe of the right hemisphere, like in the clinical case of [33]. Four time-resolved photon detectors were located at 10 mm distance one respect to the other. Figure 4 clarifies the position of the source and detectors on the human head and helps visualizing the reduction of the brain volume of the AD models. In such figure, the left GM brain hemisphere at Stage 0 (Colin27) and the right one at Stage 6 are rendered together, visually resembling the clinical case of asymmetric atrophy [2].
Fig. 3.
Informative about the Alzheimer’s model creation. From the top graphs in panels A-C, it is possible to notice how the shrinkage of the brain is linear with respect the increasing thickness of the resulting CSF layer. Both the GM and the WM were shrunk independently with the same criteria, which results to preserve their average distance (and so the average thickness of the GM). D) The bottom infographics shows a tomographic cut of the models and their respective name used throughout the text.
Table 1. Tissues optical properties used in the simulations. The same tissue optical properties are used for both the cylindrical and the human head model. The last column shows the thickness of the layers used in the Cylindrical Model. For the CSF we examined two different scattering coefficients in this study.
2.4 Measurement scheme and instrument response function
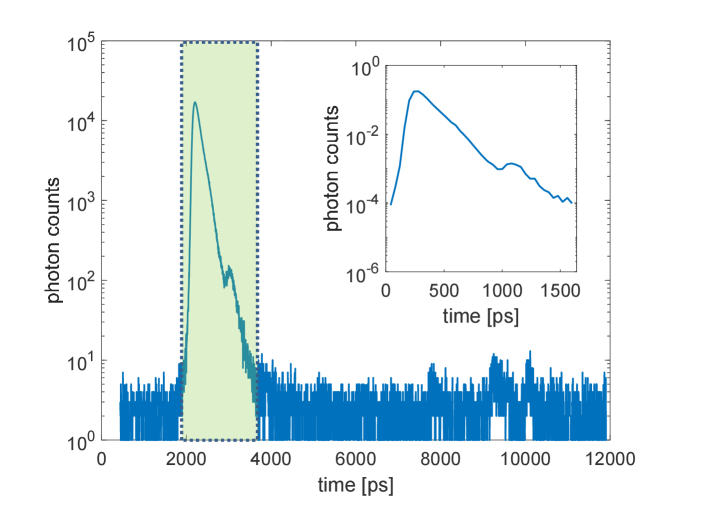
To take into account the perturbation introduced by a realistic measuring system, we acquired experimentally the instrument response function (IRF) of a typical detector used in fNIRS laboratories [34]. We used a picosecond pulsed laser operating at 830 nm (LDH-P, SEPIA II, PicoQuant GmbH, Germany) and a hybrid detector (HPM-100-50, Becker & Hickl GmbH, Germany). The detector was coupled to a Time-Correlated Single-Photon Counting board (TCSPC) (SPC131, Becker & Hickl, Germany), using a full scale of 4096 channels and a resolution factor of . The measured IRF is reported in Fig. 5 and it was convoluted with the simulated MC photon distributions to analyze the measurement effect on a real system. The IRF used for the convolution was cut, normalized and rescaled to a total of 40 channels with time step of , leading to the final IRF shown in the nested plot of Fig. 5.
Fig. 5.
IRF used to reproduce realistic laboratory measurements. The main plot shows the measured IRF of a common detector system and on the nested plot its extracted and normalized version (corresponding to the green region in the main graph) that we used to reproduce the effect of a realistic measurement.
3. Results
In general, light transport within any biological tissue is mathematically described by the Radiative Transport Equation (RTE) [35]. Exact analytical solutions for the RTE are accessible only with simple geometries or with Diffusion Equation (DE) approximation [36], whereas for complex shapes other approaches should be taken into account to correctly infer the photon propagation. Among the others, the Monte Carlo (MC) photon propagation method statistically provides an accurate solution for the RTE for a high number of injected photons [37]. Because of this, it is considered the gold-standard method for modelling the photon diffusion within biological tissues and it is currently widely used as a predictive tool in the optical imaging community [28,35–39]. Thanks to modern paradigms in CPU and GPU computing, Monte Carlo (MC) simulations [27,40] are becoming a feasible choice for modelling the photon diffusion within biological tissues. In this study, we took advantage of one of the most recent and accurate Monte Carlo simulation tool for the photon propagation, the Mesh-based Monte Carlo (MMC) [27], to resolve the photon diffusion within the human-head model. A total of (eleven billion) photons were launched, with an average running time of 10 hours to propagate (one billion) photons per each AD models. We are aware that tissues’ optical properties might vary among different individuals or throughout the disease process, and hence we studied two different scattering coefficients for the CSF. As reported in Table 1, we used extremal values taken from relevant bibliography [27,28] differing each other by one order of magnitude, to be able to comprehend how the results differ with an eventual change of such parameter. In the following, we analyze the results obtained for the cylindrical and human-head meshes, focusing on the possibility of monitoring the disease evolution in time in a realistic laboratory measurement scenario.
3.1 Results of BAP in the cylindrical model
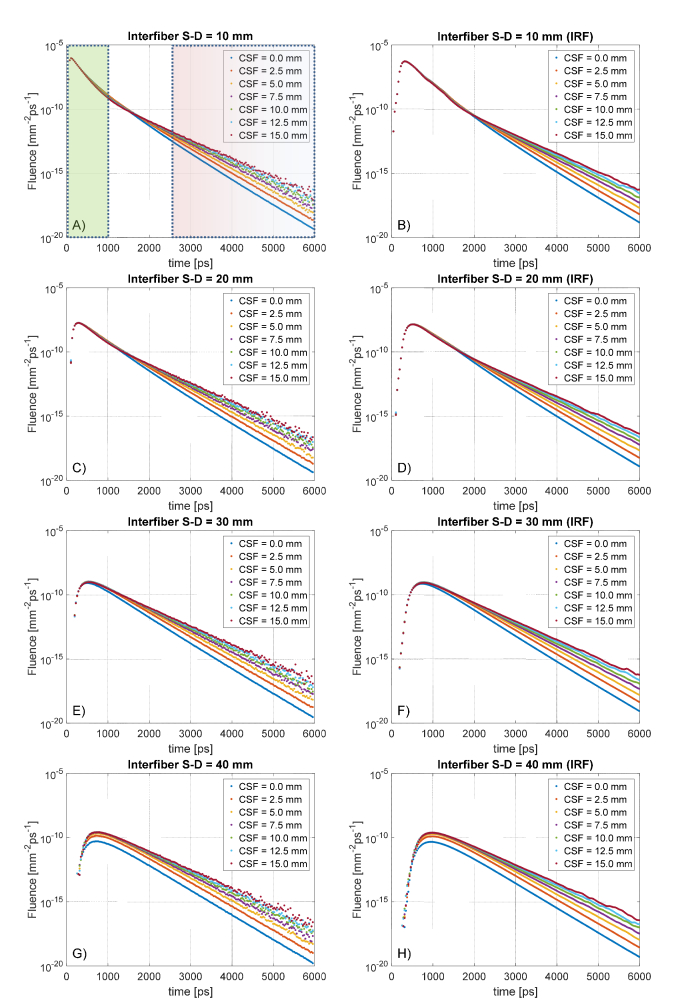
Already with the cylindrical model for the AD we obtained interesting results from the photon diffusion within the phantom. In Fig. 6, we plot the distribution of time of flight (DTOF) –also called time-resolved diffuse reflectance– measured at various interfiber separations. Although we sampled also at other distances, we do not plot the results at intermediate values (, , ) since they would be visually redundant and not adding further information. It is visible from the graphs that increasing the CSF thickness does not turn into any interesting variation at early detection times, with an exception at S-D = 40mm having CSF thinner than 5mm. This is not surprising since the early photons have been spending most of their time in the superficial SS layer.
Fig. 6.
Distribution of time of flight (DTOF) at four interfiber source-detector (S-D) distances for the cylindrical layered phantoms at various CSF thicknesses. On the left column, the raw data considering an ideal response of the detector, on the right the corresponding curves convolved with a typical instrument response function (IRF). In the first plot are marked the temporal windows considered as early-photons (green) and late-photons (red) gating.
This happens at short S-D separations ( to ) because the reflectance curve of each AD model shares the same trend with the Control model without CSF. At longer distances ( to ) instead, the AD and Control models start to diverge, suggesting contributions from deeper tissues. In general, at early times and at long S-D separations, it is remarkable the fact that all the AD models are not distinguishable between each other, with the only exception being S-D = 40mm with CSF<5mm. This implies that the photons reaching the CSF-level delay their way back to the detection side, pushing the variations of the DTOF curve at middle-late timing.
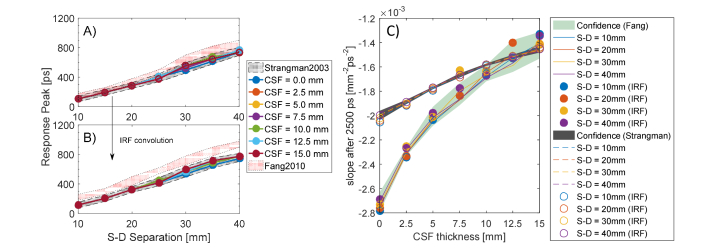
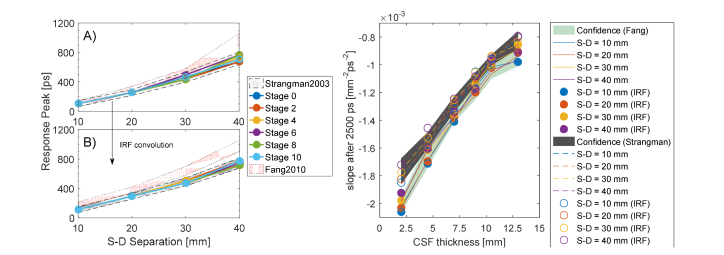
Due to the above reasons, we do not appreciate any visible shift of the response peak (Fig. 7, panel A), which variates at different S-D distances but does not between the ADs and Control models at given interfiber distance. All the DTOF at different CSF thicknesses are practically overlapping: a weak effect starts to appear at longer S-D distances that we do not consider relevant in this study. On the other hand, the effect of the convolution with the IRF is shown in panel B of Fig. 7. In this case, the temporal shift is expressed as the delay in time of the convolved DTOF curve with respect to the IRF peak, located at in the curve or Fig. 6. Like in the ideal case, no perturbation is observed after the convolution while increasing the CSF thickness. The light-red regions in Fig. 7(A)-(B) represent the confidence band of the results obtained by considering a less scattering CSF layer.
Fig. 7.
CSF fingerprints in the cylindrical model. On the left panel A), the peak response delays as a function of the S-D separation and it resulted to be equal for all the CSF thicknesses investigated. On panel B, the corresponding response delay after the convolution with the IRF that introduces a uniform temporal peak-delay. On the right panel C), the changing in the slope of the late photons due to increased CSF thickness.
At middle timing ( to ), the DTOF response is found to be in an intermediate regime, in which photons reflected at a deeper level start to be seen from the detectors. More interesting, instead, is the situation arising from the analysis of late-timing response curve ). At such long times, the photons have the ability to trespass the SS layer and reach the CSF. In this quasi-clear optical environment, light propagates in a nearly-straight fashion and the time of flight increases proportionally to the size of the CSF. At late times, in fact, the variation of the size of the CSF turns into a change in the slope of the DTOF that loses its steepness while thickening the clear layer. This fact is evident in every plot of Fig. 6. Panel C of Fig. 7 reports the slope variation at late-timing due to the increased thickness of the CSF layer (solid line for strong scattering, dashed lines for weaker). We found a steep slope-change at short CSF variation for both the values of the scattering coefficient examined, suggesting higher sensitivity at early BAP. Remarkably, the detection at different S-D separations returns approximately a constant function slope, which we plot as a confidence gray band (and light-green for lower scattering). We conclude that this is a direct feature introduced by the CSF thickness and it might be exploited as a differential measure to estimate the brain shrinkage.
The considerations about the slope measurement arising with a real IRF are even more interesting (Fig. 7 panel C, data presented with filled or empty circles). Even after the convolution, we can appreciate that the slope of the response function still falls into the confidence band. The response of the measurement system, then, is not compromising the possibility to estimate the thickness of the CSF layer, since simulations and realistic measurements (affected by IRF) displayed the same trend.
3.2 Results of BAP in the human-head model
So far, we examined the behavior of an ideal cylindrical layered volume under virtual tr-NIR experiment; but our recent work in continuous wave regime [21] pointed out that the anatomical conformation of the CSF might play an important role in the photon propagation. It is worth to examine any possible shape-induced effect also with time-domain measurements, comparing the results of the cylindrical model with those obtained with more detailed human-head atlas.
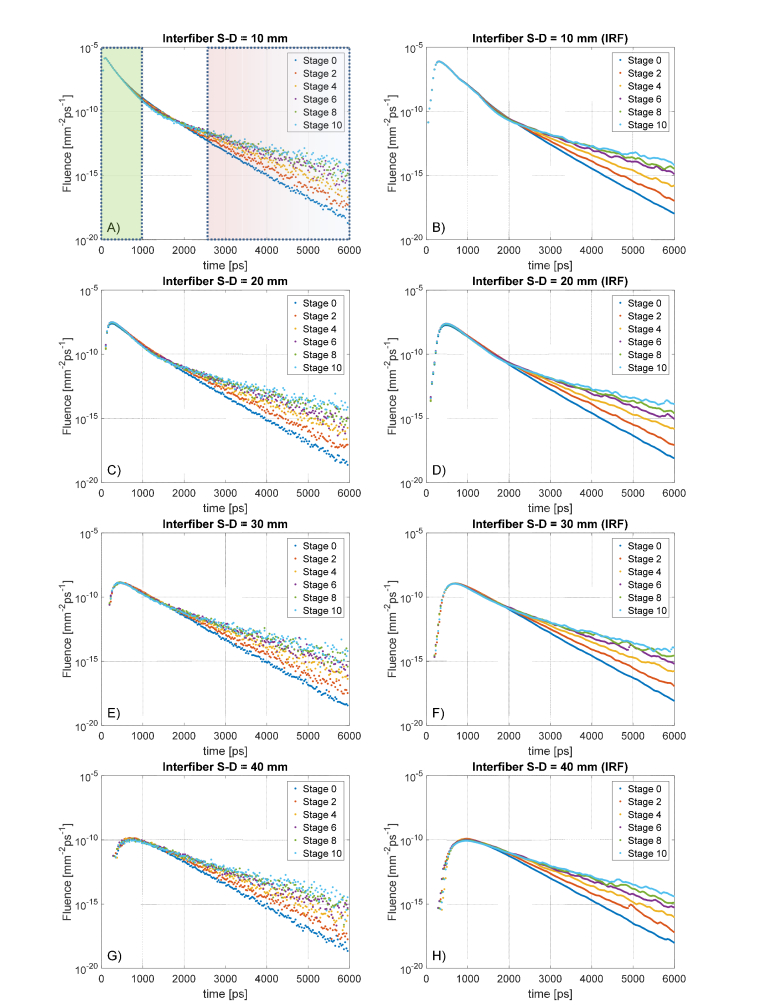
We impinge the same laser source on the right head hemisphere as described in Fig. 4, and we collect the detector responses in the same way we did for the cylindrical phantom. In this case, we cannot sum over detectors located at the same S-D separation due to the not symmetric shape of the human head. We performed the same simulation for every AD model created, but in Fig. 8 we plot only the DTOF obtained for Stage 0, 2, 4, 6, 8 and 10 in order not to compromise the readability of the graphs. For the sake of completeness, we report that the intermediate results followed a continuous trend.
Fig. 8.
DTOF curves at various Source-Detector separations for the human-head models. Compared to that of cylindrical models, the measurements are noisier due to the impossibility of averaging many detector responses for the lack of symmetry in complex geometries. The left column shows the raw data sets, on the right the corresponding convolution with a realistic IRF.
Surprisingly, the situation is pretty similar to what we obtained in the cylindrical models. Also in this case, there is no appreciable shift of the peak response at different CSF thickness, due to the fact that the photons contributing to early-time detections are travelling mostly in the superficial region of the SS tissue. As expected (Fig. 9, panel A), increasing S-D separation progressively delays the signal-peak, while IRF-convolution does not introduce any effect on such delay (panel B). Similarly to what observed in the cylindrical model, the slopes of the DTOF are directly affected by the CSF thickness with approximately uniform sensitivity at every stage of the atrophy progression (Fig. 8, panel C). Interestingly, one order of magnitude change in the optical properties of the clear layer does not vary the sensitivity of the slope-curve, which follows the same trend for both the analyzed (gray and light-green confidence band in panel C). Even if the general results are congruent with those obtained using cylindrical phantoms, the absolute values are different. Most likely this is because the CSF region is now a complex surface with grooves and foldings, which complicates the photon-path if compared to that of normal planar surfaces. Moreover, the relative size of the layers is approximately similar but not exactly matching, leading to different delays in the reflected signal. The convolution with the IRF turned into the same behavior described in the previous paragraph and does not influence the overall slope of the late-timing DTOF curve. This suggests that even in the more realist case of a human head, the chances to appreciate internal CSF variations are not compromised by using a real instrument.
Fig. 9.
Features of the response curves for the Human Head models. A) There is no evident peak shift in the response curves at early detection times as a function of the CSF. The peaks are so close to each other that in the plot all the curves are overlaying each other. B) Even the convolution with the IRF, which shifts up the peak response in time, does not introduce any further visible effect in the measurements. C) Slope variation for late-photons detection as a function of the CSF thickness. In the plot is possible to notice how increased thicknesses of the transparent layer surrounding the brain will affect the reflectance curve, giving useful hints about the possibility to estimate its average thickness.
4. Discussion
As we already discussed throughout the text, AD and other dementia problematics generically involve a variation of the brain-volume due to the neurodegenerative process that leads neurons to commit apoptosis. Although the biological mechanism is not yet clarified, such variations are always connected with the shrinkage of the GM and WM constituting the brain and, in particular, express themselves as a complex change on the brain cerebral cortex. This surface-erosion implies specific modifications, turning into a widening of the grooves and narrowing or the ridges typical of the neuroanatomical structure of the brain. Ventricular cavities are also affected by the neuron-loss connected with the disease, forcing an expansion of their chamber-volume. During the disease progression, the brain is effectively reducing its size inside a fixed braincase and the space left-over is filled with an increased amount of CSF. This is a physiological reaction that tries to preserve the mechanical and immunological functionalities of the CSF surrounding the diseased brain. From a structural point of view, the brain changes its relative mean surface-distance with respect the internal skull-walls, since the neurocranium does not vary appreciably in shape (especially in normal elderly individual). This is functional to the progression of the neurodegenerative process and it is an important parameter for assessing the health condition of a patient. At the moment, the techniques that could give structural information about the dementia progression are limited to the costly and non-portable MRI or to the radiation-exposing XCT. Despite their adequate imaging resolution for the detection of structural changes, time-resolved monitoring of the disease is not yet affordable due to high risks connected with repetitive ionizing radiation or –more in general– with the high cost that such study would imply.
In our work, we tried to tackle the current blindness in longitudinal studies of structural disease evolution by exploring the possibility offered by harmless tr-NIR measurements. To understand the role played by the CSF in the DTOF response curve, we created ad hoc detailed mesh-models that replicate the structural disease evolution in time. The absolute lack of systematic studies of this evolution was updated by the creation of different cylindrical and human-head meshes modelling the disease progression in time. A simplistic study in cylindrical geometries with varying CSF thickness was complemented with the reproduction of an AD model that realistically mimics the brain atrophy, to analyze the role of complex structural conformations. To create these detailed human-head models we took advantage of modern meshing tools [31], which we exploited to implement an erosion algorithm reproducing the brain-shrinkage. We started from the Colin27 model [30], eroding the gray and white matter via an iterative process based on voxelization and and re-meshing the atlases at different stages. With these new human-head structures we do not have the ambition to reproduce an exact model of the AD development: they offer the opportunity to predict a general trend of realistic tr-NIR measurements, keeping an eye at the nature of the BAP. In fact, our erosion method preserves the complex structure of the brain surface, with grooves and ridges evolving similarly to the neurodegeneration in a real individual affected by dementia [2,25,33]. Of course, further details could have been taken into account, such as the modelling of the ventricle size variation, but at the first step of our work there is already a broad spectrum of useful information arising from this study.
Here we tried to obtain general results, parametrizing the CSF with two different scattering coefficients: firstly considering it as a nearly transparent and non-scattering layer [27] then having more turbid optical properties [28]. This is an important test, since tissues’ optical properties might vary among different clinical cases or at various BAP stages: we want to make sure that changes of the scattering coefficient of the CSF do not perturb the generality of the conclusions.
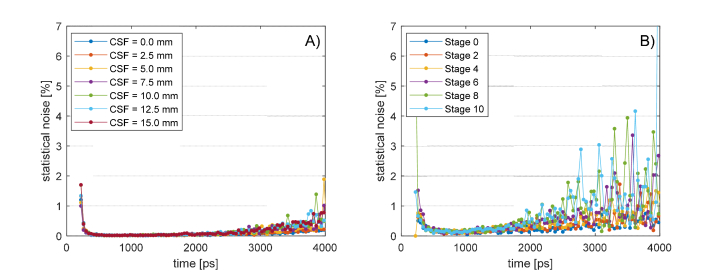
A great number of MC simulations of ideal tr-NIR experiments were run during this study. Each virtual experiment was composed of 10 partial simulations obtained propagating photons, in order to have a sufficient number of DTOFs for statistical analysis. The standard deviation of each curve in Fig. 6 and 8 was divided by their average, obtaining the coefficient of noise-variation of the MC simulation. In Fig. 10 we report the analysis of the curves measured at interfiber distance with Strangman’s parameters, but similar results were obtained at all the S-D separations. In the cylindrical model (panel A) all the simulations are affected by a statistical uncertainty that is always smaller than 5%, while in the human head model (panel B) the noise grows bigger than after . Such a small statistical noise gives enough accuracy for calculating the DTOF slope between and . Interestingly, changing the CSF does not add any visible effect in the noise-trend that seems to be related only to pure measurement conditions rather than geometrical variation. This drives us to the assumption that the MC simulations have the same sensitivity at each BAP stage and all the results that we will discuss in the following are comparable with each other.
Fig. 10.
Statistical noise of the MC simulations until 4000 ps. Coefficient of noise-variation of the standard deviation error with respect the average DTOF curve for the cylindrical model A) and for the human head B). The noise is always below 5% until 4000 ps and does not depend upon CSF variations.
On the other hand, the DTOF curves calculated with the detectors resulted to be sensitive to CSF thickening, but interestingly only few features were influenced by the change of the clear layer. Firstly, we found that increased level of CSF does not introduce any significant peak-shift of the DTOF (Figs. 6-8). Moreover, at early times, all the curves with different CSF thicknesses are very similar to the other making impossible to distinguish them (Figs. 7-9 panels A). Not even the convolution with an experimental IRF modified this trend, thus suggesting that a real measurement would not introduce any unwanted artifact (Figs. 7-9 panels B). These facts indicate that the disease evolution cannot be seen at early photon gating, because the light did not sufficiently explore deeper tissue regions. More interesting is the analysis of late-photons (starting at around ) where the DTOF starts to exhibit a linear decay (in logarithmic scale, Figs. 6-8). In this case, the shrinking of the brain region visibly changes the slope of the detector response (Figs. 7-9 panels C). Higher thicknesses of the clear layer correspond to less steep slopes, suggesting that following its variation could help monitoring the disease evolution or the assessment of its stage. More interestingly, this effect seems not to be affected by the IRF convolution that exactly preserved the slopes (Figs. 6-7 panels A-B), further increasing the chances to use it as biomarker in realistic laboratory measurements. It is worth to notice that the slope –at late gating– does not vary at different interfiber S-D separations, possibly giving the opportunity to consider averaging different response curves in case of noisy measurements.
Remarkably both cylindrical and human models behaved in a similar fashion with respect to the slope variation: increasing the thickness of the CSF flattens the slope of the DTOF at late time gating. On the other hand, our previous work on fluorescence molecular tomography (FMT) [41] shown that the size of the CSF had no role in the photon diffusion process in a cylindrical model. In that case, the models were insensitive to thickness variation, up to the point that the transparent layer could have been neglected without losing accuracy. On the other hand, in a more realistic mouse-like model [42], the inclusion of the CSF affects the simulation output, turning into artifacts that are not possible to normalize [21]. Depending on the geometry of the model and the measurement scheme employed, clear tissues exhibit different behaviors that must be singularly evaluated.
In this study, the trend followed was the same for both the models and the optical parameters: the logarithmic DTOF after followed a linear decay, decreasing its slope steepness while increasing the CSF volume. On average, the absolute difference of the slope variations between the models was around , suggesting that the models were sensitive to the CSF’s structure and to its optical parameters. At this stage, the results clearly demonstrate a significant effect caused by the progressive brain atrophy on the shape of the DTOF. Whether these alterations are detectable or distinguishable from physiological variations in healthy subjects, is yet to be addressed. It is out of the scope of the present study to investigate effective strategies to disentangle healthy from diseased subjects, or at least to longitudinally monitor the very same subject over time. In principle, as compared to other locations as the forearm or the abdomen, the head geometry is rather fixed over time and chances to track internal changes could be viable following the approach proposed.
5. Conclusions
Some remarkable facts emerged from this study. For the first time we approached the problem of the creation of complex human head atlases with variable CSF thickness, mimicking biological tissue variations comparable with that of dementia related diseases. Although complex, the protocol that we followed is quite linear and could be also tuned to describe some more specific brain variations, such as temporal-lobe atrophy (in the FTD) or enlarging ventricular cavities (in the NPH). Moreover, MC photon propagation seems to be the natural choice to perform such study: other approaches would have neglected the presence of the CSF layer [43] or approximated it with radiosity theory [44], inserting unpredictable perturbations to the model. Instead, MC is often considered as a gold standard for the simulation of the photon flux in biological tissues and let us retrieve important information about the effect of CSF in a realistic tr-NIR measurement. Late photons, shown an interesting slope-change in the DTOF that does not depend on the interfiber distance but rather on the CSF thickness itself. If measured in longitudinal studies, such slope change could give precious information about the disease stage and the velocity of its evolution, thus opening new paths towards the understanding of the disease mechanisms. On the other hand, late photon gating () might be difficult to achieve in real systems with acceptable SNR but progresses in the creation of more efficient detectors are pushing this limit further towards late-photon analysis [38]. At the moment, we notice that the convolution with an experimental IRF did not influence the results, thus promising a certain degree of accuracy retained also at experimental level. Of course, further investigations could be done by taking into account other IRFs of various detectors, but this would have exceeded the purpose of this study. The detector considered in the experiment, in fact, is fast compared to the details of the DTOF. However, detectors exhibiting a slowly-decaying tail could influence differently the DTOF at late times. This might worth further investigations in the case of availability of specific hardware, even if the rapid development of detector technology is pushing toward the achievement of faster responsivity. Lastly, results obtained with a realistic head model and with a simpler layered structure were comparable, showing the same trend for the slope-change effect at late gating. Even if quantitatively differing from each other, this reinforces our belief that slope variation is tightly connected with the average CSF thickness rather than local structural conformations.
All these considerations leave us with a promising perspective for the real implementation of this procedure, making our results more general and weakly depending upon exact anatomical surface features. To extract such details in fact, MRI and XCT measurement are still the gold-standard, but hints regarding the CSF thickness-change are likely to be captured also by faster and non-invasive tr-NIR measurements. Although our study is broad, a lot more could be done in the near future, to further investigate the behavior found in our simulations. Not only real experimental tests are on our future plan, but also new simulations are on the way to test different and possibly more accurate methodologies. In fact, it might be worth considering an eventual change of scattering coefficient of the CSF during the disease progression, both in terms of optical turbidity or structural-induced anisotropicity (considering, for example, the arachnoid trabeculae strands present in the subarachnoid space where the CSF circulates). Unfortunately, at the moment there are no dedicated studies supporting this further investigation. Among others, tr-NIR Spectroscopy (tr-NIRS) is a major candidate from which we could extract further information as a function of the wavelength. In particular, seems interesting the exploitation of the complex absorption landscape of the water to obtain a reference curve independent on the CSF thickness. Our goal, in fact, is to open up the possibility of tr-NIRS imaging for neurodegenerative monitoring. For these reasons, we believe our contribution to the biomedical imaging field to be of renewed interest for the dementia-research community. With this work we hope to foster novel strategies for the definition of non-invasive biomarkers, aiming at a better understanding of the dementia diseases and –possibly– towards a better care of the patient.
Acknowledgments
D.A. conceived the idea and defined the research path with A.P. D.A. designed the models and run test simulations. D.A., G.Z., L.S., A.T., A.P. conceptually designed the computational experiment and discussed the results. L.Q. run the simulations, participated in all the discussions and extracted the numerical results. D.A. and L.Q. analyzed the results and discussed possible further investigations. D.A. wrote the manuscript and made the figures, all the authors contributed to correct the manuscript. D.A. friendly thanks Dr. Vincenzo Lagani for helpful suggestions concerning statistical analysis of the data sets.
Funding
“Skin-DOCTor” (1778), implemented under the “ARISTEIA” Action of the “Operational Programme Education and Lifelong Learning” co-funded by the European Social Fund (ESF) and National Resources; EU Marie Curie ITN “OILTEBIA” (PITN-GA-2012-317526); H2020 Laserlab Europe (EC-GA 654148).
Disclosures
The authors declare that there are no conflicts of interest related to this article.
References and links
- 1.“https://www.alz.org/,” 2017.
- 2.Harper L., Barkhof F., Scheltens P., Schott J. M., Fox N. C., “An algorithmic approach to structural imaging in dementia,” J. Neurol. Neurosurg. Psychiatry 85(6), 692–698 (2014). 10.1136/jnnp-2013-306285 [DOI] [PMC free article] [PubMed] [Google Scholar]
- 3.Jack C. R., Jr, Bernstein M. A., Fox N. C., Thompson P., Alexander G., Harvey D., Borowski B., Britson P. J., L Whitwell J., Ward C., Dale A. M., Felmlee J. P., Gunter J. L., Hill D. L., Killiany R., Schuff N., Fox-Bosetti S., Lin C., Studholme C., DeCarli C. S., Krueger G., Ward H. A., Metzger G. J., Scott K. T., Mallozzi R., Blezek D., Levy J., Debbins J. P., Fleisher A. S., Albert M., Green R., Bartzokis G., Glover G., Mugler J., Weiner M. W., “The Alzheimer’s disease neuroimaging initiative (ADNI): MRI methods,” J. Magn. Reson. Imaging 27(4), 685–691 (2008). 10.1002/jmri.21049 [DOI] [PMC free article] [PubMed] [Google Scholar]
- 4.Wang L., Zang Y., He Y., Liang M., Zhang X., Tian L., Wu T., Jiang T., Li K., “Changes in hippocampal connectivity in the early stages of Alzheimer’s disease: evidence from resting state fMRI,” Neuroimage 31(2), 496–504 (2006). 10.1016/j.neuroimage.2005.12.033 [DOI] [PubMed] [Google Scholar]
- 5.Klunk W. E., Engler H., Nordberg A., Wang Y., Blomqvist G., Holt D. P., Bergström M., Savitcheva I., Huang G. F., Estrada S., Ausén B., Debnath M. L., Barletta J., Price J. C., Sandell J., Lopresti B. J., Wall A., Koivisto P., Antoni G., Mathis C. A., Långström B., “Imaging brain amyloid in Alzheimer’s disease with Pittsburgh Compound-B,” Ann. Neurol. 55(3), 306–319 (2004). 10.1002/ana.20009 [DOI] [PubMed] [Google Scholar]
- 6.Clark C. M., Schneider J. A., Bedell B. J., Beach T. G., Bilker W. B., Mintun M. A., Pontecorvo M. J., Hefti F., Carpenter A. P., Flitter M. L., Krautkramer M. J., Kung H. F., Coleman R. E., Doraiswamy P. M., Fleisher A. S., Sabbagh M. N., Sadowsky C. H., Reiman E. P., Zehntner S. P., Skovronsky D. M., “Use of florbetapir-PET for imaging β-amyloid pathology,” JAMA 305(3), 275–283 (2011). 10.1001/jama.2010.2008 [DOI] [PMC free article] [PubMed] [Google Scholar]
- 7.Blennow K., Vanmechelen E., Hampel H., “CSF total tau, Abeta42 and phosphorylated tau protein as biomarkers for Alzheimer’s disease,” Mol. Neurobiol. 24(1-3), 87–97 (2001). 10.1385/MN:24:1-3:087 [DOI] [PubMed] [Google Scholar]
- 8.Masliah E., Mallory M., Alford M., DeTeresa R., Hansen L. A., McKeel D. W., Jr, Morris J. C., “Altered expression of synaptic proteins occurs early during progression of Alzheimer’s disease,” Neurology 56(1), 127–129 (2001). 10.1212/WNL.56.1.127 [DOI] [PubMed] [Google Scholar]
- 9.de Leon M. J., DeSanti S., Zinkowski R., Mehta P. D., Pratico D., Segal S., Clark C., Kerkman D., DeBernardis J., Li J., Lair L., Reisberg B., Tsui W., Rusinek H., “MRI and CSF studies in the early diagnosis of Alzheimer’s disease,” J. Intern. Med. 256(3), 205–223 (2004). 10.1111/j.1365-2796.2004.01381.x [DOI] [PubMed] [Google Scholar]
- 10.Olsson B., Lautner R., Andreasson U., Öhrfelt A., Portelius E., Bjerke M., Hölttä M., Rosén C., Olsson C., Strobel G., Wu E., Dakin K., Petzold M., Blennow K., Zetterberg H., “CSF and blood biomarkers for the diagnosis of Alzheimer’s disease: a systematic review and meta-analysis,” Lancet Neurol. 15(7), 673–684 (2016). 10.1016/S1474-4422(16)00070-3 [DOI] [PubMed] [Google Scholar]
- 11.Selkoe D. J., “Alzheimer’s disease: genes, proteins, and therapy,” Physiol. Rev. 81(2), 741–766 (2001). 10.1152/physrev.2001.81.2.741 [DOI] [PubMed] [Google Scholar]
- 12.Na H. B., Lee J. H., An K., Park Y. I., Park M., Lee I. S., Nam D. H., Kim S. T., Kim S. H., Kim S. W., Lim K. H., Kim K. S., Kim S. O., Hyeon T., “Development of a T1 contrast agent for magnetic resonance imaging using MnO nanoparticles,” Angew. Chem. Int. Ed. Engl. 46(28), 5397–5401 (2007). 10.1002/anie.200604775 [DOI] [PubMed] [Google Scholar]
- 13.Blennow K., Hampel H., “CSF markers for incipient Alzheimer’s disease,” Lancet Neurol. 2(10), 605–613 (2003). 10.1016/S1474-4422(03)00530-1 [DOI] [PubMed] [Google Scholar]
- 14.Burns D. H., Rosendahl S., Bandilla D., Maes O. C., Chertkow H. M., Schipper H. M., “Near-infrared spectroscopy of blood plasma for diagnosis of sporadic Alzheimer’s disease,” J. Alzheimers Dis. 17(2), 391–397 (2009). 10.3233/JAD-2009-1053 [DOI] [PubMed] [Google Scholar]
- 15.Gordon E., Rohrer J. D., Fox N. C., “Advances in neuroimaging in frontotemporal dementia,” J. Neurochem. 138(1 Suppl 1), 193–210 (2016). 10.1111/jnc.13656 [DOI] [PubMed] [Google Scholar]
- 16.C. D. Good, I. S. Johnsrude, J. Ashburner, R. N. Henson, K. J. Fristen and R. S. Frackowiak, “A voxel-based morphometric study of ageing in 465 normal adult human brains,” 5th IEEE EMBS International Summer School on Biomedical Imaging(2002), p. 16. 10.1109/SSBI.2002.1233974 [DOI] [PubMed]
- 17.Silbert L. C., Quinn J. F., Moore M. M., Corbridge E., Ball M. J., Murdoch G., Sexton G., Kaye J. A., “Changes in premorbid brain volume predict Alzheimer’s disease pathology,” Neurology 61(4), 487–492 (2003). 10.1212/01.WNL.0000079053.77227.14 [DOI] [PubMed] [Google Scholar]
- 18.Lin P. Y., Sutin J., Farzam P., Selb J., Cheng F. Y., Ssenyonga P., Mbabazi E., Kimbugwe J., Nalwoga J., Nalule E., Kaaya B., Lin P.-Y., “Noninvasive optical method can predict hydrocephalus treatment and brain outcomes-initial experiences with post-infectious hydrocephalus infants in Uganda,” J. Cereb. Blood Flow Metab. 37, 242–243 (2017). [Google Scholar]
- 19.Okada E., Delpy D. T., “Near-infrared light propagation in an adult head model. II. Effect of superficial tissue thickness on the sensitivity of the near-infrared spectroscopy signal,” Appl. Opt. 42(16), 2915–2922 (2003). 10.1364/AO.42.002915 [DOI] [PubMed] [Google Scholar]
- 20.Yoshitani K., Kawaguchi M., Miura N., Okuno T., Kanoda T., Ohnishi Y., Kuro M., “Effects of hemoglobin concentration, skull thickness, and the area of the cerebrospinal fluid layer on near-infrared spectroscopy measurements,” Anesthesiology 106(3), 458–462 (2007). 10.1097/00000542-200703000-00009 [DOI] [PubMed] [Google Scholar]
- 21.Ancora D., Zacharopoulos A., Ripoll J., Zacharakis G., “Fluorescence diffusion in the presence of optically clear tissues in a mouse head model,” IEEE Trans. Med. Imaging 36(5), 1086–1093 (2017). 10.1109/TMI.2016.2646518 [DOI] [PubMed] [Google Scholar]
- 22.Jack C. R., Jr, Knopman D. S., Jagust W. J., Shaw L. M., Aisen P. S., Weiner M. W., Petersen R. C., Trojanowski J. Q., “Hypothetical model of dynamic biomarkers of the Alzheimer’s pathological cascade,” Lancet Neurol. 9(1), 119–128 (2010). 10.1016/S1474-4422(09)70299-6 [DOI] [PMC free article] [PubMed] [Google Scholar]
- 23.Fang Q., Boas D., “Tetrahedral mesh generation from volumetric binary and gray-scale images,” IEEE International Symposium on Biomedical Imaging: From Nano to Macro, ISBI'09 (2009), pp. 1142–1145. [Google Scholar]
- 24.Fox N. C., Schott J. M., “Imaging cerebral atrophy: normal ageing to Alzheimer’s disease,” Lancet 363(9406), 392–394 (2004). 10.1016/S0140-6736(04)15441-X [DOI] [PubMed] [Google Scholar]
- 25.Yi D. S., Bertoux M., Mioshi E., Hodges J. R., Hornberger M., “Fronto-striatal atrophy correlates of neuropsychiatric dysfunction in frontotemporal dementia (FTD) and Alzheimer’s disease (AD),” Dement. Neuropsychol. 7(1), 75–82 (2013). 10.1590/S1980-57642013DN70100012 [DOI] [PMC free article] [PubMed] [Google Scholar]
- 26.Wang L., Jacques S. L., Zheng L., “MCML-Monte Carlo modeling of light transport in multi-layered tissues,” Comput. Methods Programs Biomed. 47(2), 131–146 (1995). 10.1016/0169-2607(95)01640-F [DOI] [PubMed] [Google Scholar]
- 27.Fang Q., “Mesh-based Monte Carlo method using fast ray-tracing in Plücker coordinates,” Biomed. Opt. Express 1(1), 165–175 (2010). 10.1364/BOE.1.000165 [DOI] [PMC free article] [PubMed] [Google Scholar]
- 28.Strangman G., Franceschini M. A., Boas D. A., “Factors affecting the accuracy of near-infrared spectroscopy concentration calculations for focal changes in oxygenation parameters,” Neuroimage 18(4), 865–879 (2003). 10.1016/S1053-8119(03)00021-1 [DOI] [PubMed] [Google Scholar]
- 29.Selb J., Ogden T. M., Dubb J., Fang Q., Boas D. A., “Comparison of a layered slab and an atlas head model for Monte Carlo fitting of time-domain near-infrared spectroscopy data of the adult head,” J. Biomed. Opt. 19(1), 16010 (2014). 10.1117/1.JBO.19.1.016010 [DOI] [PMC free article] [PubMed] [Google Scholar]
- 30.Collins D. L., Zijdenbos A. P., Kollokian V., Sled J. G., Kabani N. J., Holmes C. J., Evans A. C., “Design and construction of a realistic digital brain phantom,” IEEE Trans. Med. Imaging 17(3), 463–468 (1998). 10.1109/42.712135 [DOI] [PubMed] [Google Scholar]
- 31.Fang Q., Boas D. A., “Tetrahedral mesh generation from volumetric binary and grayscale images,” IEEE International Symposium on Biomedical Imaging: From Nano to Macro, 2009 (ISBI'09) (2009), pp. 1142–1145. [Google Scholar]
- 32.Gonzlez R., Woods R., Digital Image Processing, 2nd ed. (Prentice Hall, 2002). [Google Scholar]
- 33.de Brito-Marques P. R., de Mello R. V., “Amyotrophic lateral sclerosis with dementia. Case report,” Arq. Neuropsiquiatr. 57(2A), 277–283 (1999). 10.1590/S0004-282X1999000200018 [DOI] [PubMed] [Google Scholar]
- 34.Re R., Contini D., Turola M., Spinelli L., Zucchelli L., Caffini M., Cubeddu R., Torricelli A., “Multi-channel medical device for time domain functional near infrared spectroscopy based on wavelength space multiplexing,” Biomed. Opt. Express 4(10), 2231–2246 (2013). 10.1364/BOE.4.002231 [DOI] [PMC free article] [PubMed] [Google Scholar]
- 35.Martelli F., Del Bianco S., Ismaelli A., Zaccanti G., Light Propagation through Biological Tissue (SPIE Press, 2010). [Google Scholar]
- 36.Ripoll J. L., Principles of Diffuse Light Propagation: Light Propagation in Tissues with Applications in Biology and Medicine (World Scientific, 2012). [Google Scholar]
- 37.Jacques S. L., “Monte Carlo modeling of light transport in tissue (steady state and time of flight),” in Optical-thermal Response of Laser-irradiated Tissue (Springer, 2010). [Google Scholar]
- 38.Pifferi A., Contini D., Mora A. D., Farina A., Spinelli L., Torricelli A., “New frontiers in time-domain diffuse optics, a review,” J. Biomed. Opt. 21(9), 091310 (2016). 10.1117/1.JBO.21.9.091310 [DOI] [PubMed] [Google Scholar]
- 39.Strangman G. E., Zhang Q., Li Z., “Scalp and skull influence on near infrared photon propagation in the Colin27 brain template,” Neuroimage 85(Pt 1), 136–149 (2014). 10.1016/j.neuroimage.2013.04.090 [DOI] [PubMed] [Google Scholar]
- 40.Fang Q., Boas D. A., “Monte Carlo simulation of photon migration in 3D turbid media accelerated by graphics processing units,” Opt. Express 17(22), 20178–20190 (2009). 10.1364/OE.17.020178 [DOI] [PMC free article] [PubMed] [Google Scholar]
- 41.Ancora D., Zacharopoulos A., Ripoll J., Zacharakis G., “Light propagation through weakly scattering media. A study of Monte Carlo vs. diffusion theory with application to neuroimaging,” European Conference on Biomedical Optics, p. 95380G, 2015 10.1364/ECBO.2015.95380G [DOI] [Google Scholar]
- 42.Ancora D., Zacharopoulos A., Ripoll J., Zacharakis G., “The role of cerebral spinal fluid in light propagation through the mouse head: Improving fluorescence tomography with Monte Carlo modeling,” Proc. SPIE 9700, 970015 (2016). 10.1117/12.2211423 [DOI] [Google Scholar]
- 43.Leung T. S., Elwell C. E., Delpy D. T., “Estimation of cerebral oxy- and deoxy-haemoglobin concentration changes in a layered adult head model using near-infrared spectroscopy and multivariate statistical analysis,” Phys. Med. Biol. 50(24), 5783–5798 (2005). 10.1088/0031-9155/50/24/002 [DOI] [PubMed] [Google Scholar]
- 44.Arridge S. R., Dehghani H., Schweiger M., Okada E., “The finite element model for the propagation of light in scattering media: a direct method for domains with nonscattering regions,” Med. Phys. 27(1), 252–264 (2000). 10.1118/1.598868 [DOI] [PubMed] [Google Scholar]


