Abstract
Optical methods for imaging and stimulation of biological events based on the use of visible light are limited to the superficial layers of tissue due to the significant absorption and scattering of light. Here, we demonstrate the design and implementation of passive micro-structured lightbulbs (MLBs) containing bright-emitting lanthanide-doped upconverting nanoparticles (UCNPs) for light delivery deep into the tissue. The MLBs are realized as cylindrical pillars made of Parylene C polymer that can be implanted deep into the tissue. The encapsulated UCNPs absorb near-infrared (NIR) light at λ = 980 nm, which undergoes much less absorption than the blue light in the brain tissue, and then locally emit blue light (1G4→3H6 and 1D2→3F4 transitions) that can be used for optogenetic excitation of neurons in the brain. The 3H4→3H6 transition will result in the emission of higher energy NIR photons at λ = 800 nm that can be used for imaging and tracking MLBs through thick tissue.
OCIS codes: (190.7220) Upconversion, (130.3990) Micro-optical devices, (170.0110) Imaging systems
1. Introduction
Optical imaging, via calcium and voltage indicators, and optical stimulation, via optogenetic tools are now established techniques for studying the neural circuits of the brain [1–4]. Most optical tags, and almost all existing opsins have absorption bands in the visible wavelengths; unfortunately, these wavelengths are strongly absorbed and scattered by the brain tissue [1,5]. As a result, spatial resolution degrades dramatically, as does the achievable excitation depth within the brain, limiting most neural studies to the superficial layers of the cortex. To alleviate this problem, implantable light guides or LEDs have been designed to deliver light deeper into the brain [6–10]. However, implantable, tethered light guides can significantly damage the brain. Such optical implants can be used for acute experiments, but the invasive nature of these methods—large size and continuous tethering force—inhibits chronic studies on awake, naturally behaving subjects. In this context, a less invasive optical delivery method capable of reaching deep regions of the brain is crucial.
To circumvent the shallow penetration depths of visible light in the brain, we propose a method that leverages near-infrared (NIR) light to penetrate deep into brain tissue. NIR wavelengths take advantage of the decreasing scattering cross-section of the tissue, which falls off as the wavelength is increased (as λ−4 up to λ-0.5, depending on the scattering regime) as well as the several optical windows at 1200 nm-1400 nm, 1650 nm-1850 nm, 2100 nm- 2250 nm, where brain tissue absorption reaches local minima. The extinction spectrum of light through a fixed coronal brain slice from an adult C57BL/6 mouse (7-10 weeks old) shows that the extinction of light at the excitation wavelength of Channelrhodopsin-2 (ChR-2) (λ = 480 nm) is ~34.5 dB through a 2 mm brain slice, whereas the extinction of NIR light at λ = 1300 nm is only ~7.5 dB [11]. However, since optical reporters and opsins respond primarily to the visible light [1,2], to fully utilize the ability of NIR light to penetrate deep into the brain, we must locally convert it to lower wavelengths after it propagates to the target region. In this work, we demonstrate implantable, tetherless, and passive micro-lightbulbs (MLBs) that can absorb near-infrared light in the optical window and emit visible light locally to stimulate or record neural activity. Such microstructures can be injected into the brain tissue and remain floating with brain micromotions. The presented MLBs are composed of lanthanide-doped upconverting nanocrystals (UCNPs) encapsulated in the biocompatible Parylene C polymer. The efficacy of UCNPs for optogenetic stimulation has recently been demonstrated in situ [12]. The idea uses NIR light at λ = 980 nm to reach deep into the brain tissue and excite UCNP-based MLBs, minimizing tissue absorption while maximizing upconversion efficiency. Herein, we discuss the synthesis of UCNPs optimized for blue light emission and the subsequent fabrication of MLBs. We demonstrate successful imaging of these MLBs through very thick (~2 mm) mouse brain slices. We believe the presented technique can serve as a new and powerful modality for deep brain stimulation and imaging using NIR light in a minimally invasive way.
2. Synthesis of UCNPs for bright blue emission
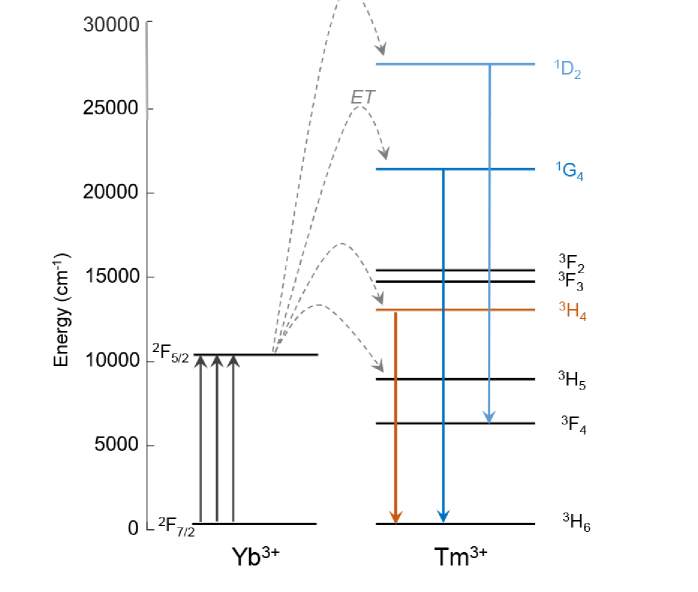
UCNPs exploit the long-lived excited states within the 4f manifolds of the lanthanide ions to efficiently upconvert NIR energies to the visible emissions [13]. This process involves absorptions of two, three, or more NIR photons to progressively excite electrons up the 4f orbital ladder, followed by subsequent Anti-Stokes emission from electronic relaxation down to the ground state or lower excited states (Fig. 1). These nanocrystals offer significant advantages in efficiency and wavelength over existing organic dyes recently used for 3-photon fluorescence imaging at depths exceeding 1 mm [14]. We have recently shown that our 3-photon UCNPs can be orders of magnitude brighter than organics and comparable to conventional 2-photon UCNPs – which themselves are already 5-6 orders of magnitude more efficient than 2-photon fluorescence processes in the best 2-photon dyes, despite the lower excitation energy and near-infrared emission [13].
Fig. 1.
Energy level diagram of trivalent Yb3+ and Tm3+ showing the three primary transitions of interest in Tm3+, 3H4→3H6, 1G4→3H6, and 1D2→3F4 at 800 nm, 474 nm, and 450 nm, respectively.
In this paper, we optimize UCNP emission in the range λ = 450-500 nm, optimal for the excitation of Channelrhodopsins. We utilize Yb3+ as a sensitizer ion (λex = 980 nm, 2F7/2 → 2F5/2) due to its much higher absorption cross-section compared with other lanthanide ions, while Tm3+ is used as the emitter ion due to its 3H4→3H6, 1G4→3H6, and 1D2→3F4 transitions at 800 nm, 474 nm, and 450 nm, respectively (Fig. 1) [15]. The 800 nm emission allows us to image and track the location of MLBs deep within the brain tissue, while the transitions in the blue range of the spectrum can be used to locally excite Channelrhodopsins.
Using the Workstation for Automated Nanomaterials Discovery and Analysis (WANDA), a custom-built robot was designed to automate the combinatorial discovery of new colloidal nanoparticles [16]. We optimized the concentrations of Yb3+and Tm3+ to realize UCNPs for efficient blue emission. As shown in Fig. 2(a), we found that NaYF4 UCNPs alloyed with 40% Yb3+, 20% Gd3+, and 2% Tm3+ produce the brightest two and three photon emissions. This figure shows the measured emission spectrum of thin uniform films of nanocrystals immobilized on a glass substrate, when excited with a continuous wave (CW) laser at λ = 980 nm, with an illumination intensity of 103 W/cm2. As can be seen, 2% Tm3+ particles are much brighter than the other compositions at this input power, in agreement with a previous study [17]. The emission at 800 nm is much more pronounced than the emission at 450 nm, since the 800 nm Anti-Stokes emission is a two-photon process as opposed to the three photons requires to upconvert 980 nm to 450 nm. However, the 800 nm emission can be used to track the MLBs within the brain, since it remains in the NIR-I infrared window. A dilution series of the 2% Tm3+ UCNPs (105x, 106x, and 107x dilutions relative to the stock solution at 10 mg/mL) were prepared and immobilized on the surface of different glass substrates and confocal images were collected at each dilution (50 ms integration time per pixel; excitation laser intensity of 105 W/cm2) (Fig. 2(b)-(d)). These intensity maps at single-UCNP imaging concentration (i.e., 107x dilution) were analyzed as described in previous work [13,18]. Briefly, a 2D Gaussian profile was fitted to the center of each bright spot to obtain the corresponding intensity amplitude at each luminescent spot on the sample. We obtained the histogram showing the frequency of different intensity levels, where a Poissonian distribution was observed, with the modes spaced by integer multiples. The first mode represents the emissions from single UCNPs. After diluting the sample by 107x, we obtained the emission spectrum from single UCNPs using an input laser intensity of 103 W/cm2 at an integration time of 10 s (Fig. 2(e)).
Fig. 2.
a) Upconverted emission spectra comparing different Tm3+ concentrations, keeping Yb3 + = 40%, excited with 980 nm laser at 103 W/cm2 b), c) and d) Confocal scans of UCNPs, 2% Tm3+, excited by a 980 nm laser at 105 W/cm2, 50 ms integration time per pixel for different dilution levels. e) Spectrum of a single UCNP, 2% Tm3+, excited at the same power as a), integrated for 10 s. f) HRTEM image of core/shell 2% Tm3+ showing hexagonal beta-phase and continuous single crystal extending from core to shell domain
The optimized UCNP cores are 12 nm in diameter, and encapsulated by a 4 nm thick NaYF4 shell to avoid deleterious non-radiative surface losses [13,19]. This addition of inert epitaxial shells to UCNPs prevents surface-associated quenching [13] and increases emission so that these 20 nm core/shell nanoparticles have outputs as large as UCNPs ca. 5 times their diameter [18]. Figure 2(f) shows the high-resolution transmission electron microscope (HRTEM) image of core/shell 2% Tm3+ with the hexagonal beta-phase and continuous single crystal extending from core to shell domain.
3. Design and fabrication of UCNP micro-lightbulbs
A certain threshold intensity of light is required to trigger optical processes in the tissue. For example, ChR-2 requires at least 1 mW/mm2 of blue light to evoke action potentials in neurons [2,20]. We therefore need a large concentration of UCNPs at the target locations to generate a high enough intensity of visible light emission. To achieve this concentration, we encapsulated a thick film of UCNPs in microstructures made of Parylene C, a biocompatible polymer. We name these microstructures micro-lightbulbs (MLBs), since they emit visible light when excited with NIR light at λ = 980 nm. These MLBs can be dispersed in artificial cerebrospinal fluid (ACSF) and safely injected into the brain tissue to generate a local high-intensity emission of visible light inside the brain tissue. Parylene C is used as the encapsulating material, since it is biocompatible, can be deposited using a chemical vapor deposition (CVD) method at room temperature, and can be micromachined using a fabrication process that we optimized previously [21,22].
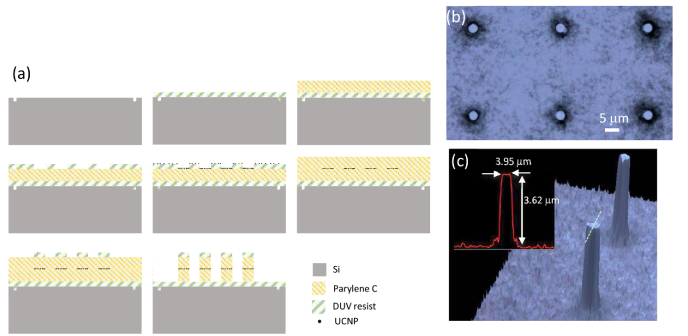
The fabrication process steps are shown in Fig. 3(a). We start with a 150 mm silicon wafer and pattern global alignment marks using DUV lithography and shallow (200 nm) silicon etching. Then we spin coat Dow UV26-3.0 photoresist at 5000 RPM to a thickness of 3.3 μm. Photoresist is then baked at 130C for 60 s on a proximity hot plate. This layer of photoresist is used as a sacrificial layer for the subsequent release of MLBs from the wafer. A layer of Parylene C polymer is then deposited onto the wafer to a thickness of 5 μm at room temperature in a Specialty Coating system (PVD 200). An array of disks each with a diameter of 4 μm is then patterned into a DUV210 resist layer on top of Parylene C using a DUV lithography technique (ASML Stepper 5500/300). The solution of UCNPs dispersed in Toluene is drop coated on the wafer in an equilibrated chamber for ~15 min. Toluene tends to wet the surface of Parylene C much more than the surface of DUV210. As a result, most of the UCNPs dispersed in Toluene are collected into the pits on the Parylene C surface. The equilibrated chamber is then brought to ambient conditions to let the Toluene evaporate. The UCNPs are mostly coated on the exposed Parylene C surface and some residue remains on photoresist. The UV210 resist is then stripped in Acetone to lift off the unwanted UCNPs. In the next step, a thin layer of Parylene C (2 μm) is deposited to cap the UCNP patterns. In a subsequent DUV lithography step, the same pattern of disks is defined in 600 nm layer of DUV210 on top and aligned with the first layer of previously defined disks. A 200 nm layer of aluminum is then deposited using electron beam evaporation and then lifted off as a hardmask on top of the regions with UCNPs. Then we transferred the pattern of such disks onto Parylene C using a dry oxygen plasma etching process to form the pillars that encapsulate UCNPs. These pillars are our desired MLBs that will be finally released from the wafer by dissolving the sacrificial layer underneath. Optical micrograph of an array of these MLBs is shown in Fig. 3(b). Also, the 3D reconstructed confocal microscope image of the MLBs taken using an Olympus LEXT OLS4000 3D Confocal Laser Microscope is shown in Fig. 3(c). This fabrication process based on embedding a thick layer of bright emitting UCNPs in dielectric MLBs enables implementation of arbitrary-shape dielectric MLBs, independently of the shape of the upconverting material.
Fig. 3.
a) The fabrication process to realize MLBs. b) An optical micrograph of UCNP-based MLBs. c) 3D reconstructed confocal images of MLBs.
4. Characterization of MLBs
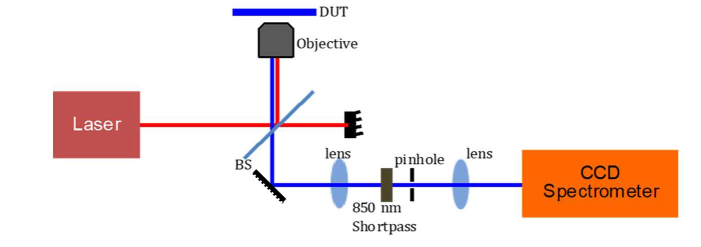
We used a custom-designed inverted confocal microscope to optically characterize the MLBs (Fig. 4). A CW laser diode at λ = 980 nm is used to illuminate the sample. An objective lens (40x, NA = 0.6) is used to focus the beam of light to a diffraction-limited spot with a diameter of 820 nm. The emission is measured in reflection mode, where the pump wavelength is filtered out using a shortpass filter (SP850 with λedge = 850 nm). The emission spectrum can be either routed to a spectrometer or an avalanche photodiode (APD, PDM Series, Micro Photon Devices) using a flip mirror.
Fig. 4.
Schematic of the characterization setup. A custom-designed confocal microscope is coupled to a cooled-CCD spectrometer. The sample (DUT) is held on a precision xy stage equipped with piezoelectric actuators.
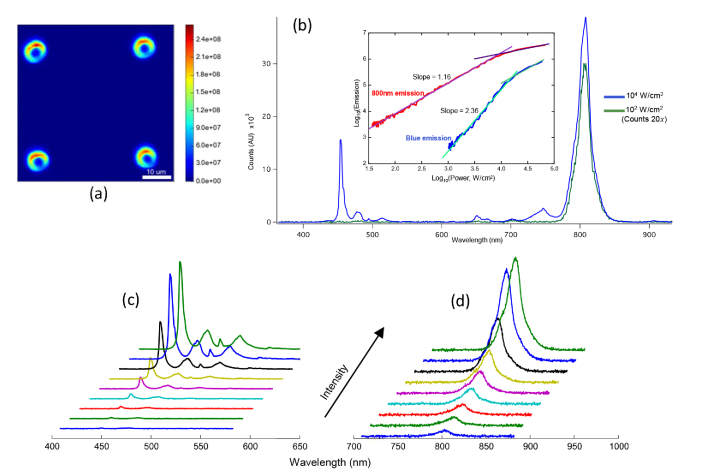
Using this setup, we can both measure the emission spectrum at a single pixel, and also the emission image by integrating the optical power at a single point and moving the sample along x and y directions. The xy stage that is used to hold the sample is equipped with piezoelectric actuators for precise scanning of the sample. A reconstructed image of the emission pattern (filtered in the range of λ = 400-900 nm) from our MLB array measured in air is shown in Fig. 5(a). The emission pattern from each MLB suggests that the UCNPs are more concentrated around the circumference of the pillars, producing a coffee-ring pattern upon drying. The emission intensity spectrum from a micropillar is shown in Fig. 5(b) for two different input intensities. It can be seen that the amplitude and shape of the emission spectrum are both nonlinear functions of input intensity, i.e., I0. For example, at the input intensity of I0 = 102 W/cm2, no blue emission is detected, whereas at I0 = 103 W/cm2, an appreciable amount of blue light emission is measured. To characterize the nonlinear spectral behavior of the emission from MLBs, we used bandpass filters in front of the APD to filter the emission bands centered on λ = 450 nm and λ = 800 nm separately and measured the emission intensities as a function of input intensity. The emission intensity at the blue wavelength (λ = 450 nm) and at the 800 nm emission bands are plotted as a function of the input excitation intensity in the inset of Fig. 5(b). It can be clearly seen that the emission intensities are nonlinear functions of the input light intensity and that saturation occurs at high powers, as expected. Before saturation, the blue emission intensity scales as and the 800 nm emission scales as . The blue emission reaches the saturation regime (Iout = I0~1) at a higher input pump intensity due to the underlying three-photon process, contrasted with the two-photon emission at 800 nm. In essence, the saturation occurs when the intermediate excited states within the 4f lanthanide manifold become full, and thus incoming photons need only excite these intermediate states as opposed to exciting all the way from the ground state.
Fig. 5.
(a) Reconstructed confocal scan of MLB emission filtered in the range of λ = 400-900 nm in air. (b) Upconverted emission power dependence for 3H4→3H6 and (1G4→3H6 + 1D2→3F4) Tm3+ transitions, showing two and three photon dependences, respectively, and characteristic power-dependent saturation at high powers. Blue emission waterfall spectra for excitation intensities of 1.1 × 10³, 1.5 × 10³, 1.8 × 10³, 2.4 × 10³, 3.2 × 10³, 4.2 × 10³, 6.5 × 10³, 9.9 × 10³ and 1.1 × 10⁴ W/cm2 shown in (c) and 800 nm emission spectra for excitation intensities of 102, 1.3 × 10², 1.7 × 10², 2.1 × 10², 3.0 × 10², 3.8 × 10², 5.9 × 10², 8.9 × 10² and 103 W/cm2 shown in (d).
5. Imaging MLBs through brain tissue
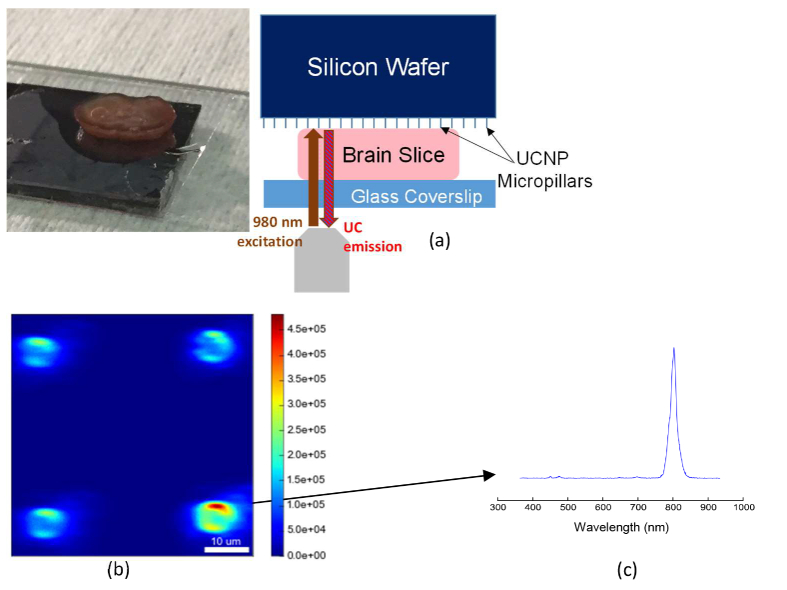
To show the efficacy of our MLBs for local delivery of light deep into the brain tissue, we imaged the MLBs through thick coronal brain slices from a mouse subject. Briefly, adult C57BL/6 mice (7-10 weeks old) were anesthetized with isofluorane and decapitated. Using a vibratome (Leica VT1200 S), coronal brain slices were prepared at different thicknesses (ranging from 150 μm to 2 mm) in a chilled slicing solution consisting of (in mM) 234 sucrose, 11 glucose, 24 NaHCO3, 2.5 KCl, 1.25 NaH2PO4, 10 MgSO4, and 0.5 CaCl2. After brain preparation from the mice, slices were incubated in artificial cerebrospinal fluid (ACSF) containing (in mM): 126 NaCl, 26 NaHCO3, 2.5 KCl, 1.25 NaH2PO4, 1 MgCl2, 2 CaCl2, and 10 glucose and equilibrated with 95% O2 / 5% CO2. Slices were then fixed overnight in 4% paraformaldehyde/1X PBS, and individually placed on the MLB array to image the emission pattern. The measurement arrangement is depicted in Fig. 6(a). Figure 6(b) shows the emission pattern integrated over λ = 400-800 nm through a 2 mm brain slice for a pump intensity of 105 W/cm2. The integration time at each pixel is 10 ms. The emission spectra at a single point on top of a pillar is shown in Fig. 6(c). As expected, the blue emission is highly attenuated through the tissue; however, the NIR emission at λ = 800 nm can pass through the whole thickness of brain tissue.
Fig. 6.
a) Image of a mouse brain slice and the schematic of experiment for imaging through slice. b) Reconstructed confocal scan of MLB array, excited and collected through a 2 mm mouse brain tissue slice. Pillar outlines are clearly visible, with some aberration including elongation along the horizontal direction. c) Spectrum from one MLB collected through 2 mm brain slice.
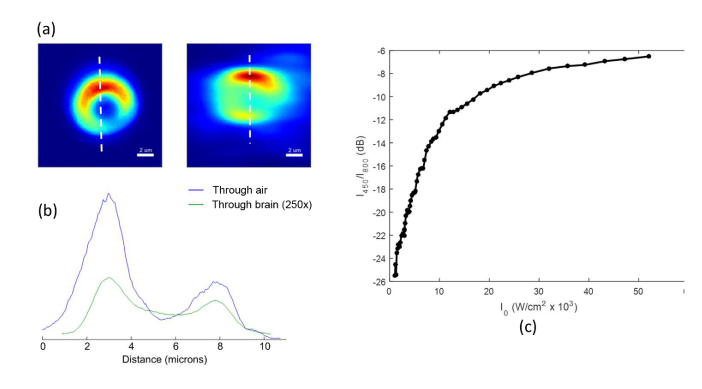
A finer scan of a single MLB in air and also through the brain slice is shown in Fig. 7(a). The line cut profiles show that the image of the MLB is only slightly distorted through the brain slice, yet by taking advantage of the low attenuation of 800 nm NIR light emission band, we are still able to obtain a relatively high-resolution image of the MLB through the 2 mm thickness of brain tissue.
Fig. 7.
(a) Zoomed-in images of MLBs imaged through air (left) and 2 mm brain slice (right). (b) Vertical line-cuts through the in-air (blue) and through-brain (green) scans. The measured intensity through brain slice is multiplied by a scaling factor of 250 for ease of comparison. All scans integrate only the 800 nm emission from UCNPs, excluding the other wavelengths using interference filters. (c) Calibration curve showing the ratio of blue emission to the NIR emission versus excitation power, which is known to be intensity dependent.
It is difficult to measure the blue emission intensity through the brain slice, especially below the input intensity I0 = 103 W/cm2, where the attenuated emission is very weak and falls below the minimum detectable signal of our APD. However, we can use the NIR emission at λ = 800 nm as a proxy measurement of the blue emission. Figure 7(c) plots the ratio (blue emission at λ = 450 nm / NIR emission at λ = 800 nm) against excitation power. Using this calibration curve, we can estimate the local blue emission intensity by measuring the NIR emission intensity coming out of the brain. For example, for the spectrum in Fig. 6(c), we started by using an incident intensity (λ = 980 nm) of 104 W/cm2 when focused at the tissue surface. We then adjusted the focus through the 2 mm thickness of brain tissue until the collected MLB emission was maximized. At this focus, we collected the image and spectrum shown in Fig. 6. The total measured integrated intensity of the 800nm emission peak is ~36,000 counts per second. From the CCD camera manufacturer (Princeton Instruments), we know the camera is calibrated such that 1 count = 8.6 detected photons. Thus, we detect ~310,000 (36,000 × 8.6) photons per second from the 800 nm emission.
The total collection efficiency of our microscope system is approximately 2%. Therefore, we estimate that 15.5 × 10⁶ photons/s (310,000/0.02) are emitted from the sample surface. From the measured transmission spectrum in Fig. 1a of [11], we see that 800 nm light is attenuated ~28x when passing through 2 mm of a mouse brain tissue. Thus, the total estimated 800 nm emission from immediately out of the MLB is 4.34 × 10⁸ photons/s (28 × (15.5 × 106)) when excited by a 980 nm laser focused through 2 mm of tissue. Converting photons to energy (i.e., E = 1.55 eV for 800 nm photons) yields 1.077 × 10⁻¹⁰ W of 800 nm emission from the MLB under these conditions. If we assume the emission originates from the area of our excitation spot, which is smaller than 1 μm2, then the 800 nm emission intensity is ~1.077 × 10⁻¹ mW/mm2 under the above-described excitation conditions.
As noted earlier, we can estimate the intensity of the 450 nm emission by using the known ratio of 450 nm emission to 800 nm emission for these UCNPs plotted in Fig. 7(c), which is dependent on the intensity of the excitation laser at λ = 980 nm. From the transmission spectrum in Fig. 1a of [11], we see that 980 nm light is attenuated by ~12.2x (−10.8 dB) through 2 mm of brain-tissue-like phantom. We thus assume an intensity of 8.2 × 10² W/cm2 of 980 nm light reaches the MLB (based on an incident intensity of 104 W/cm2 when focused at the tissue surface). From Fig. 7(c) we can see that at this excitation intensity, the ratio of blue 450 nm emission to NIR 800 nm emission is −26 dB, or 1/398. Therefore, the estimated intensity of the 450 nm emission immediately out of the MLB is ~2.70 × 10⁻⁴ mW/mm2.
Notably, while blue light at λ = 450 nm undergoes 34.5 dB attenuation in 2 mm of brain tissue, the pump light at λ = 980 nm only undergoes 10.8 dB attenuation [11]. Therefore, starting with the same input intensity, the blue light at λ = 450 nm will undergo 235x more attenuation compared to NIR light at λ = 980 nm through 2 mm thickness of the brain tissue, and therefore, the NIR excitation light can penetrate deeper into the tissue.
6. Discussion and conclusion
In this paper, we demonstrated the implementation of brightly emitting UCNP-based micro-lightbulbs for deep-tissue imaging and excitation. The passive MLBs can be injected into the tissue and are then remotely excited using an external NIR light source that can penetrate deep into the tissue with less absorption and scattering compared to visible light. As a result of upconversion, visible light is locally emitted from the MLBs, which can be used for optogenetic stimulation among other probing techniques. When the incident light reaches the MLBs in the tissue and interacts with MLBs, the absorbed light is upconverted to locally emitted photons at the visible wavelength (Fig. 8). The intensity of local visible light emission (Ie) at the wavelength of interest (i.e., λ = 450 nm) can be obtained as
Fig. 8.
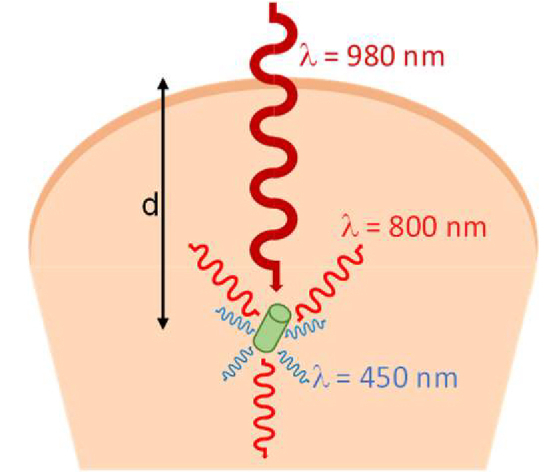
Near-Infrared light incident from the surface of the tissue interacts with the implanted MLBs and upconverts to locally-emitted visible light photons. The overall efficiency of this process depends on the propagation loss of the pump intensity, coupling efficiency of light to the MLBs, conversion efficiency of UCNPs, the number of illuminated UCNP particles, and different enhancement mechanisms (field enhancements and Purcell factor) inside the MLB. The directionality of the emission is also dictated by the shape of the MLB.
| (1) |
where I0 is the input intensity of excitation light at the pump wavelength (i.e., λ = 980 nm), α is the attenuation coefficient of the tissue, d is the distance travelled into the tissue, Cp is the coupling coefficient, Ep is the pump intensity enhancement, η is the conversion efficiency, N is the number density of UCNPs, D(θ, ϕ) is the directivity of emission along the (θ, ϕ) direction, and Ee characterizes the enhancement of the emission intensity.
The attenuation coefficient accounts for absorption as well as scattering of light in the tissue. The coupling coefficient, Cp shows how much of the input light couples to the MLB. If the size of MLB is small enough, this coupling coefficient is obtained from the absorption cross section of MLBs, which depends on the size, shape, and orientation of MLBs with respect to the incident beam of light. Since MLBs will be randomly oriented in tissue, the effective absorption cross section varies from one MLB to the other. One can design geometries such as spheroids to achieve more isotropic coupling independently of the orientation.
One possible modification is to design each MLB to be a whispering gallery microresonator to enhance light emission. If one of the resonance modes of the microresonator coincides with the pump wavelength, the intensity of pump will be enhanced by a factor [23], which significantly enhances the upconversion process due to the nonlinear dependence of η on the local intensity of light at the pump wavelength. While the critical coupling condition can be achieved by focusing free-space light to the vicinity of a whispering gallery resonator [24,25], the coupling of free space light from the surface to the randomly oriented MLBs in the tissue will be challenging and light can only be partially coupled to each MLB, especially if the MLB whispering gallery mode possess a high quality factor (high Q). On the other hand, the internal cavity enhancement of light at pump wavelength scales with Q. Therefore, one needs to optimize Q to achieve the maximum field enhancement at the pump wavelength, while maintaining a reasonable level of input light coupling.
When designing MLBs to operate as a whispering gallery resonator, the UCNPs need to be coated inside the rim of each resonator at the high intensity region to maximize light-UCNP interaction. The shape of the MLBs can be designed to engineer the emission beam profile at the upconverted visible wavelength. A perfectly symmetrical shape (i.e., a sphere), results in an omnidirectional emission. However, the spatial pattern of emission can be altered by changing the shape. For example, in a cylindrical geometry if one facet is coated with a reflecting material, most of the emitted photons will be directed to a preferred direction or if the vertical axis of the cylinder is coated with UCNPs, an extended illumination beam can be achieved. Moreover, a lensed facet can focus the emitted light in the tissue. The directionality of emission pattern is characterized by D(θ, ϕ), which varies along different (θ, ϕ) directions. Ee is the emission enhancement. If the MLB is designed to resonate at the emission wavelength, the emission can be enhanced by a factor Ee. As an example, if the MLB is designed as a high Q whispering gallery resonator, both the pump and the emission can be enhanced if the free spectral range is designed so that two different azimuthal resonance modes happen at the pump and the emission wavelengths. The scattering in the brain tissue affects the Q of MLB resonators, unless if they are coated by a low-index cladding. We have recently shown that if UCNPs are loaded onto polystyrene microspheres and placed in a biological medium without any coating, a quality factor of Q ~1000 can be achieved [26]. While in practice we can achieve higher Qs by coating the microresonators, even such a low Q of bare microspheres can result in a noticeable field enhancement of E = Ep × Ee ~225. The field enhancement enabled by the high Q resonators can enhance the visible light emission flux of MLBs to surpass the ~1 mW/mm2 intensity threshold needed for optogenetic stimulation. Moreover, since the existence of cavity modes increases the density of states, the rate of spontaneous emission from the UCNPs is enhanced by the Purcell factor (Q/V), where V is cavity mode volume. It should be noted that Q is decreased by decreasing V in cylindrical whispering gallery microresonators. Therefore, given the required field enhancement for exciting optical tags, the size of the cavity needs to be optimized to achieve the highest possible Purcell factor. Generally, the design of MLBs can be optimized to tailor the spectral and spatial properties of the pump and the emission by UCNPs.
The use of NIR light allows for deep penetration through tissue. In this paper, we used 980 nm light to locally excite MLBs, maximizing the absorption by the UCNP particles, while maintaining a low level of scattering and absorption in the tissue. Ballistic photons are the primary contributors to the upconversion process, and these photons exponentially decay from the surface of the tissue due to scattering and absorption. While achieving a needed photon flux at a given depth is always possible by increasing the intensity of the excitation source, beyond a certain level, increasing the input intensity would damage the superficial layers of tissue. To alleviate this problem, the excitation laser source can be pulsed. The lifetimes of the UCNP excited states are on the order of 100’s of μsec, allowing the input laser to be pulsed at a repetition rate of higher than 10 kHz, minimizing phototoxicity without affecting upconversion performance. On the other hand, if these MLBs are used to optogenetically excite neurons, given the millisecond time response of usual opsins, only a small number of excitation pulses would be required to evoke action potentials. As a result, the laser pulses only need to be on for a fraction of the time such that the photodamage to the tissue because of the NIR exposure is significantly minimized, while maintaining a reasonably high peak pulse intensity.
A number of recent studies have investigated the viability of living tissue under NIR exposure [11,27]. For example, in a recent work, we have shown that a continuous exposure of mammalian cells to 106 W/cm NIR excitation at 1064 nm for over 2 hours does not result in any measurable level of phototoxicity [11]. While these recent studies show that biological cells are robust to high levels of NIR exposure, here as a conservative estimate for the maximum intensity of the NIR excitation pulses in biological tissue, we calculate the maximum permissible exposure (MPE) for human skin using the thresholds defined in ANSI_Z136.1 [28]. The MPE for human skin in the range of λ = 700-1050 nm is set to be MPE = 1.1 CA × t0.25 (J/cm2) or 1.1 CA × t-0.75 (W/cm2), where CA = 100.002 (λ-700) is a wavelength-dependent correction factor. At the pump wavelength of λ = 980 nm, the correction factor will become CA = 3.6307. For laser pulses at a repetition rate of 10kHz with a duty cycle of 10%, the maximum permissible exposure for each pulse can be obtained as MPE ~2.25 × 10⁴ (W/cm2). Therefore, by pulsing the excitation light and also leveraging micro-cavity field enhancement, the upconverted emission luminescence can be enhanced to trigger optical tags to enable deep-tissue imaging and manipulation.
In this work, we have optimized the chemical composition of our UCNPs to maximize the upconverted blue emission of Tm3+ while exciting the λ = 980 nm transition of the sensitizer Yb+3 ions. We then used these optimized UCNPs to fabricate MLBs in the biocompatible Parylene C polymer. Using this method, we were able to successfully image the MLBs through 2 mm of mouse brain tissue. The NIR excitation light at λ = 980 nm cannot penetrate through the skull. As a result, the presented method can be used for optogenetic stimulation from the surface of the brain through cranial windows. In future, to further increase the penetration depth and potentially enable passing through skull, UCNPs can be optimized for excitation at even longer IR wavelengths using the lower-energy IR transitions of Tm3+. For example, it was recently shown that by using an excitation wavelength of λ = 1280 nm, two-photon imaging could be made possible at a depth of 1.6 mm into a mouse cortex [29].
Our results demonstrate the possibility of targeted deep tissue imaging and optical stimulation using the proposed upconverting micro-lightbulbs. This concept can be extended to generate arbitrary beam shapes at any desired visible wavelength through optimizing the various modular components of UCNP MLBs.
Acknowledgments
Work at the Molecular Foundry was supported by the Office of Science, Office of Basic Energy Sciences, of the U.S. Department of Energy. Portions of this research were supported by the Global Research Laboratory (GRL) Program through the National Research Foundation of Korea (NRF) funded by the Ministry of Science and ICT.
M.M.M. is a Chan Zuckerberg Biohub investigator.
D.J.G. was supported by the National Science Foundation SAGE IGERT fellowship.
Funding
The UCB/UCSF/LBNL BRAINSeed award; Office of Science, Office of Basic Energy Sciences, of the U.S. Department of Energy (DE-AC02-05CH11231); Ministry of Science and ICT (no. 2016911815).
Disclosures
The authors declare that there are no conflicts of interest related to this article.
References and links
- 1.Deisseroth K., “Optogenetics,” Nat. Methods 8(1), 26–29 (2011). 10.1038/nmeth.f.324 [DOI] [PMC free article] [PubMed] [Google Scholar]
- 2.Boyden E. S., “A history of optogenetics: the development of tools for controlling brain circuits with light,” F1000 Biol. Rep. 3, 11 (2011). 10.3410/B3-11 [DOI] [PMC free article] [PubMed] [Google Scholar]
- 3.Baker B. J., Kosmidis E. K., Vucinic D., Falk C. X., Cohen L. B., Djurisic M., Zecevic D., “Imaging brain activity with voltage- and calcium-sensitive dyes,” Cell. Mol. Neurobiol. 25(2), 245–282 (2005). 10.1007/s10571-005-3059-6 [DOI] [PMC free article] [PubMed] [Google Scholar]
- 4.Djurisic M., Zochowski M., Wachowiak M., Falk C. X., Cohen L. B., Zecevic D., “Optical monitoring of neural activity using voltage-sensitive dyes,” Methods Enzymol. 361(17), 423–451 (2003). 10.1016/S0076-6879(03)61022-0 [DOI] [PubMed] [Google Scholar]
- 5.Yang L., Miklavcic S. J., “Revised Kubelka-Munk theory. III. A general theory of light propagation in scattering and absorptive media,” J. Opt. Soc. Am. A 22(9), 1866–1873 (2005). 10.1364/JOSAA.22.001866 [DOI] [PubMed] [Google Scholar]
- 6.Zorzos A. N., Scholvin J., Boyden E. S., Fonstad C. G., “Three-dimensional multiwaveguide probe array for light delivery to distributed brain circuits,” Opt. Lett. 37(23), 4841–4843 (2012). 10.1364/OL.37.004841 [DOI] [PMC free article] [PubMed] [Google Scholar]
- 7.Wu F., Stark E., Im M., Cho I.-J., Yoon E.-S., Buzsáki G., Wise K. D., Yoon E., “An implantable neural probe with monolithically integrated dielectric waveguide and recording electrodes for optogenetics applications,” J. Neural Eng. 10(5), 056012 (2013). 10.1088/1741-2560/10/5/056012 [DOI] [PMC free article] [PubMed] [Google Scholar]
- 8.Abaya T. V. F., Blair S., Tathireddy P., Rieth L., Solzbacher F., “A 3D glass optrode array for optical neural stimulation,” Biomed. Opt. Express 3(12), 3087–3104 (2012). 10.1364/BOE.3.003087 [DOI] [PMC free article] [PubMed] [Google Scholar]
- 9.Zorzos A. N., Boyden E. S., Fonstad C. G., “Multiwaveguide implantable probe for light delivery to sets of distributed brain targets,” Opt. Lett. 35(24), 4133–4135 (2010). 10.1364/OL.35.004133 [DOI] [PMC free article] [PubMed] [Google Scholar]
- 10.M. Chamanzar, M. Borysov, M. Maharbiz, and T. Blanche, “High-Density Optrodes for Multi-Scale Electrophysiology and Optogenetic Stimulation,” in IEEE EMBS (2014). [DOI] [PubMed] [Google Scholar]
- 11.Levy E. S., Tajon C. A., Bischof T. S., Iafrati J., Fernandez-Bravo A., Garfield D. J., Chamanzar M., Maharbiz M. M., Sohal V. S., Schuck P. J., Cohen B. E., Chan E. M., “Energy-Looping Nanoparticles: Harnessing Excited-State Absorption for Deep-Tissue Imaging,” ACS Nano 10(9), 8423–8433 (2016). 10.1021/acsnano.6b03288 [DOI] [PubMed] [Google Scholar]
- 12.Wu X., Zhang Y., Takle K., Bilsel O., Li Z., Lee H., Zhang Z., Li D., Fan W., Duan C., Chan E. M., Lois C., Xiang Y., Han G., “Dye-Sensitized Core/Active Shell Upconversion Nanoparticles for Optogenetics and Bioimaging Applications,” ACS Nano 10(1), 1060–1066 (2016). 10.1021/acsnano.5b06383 [DOI] [PMC free article] [PubMed] [Google Scholar]
- 13.Gargas D. J., Chan E. M., Ostrowski A. D., Aloni S., Altoe M. V. P., Barnard E. S., Sanii B., Urban J. J., Milliron D. J., Cohen B. E., Schuck P. J., “Engineering bright sub-10-nm upconverting nanocrystals for single-molecule imaging,” Nat. Nanotechnol. 9(4), 300–305 (2014). 10.1038/nnano.2014.29 [DOI] [PubMed] [Google Scholar]
- 14.Horton N. G., Wang K., Kobat D., Clark C. G., Wise F. W., Schaffer C. B., Xu C., “In vivo three-photon microscopy of subcortical structures within an intact mouse brain,” Nat. Photonics 7(3), 205–209 (2013). 10.1038/nphoton.2012.336 [DOI] [PMC free article] [PubMed] [Google Scholar]
- 15.Park Y. I., Lee K. T., Suh Y. D., Hyeon T., “Upconverting nanoparticles: a versatile platform for wide-field two-photon microscopy and multi-modal in vivo imaging,” Chem. Soc. Rev. 44(6), 1302–1317 (2015). 10.1039/C4CS00173G [DOI] [PubMed] [Google Scholar]
- 16.Chan E. M., Xu C., Mao A. W., Han G., Owen J. S., Cohen B. E., Milliron D. J., “Reproducible, high-throughput synthesis of colloidal nanocrystals for optimization in multidimensional parameter space,” Nano Lett. 10(5), 1874–1885 (2010). 10.1021/nl100669s [DOI] [PubMed] [Google Scholar]
- 17.Zhao J., Jin D., Schartner E. P., Lu Y., Liu Y., Zvyagin A. V., Zhang L., Dawes J. M., Xi P., Piper J. A., Goldys E. M., Monro T. M., “Single-nanocrystal sensitivity achieved by enhanced upconversion luminescence,” Nat. Nanotechnol. 8(10), 729–734 (2013). 10.1038/nnano.2013.171 [DOI] [PubMed] [Google Scholar]
- 18.Ostrowski A. D., Chan E. M., Gargas D. J., Katz E. M., Han G., Schuck P. J., Milliron D. J., Cohen B. E., “Controlled synthesis and single-particle imaging of bright, sub-10 nm lanthanide-doped upconverting nanocrystals,” ACS Nano 6(3), 2686–2692 (2012). 10.1021/nn3000737 [DOI] [PubMed] [Google Scholar]
- 19.Johnson N. J. J., He S., Diao S., Chan E. M., Dai H., Almutairi A., “Direct evidence for coupled surface and concentration quenching dynamics in lanthanide-doped nanocrystals,” J. Am. Chem. Soc. 139(8), 3275–3282 (2017). 10.1021/jacs.7b00223 [DOI] [PubMed] [Google Scholar]
- 20.Pashaie R., Anikeeva P., Lee J. H., Prakash R., Yizhar O., Prigge M., Chander D., Richner T. J., Williams J., “Optogenetic brain interfaces,” IEEE Rev. Biomed. Eng. 7, 3–30 (2014). 10.1109/RBME.2013.2294796 [DOI] [PubMed] [Google Scholar]
- 21.Ledochowitsch P., Olivero E., Blanche T., Maharbiz M. M., “A transparent μECoG array for simultaneous recording and optogenetic stimulation,” Conf. Proc. IEEE Eng. Med. Biol. Soc. 2011, 2937–2940 (2011). [DOI] [PubMed] [Google Scholar]
- 22.Muller R., Le H.-P., Li W., Ledochowitsch P., Gambini S., Bjorninen T., Koralek A., Carmena J. M., Maharbiz M. M., Alon E., Rabaey J. M., “24.1 A miniaturized 64-channel 225μW wireless electrocorticographic neural sensor,” in 2014 IEEE International Solid-State Circuits Conference Digest of Technical Papers (ISSCC) (IEEE, 2014), pp. 412–413. 10.1109/ISSCC.2014.6757492 [DOI] [Google Scholar]
- 23.Soltani M., Yegnanarayanan S., Adibi A., “Ultra-high Q planar silicon microdisk resonators for chip-scale silicon photonics,” Opt. Express 15(8), 4694–4704 (2007). 10.1364/OE.15.004694 [DOI] [PubMed] [Google Scholar]
- 24.Zhu J., Özdemir Ş. K., Yilmaz H., Peng B., Dong M., Tomes M., Carmon T., Yang L., “Interfacing whispering-gallery microresonators and free space light with cavity enhanced Rayleigh scattering,” Sci. Rep. 4(1), 6396 (2014). 10.1038/srep06396 [DOI] [PMC free article] [PubMed] [Google Scholar]
- 25.Zou C.-L., Shu F.-J., Sun F.-W., Gong Z.-J., Han Z.-F., Guo G.-C., “Theory of free space coupling to high-Q whispering gallery modes,” Opt. Express 21(8), 9982–9995 (2013). 10.1364/OE.21.009982 [DOI] [PubMed] [Google Scholar]
- 26.Fernandez-Bravo A., Yao K., Barnard E. S., Borys N. J., Levy E. S., Tian B., Tajon C. A., Moretti L., Altoe M. V., Aloni S., Beketayev K., Scotognella F., Cohen B. E., Chan E. M., Schuck P. J., “Continuous-wave upconverting nanoparticle microlasers,” Nat. Nanotechnol. 13(7), 572–577 (2018). 10.1038/s41565-018-0161-8 [DOI] [PubMed] [Google Scholar]
- 27.Zhong M.-C., Wei X.-B., Zhou J.-H., Wang Z.-Q., Li Y.-M., “Trapping red blood cells in living animals using optical tweezers,” Nat. Commun. 4(1), 1768 (2013). 10.1038/ncomms2786 [DOI] [PubMed] [Google Scholar]
- 28.American National Standards Institute, “American National Standard for the Safe Use of Lasers, ANSI Z136.1”. National Standards Institute, New York (2014). [Google Scholar]
- 29.Kobat D., Horton N. G., Xu C., “In vivo two-photon microscopy to 1.6-mm depth in mouse cortex,” J. Biomed. Opt. 16(10), 106014 (2011). 10.1117/1.3646209 [DOI] [PubMed] [Google Scholar]


