

Abstract
Nanosized titanium dioxide (TiO2) is a common additive in food and cosmetic products. The goal of this study was to investigate if TiO2 nanoparticles affect intestinal epithelial tissues, normal intestinal function, or metabolic homeostasis using in vitro and in vivo methods. An in vitro model of intestinal epithelial tissue was created by seeding co-cultures of Caco-2 and HT29-MTX cells on a Transwell permeable support. These experiments were repeated with monolayers that had been cultured with the beneficial commensal bacteria Lactobacillus rhamnosus GG (L. rhamnosus). Glucose uptake and transport in the presence of TiO2 nanoparticles was assessed using fluorescent glucose analog 2-(N-(7-Nitrobenz-2-oxa-1,3-diazol-4-yl)Amino)-2-Deoxyglucose (2-NBDG). When the cell monolayers were exposed to physiologically relevant doses of TiO2, a statistically significant reduction in glucose transport was observed. These differences in glucose absorption were eliminated in the presence of beneficial bacteria. The decrease in glucose absorption was caused by damage to intestinal microvilli, which decreased the surface area available for absorption. Damage to microvilli was ameliorated in the presence of L. rhamnosus. Complimentary studies in Drosophila melanogaster showed that TiO2 ingestion resulted in decreased body size and glucose content. The results suggest that TiO2 nanoparticles alter glucose transport across the intestinal epithelium, and that TiO2 nanoparticle ingestion may have physiological consequences.
Keywords: GI tract, glucose, Caco-2, Lactobacillus rhamnosus, microbiome
INTRODUCTION
The average American is estimated to consume 1012 - 1014 nanoparticles per day (Lomer, Thompson and Powell, 2002). Of these nanoparticles, titanium dioxide (TiO2) is most commonly ingested due to its use primarily as a whitening agent, and anti-caking food additive (Weir, Westerhoff, Fabricius, Hristovski and von Goetz, 2012). Production of TiO2 in 2009 was estimated to reach 4 million metric tons, although only a small portion of the market, ~4%, consisted of nanoparticles (<100nm in diameter). However, estimates suggest that by 2025 the industry will be converted to exclusively nanoscale TiO2 (Robichaud, Uyar, Darby, Zucker and Wiesner, 2009). The appeal of nanoscale TiO2 is attributed to the increased surface area to volume ratio of the nanoparticles, as this leads to increased surface energy and higher particle reactivity. The amplified surface reactivity of nanoparticles may cause interactions with biological molecules such as DNA, proteins, and cell membranes (Xia, Li and Nel, 2009), and their diverse properties make general assessments of their toxicity difficult (Maynard, 2006). At high doses, nano-TiO2 has been shown to induce systemic toxicity (Wang, Zhou, Chen, Yu, Wang, Ma, Jia, Gao, Li, Sun, Li, Jiao, Zhao and Chai, 2007). The highest concentrations of TiO2 in foods, normalized to serving size, are found in candies and sweets that have a powdery coating or white icing, including foods such as powdered donuts, chewing gum, or chocolates. The effect of this distribution is so dramatic that the rate of exposure to TiO2 in children is increased with respect to that of adults due to children’s higher consumption of sweets. Weir et al. (2012) used statistical consumer intake data from the National Diet and Nutrition Survey in the UK to model exposure to TiO2 by age group. While adults and adolescents in the US over the age of 10 generally have an exposure of 0.2–0.7 mg TiO2/kg bodyweight/day, children under the age of 10 in the US are exposed to 1–2 mg/kg bodyweight/day. In addition to food products, TiO2 can also often be found in personal care products, such as sunscreens and cosmetics (Weir, Westerhoff, Fabricius, Hristovski and von Goetz, 2012). While there is little evidence that TiO2 can be absorbed through the skin, accidental ingestion is a possibility with toothpastes, for example, where TiO2 content is as high as 0.5% by weight (Cho, Kang, Lee, Jeong, Che and Seok, 2013). In some generic brands of aspirin, specifically those advertised with a safety coating, levels as high as 10μg titanium/mg were found (Cho, Kang, Lee, Jeong, Che and Seok, 2013). Taken together, the ubiquity of the additive means that some level of exposure to TiO2 is nearly unavoidable for individuals in Western societies.
The small intestine is the primary site for nutrient absorption in the human body and is composed of a complex environment of bacteria and intestinal cells (Chow, Lee, Shen, Khosravi and Mazmanian, 2010). The epithelium consists of a monolayer of primarily absorptive enterocytes that transport nutrients from the lumen of the gut into the blood stream, and goblet cells that secrete mucus into the lumen of the small intestine (Wikman-Larhed and Artursson, 1995). The gut microbiome consists of bacteria from at least 17 different phyla (Ley, Hamady, Lozupone, Turnbaugh, Ramey, Bircher, Schlegel, Tucker, Schrenzel, Knight and Gordon, 2008). This complex ecosystem covers nearly the entire surface of the human gastrointestinal tract and is known to serve metabolic (recovery of absorbable nutrients), trophic (control of epithelial cell proliferation and differentiation, homoeostasis of the immune system), and protective (protection against foreign pathogens) functions (Guarner and Malagelada, 2003). In vitro, bacterial cultures have been shown to be sensitive to nanomaterials (Dizaj, Lotfipour, Barzegar-Jalali, Zarrintan and Adibkia, 2014), but studies to determine the effects of nanoparticles on the gut microbiome are inconsistent (Fondevila, Herrer, Casallas, Abecia and Ducha, 2009, Bergin, Wilding, Morishita, Walacavage, Ault and Axson, 2016, Chen, Zhao, Wang, Cai, Zheng, Wang, Wang, Ouyang, Zhou, Chai, Zhao and Feng, 2017, Hadrup, Loeschner, Bergstrom, Wilcks, Gao and Vogel, 2012).
Drosophila melanogaster (D. melanogaster) is a model toxicology system to study genetic and environmental contributions to changes in gut function and susceptibility to metabolic disorders. Many of the major metabolic homeostasis pathways (e.g. insulin signaling; nutrient- and insulin-sensing mammalian target of rapamycin or mTOR pathway) are well conserved between humans and flies (Leopold and Perrimon, 2007, Baker and Thummel, 2007) and D. melanogaster’s relatively simple gut microbiome, which is composed of four or five common families, has been shown to influence metabolic homeostasis (Storelli, Defaye, Erkosar, Hols, Royet and Leulier, 2011, Shin, Kim, You, Kim, Kim, Lee, Yoon, Ryu and Lee, 2011, Ridley, Wong, Westmiller and Douglas, 2012).
The goal of this work is to investigate the interaction between nanoparticle exposure, beneficial bacterial populations, and intestinal function. An in vitro cell culture model of the small intestinal epithelium was used to characterize the interactions between physiological doses of TiO2 nanoparticles, Lactobacillus rhamnosus GG (L. rhamnosus), and intestinal epithelial cells. Data shows that TiO2 nanomaterials damage the intestinal epithelial cells and impact glucose transport, but the presence of beneficial bacteria mitigates these effects. To compliment the in vitro model, experiments were performed with D. melanogaster which has a gut much like the human gut. Dietary supplementation with TiO2 nanoparticles reduced growth and glucose levels in the flies, in addition to affecting overall pupation, pupation time, and time to emergence; which is consistent with an impairment in gut function.
MATERIALS AND METHODS
Materials.
All chemicals, enzymes, and hormones were purchased from Sigma Aldrich (St. Louis, MO) unless otherwise stated.
Nanoparticle dose.
TiO2 doses were based on the work of Weir et al. (2012), who have estimated that the average Western adult consumes 0.2–1 mg/kg/day of TiO2 and that the TiO2 content of over 100 different food items ranged from 7.7·10−5 to 0.359% with an average of 0.0579% (Weir, Westerhoff, Fabricius, Hristovski and von Goetz, 2012). A 1 mg TiO2/kg/day consumption by a 70 kg adult (Brown, Delp, Lindstedt, Rhomberg and Beliles, 1997) is 70 mg of TiO2 consumed per day. Weir et al. (2012) have estimated that 36% of the TiO2 consumed is nanosized (Weir, Westerhoff, Fabricius, Hristovski and von Goetz, 2012), meaning that approximately 25 mg nano-TiO2 is consumed daily.
For all in vitro nanoparticle exposures, a concentration of 1.4 × 10⁻⁴ mg/mL 30 nm TiO2 (anatase, US3498US, Research Nanomaterials, Inc, Houston, TX) was used. This is equivalent to the high dose used in previous work (Guo, Martucci, Moreno-Olivas, Tako and Mahler, 2017). Briefly, 1.4 × 10⁻⁴ mg/mL 30 nm TiO2 nanoparticles is 2 × 10⁹ particles/mL. When 100 μL is added to a 0.33 cm2 Transwell insert, the cells are exposed to 2 × 10⁸ particles/cm2. The total surface area of the human small intestine is approximately 2 × 106 cm2 (DeSesso and Jacobson, 2001). Consuming 25 mg of nano-TiO2 would result in an exposure of 2 × 10⁸ particles/cm2 to the human small intestine.
The concentrations used in vivo (5, 50, and 500 ppm or 0.0005, 0.005 and 0.05%) fall within the range of TiO2 NP concentrations found in commonly ingested products (Weir, Westerhoff, Fabricius, Hristovski and von Goetz, 2012). If the nano-TiO2 concentration in all food consumed is considered approximately 5 lbs, or 2,267,960 mg of food is eaten daily (U.S. Department of Agriculture and Office of Communications, 2003), meaning that the nano-TiO2 concentration in food is 25 mg/2,267,960 mg = 11 × 10−6 or ~10 ppM, which falls between our low and medium in vivo doses. The 5 ppm, 50 ppm, and 500 ppm in vivo doses are therefore equivalent to daily consumption of approximately 10 mg, 100 mg, or 1000 mg of nano-TiO2 within 5 lbs of food. As stated by Weir et al. (2012), exposure to TiO2 depends on dietary habits, and in some cases can reach several hundred milligrams per day (Weir, Westerhoff, Fabricius, Hristovski and von Goetz, 2012). In vitro exposures equivalent to an adult consuming 25 mg, and in vivo exposures equivalent to ingestion of 10–1000 mg are therefore physiologically relevant.
Nanoparticle characterization.
Scanning electron microscopy (SEM, Supra 55 VP, Zeiss, Thornwood, NY) was performed to obtain the dry TiO2 particle size and morphology (30 nm anatase, US Research Nanomaterials, Inc). TiO2 NPs were loaded onto a PELCO SEMClip™ specimen mount (Ted Pella, Inc., Redding, CA) and coated with 10 nm carbon. Samples were imaged at 100,000X and 300,000X magnification and 2000 eV. The primary size and morphology of nano-TiO2 in 18 MΩ water and serum-free DMEM was evaluated using transmission electron microscopy (TEM, JEM-2100F, JEOL, Peabody, MA). Samples were diluted to 1.4×10⁻³ mg/ml from a stock dispersion of 14 mg/ml. Samples were then placed in an ultrasonic bath (VWR Symphony, VWR, Radnor, PA) for 30 minutes. A drop of sample was loaded onto an ultrathin 400 mesh copper TEM grid (Ted Pella, Inc) with a plastic transfer pipette. The grids were allowed to air-dry overnight before imaging. TEM imaging concentrations were higher than those used in cell culture experiments due to difficulty finding NP on the grids with lower concentrations. Electrophoretic dynamic light scattering (DLS, Zetasizer Nano ZS, Malvern Instruments Inc., Southborough, MA) was used to measure zeta potential and hydrodynamic size of the nanoparticles. Stock nanoparticles were diluted in 18 MΩ water or serum free DMEM, placed in an ultrasonic bath for 30 minutes, and then 1 mL was transferred to a Malvern capillary cell for DLS measurements. For all fluorescent and colorimetric assays a TiO2 NP-only control was measured to assess for NP interference with the assay. There were no significant changes in fluorescent or colorimetric assays due to the presence of TiO2 NP.
Mammalian Cell Culture.
The human colon carcinoma Caco-2 cell line was obtained from the American Type Culture Collection (ATCC, Manassas, VA). The HT29-MTX cell line was kindly provided by Dr. Thécla Lesuffleur of INSERM U560 in Lille, France (Lesuffleur, Barbat, Dussaulx and Zweibaum, 1990). Cells were grown in Dulbecco’s Modified Eagle Medium (DMEM, ThermoFisher Scientific, Waltham, MA) containing 4.5 g/L glucose and 10% heat inactivated fetal bovine serum (FBS, ThermoFisher Scientific). The cells were maintained at 37°C in 5% CO2. For the in vitro intestinal epithelial model Caco-2 and HT29-MTX cells were seeded at a density of 100,000 cells/cm2 onto polycarbonate, 0.4 μm pore size, 0.33cm2 Transwell inserts (Corning Life Sciences, Corning, NY) or 50,000 cells/cm2 onto 24 well plates (Corning) coated with rat tail Type I collagen (BD Biosciences, San Jose, CA) at 8 μg/cm2. Cells were seeded at a ratio of 3:1 Caco-2 to HT29-MTX, respectively, as this ratio has previously been shown to result in a mucus layer that is 2–10 μm thick and completely covers the cell monolayer (Mahler, Shuler and Glahn, 2009). All experiments were performed 14 days after initial cell seeding in serum-free, glucose-free, and phenol-red free DMEM (ThermoFisher Scientific).
Bacterial Cell Culture.
L. rhamnosus GG was purchased from American Type Culture Collection (ATCC). Cells were inoculated into 10 mL MRS broth (Difco™, Franklin Lakes, NJ) and grown overnight at 37°C and 5% CO2. To determine bacterial concentration from optical density, the stock solution of L. rhamnosus was serially diluted and plated at 37°C in 5% CO2 on MRS agar (Difco™, Franklin Lakes, NJ). Optical density of each of the dilutions was read at the absorbance wavelength of 600nm. Colony forming units (CFU) of bacteria at each dilution were counted following 24 hours of incubation and a growth curve was created correlating absorbance with concentration in CFU/mL. For each experiment growth curves were formulated the day prior to bacterial exposure and cells were inoculated in the same manner used to create the initial stock solution for the creation of growth curves.
Viability Assays.
Mammalian cell viability in the presence of L. rhamnosus was measured by exposing Caco-2/HT29-MTX monolayers cultured in 24 well plates to 102, 103, 104, or 105 CFU/mL L. rhamnosus in serum-free, glucose-free, and phenol-red free DMEM (ThermoFisher Scientific) for 4 hours. After the 4 hour exposure DMEM containing L. rhamnosus was aspirated and monolayers were washed with PBS to remove prokaryotic cells. A Bradford protein assay was used to determine that the protein levels were the statistically the same between control and PBS-washed bacteria-exposed cultures, ensuring that most prokaryotic cells were removed. An aliquot of 200 μL of 5 μM Calcein-AM (ThermoFisher Scientific) in PBS was added to each well and plates were incubated for 20 minutes at 5% CO2 at 37ºC. Plates were read using a Synergy 2 plate reader (Biotek, Winooski, VT, USA) at an excitation/emission spectrum of 485/528 nm immediately after incubation.
To investigate the antibacterial effects of TiO2, bacterial viability was measured using the Baclight LIVE/DEAD commercial assay (ThermoFisher Scientific). The LIVE/DEAD assay is composed of two dyes, propidium iodide (PI), which stains cell nuclei but cannot pass into viable cells, and SYTO9, which stains all cells in a population. The comparison between the two stains provides information on the overall viability of bacterial cells. After the 4 hour nanoparticle and bacterial exposure assay, a 100 μL sample of the serum-free, glucose-free, phenol red-free DMEM containing 1.4 × 10⁻⁴ mg/mL 30 nm TiO2 nanoparticles and 103 CFU/mL bacteria was removed from the top Transwell chamber and transferred to a black 96 well plate (Corning). A mixture of the two dyes at a final concentration 5μM SYTO9 and 30μM PI was added, according to manufacturer’s instructions. Fluorescence was read in a plate reader at 485/625 nm for PI and 485/535 nm for SYTO9.
Transepithelial Resistance.
Transepithelial electrical resistance (TER) was used to determine tight junction functionality. TER measurements were made using an EVOM2 Epithelial Volt/Ohm Meter (World Precision Instruments, Sarastoa Fl. USA). An ENDOHM-6 chamber (World Precision Instruments) was sterilized in 70% ethanol for 15 minutes and calibrated with a Calicell in 2 mL of sterile 100 mM KCl solution. Electrodes were then left to equilibrate in serum-free, glucose-free, phenol red-free DMEM for 15 minutes before the Transwell supports were removed from their plates and measurements were made. Monolayers used in experiments had a TER value of 150 – 200 Ω ∙ cm2. TER measurements were performed on cells grown in Tranwells on the day of glucose transport experiments before glucose starvation and repeated again after the 4 hour exposure period.
Reactive Oxygen Species Assay.
Oxidative stress as a result of nanoparticle and/or bacteria exposure within the in vitro model was measured using CellROX® green (ThermoFisher Scientific), a fluorescent probe for oxidative stress. Monolayers were grown for 14 days, washed in phosphate buffer solution and incubated for 1 hour in serum-, glucose-, and phenol red-free DMEM. Cells were then exposed to 1.4 × 10⁻⁴ mg/mL 30 nm TiO2, 103 CFU/mL L. rhamnosus, both TiO2 NP and L. rhamnosus, or kept under control conditions (glucose-free, serum-free DMEM only) for 4 hours. CellROX® was then added to apical chambers at a concentration of 5μM, as recommended by the manufacturer. Cells were incubated for 30 minutes, washed 3 times with PBS, and fluorescence was measured with a fluorescent plate reader.
Glucose uptake and transport.
Glucose transport was modeled using the fluorescent glucose analog 2-(N-(7-(Nitrobenz-2-oxa-1,3-diazol-4-yl)Amino)-2-Deoxyglucose (2-NBDG, ThermoFisher Scientific). Cells were first glucose starved in serum-free, glucose-free, and phenol red-free DMEM (ThermoFisher Scientific) for 1 hour. Cells were then exposed to a 99 μM solution of 2-NBDG in serum-, glucose- and phenol red-free medium with or without 1.4 × 10⁻⁴ mg/mL 30 nm TiO2 in the apical Transwell chamber. The concentration of glucose analog was deliberately high to ensure complete saturation of glucose transporters. For bacterial exposure experiments, L. rhamnosus was also added to the apical chamber at a concentration of 103 CFU/mL in serum-free, glucose-free, and phenol red-free DMEM. The apical exposure solution for all conditions was 100 μL, and the basolateral chamber contained 600 μL of serum-, glucose- and phenol red-free medium. After 15 minutes of exposure, and every 15 minutes thereafter, 100 μL of serum free, glucose free DMEM was removed from the basolateral chambers of each well via micropipette and placed into the well of a black 96-well plate. Basolateral medium removed was replaced with fresh serum-, glucose- and phenol red-free DMEM. When the basolateral chamber was not being sampled, Transwells were stored in the incubator at 37º C at 5.0% CO2, wrapped in aluminum foil to limit the effects of UV radiation on the nanoparticles (Tong, Binh, Kelly, Gaillard and Gray, 2013). After 4 hours, cells were lysed in a buffer consisting of 1% sodium deoxycholate, 40 mM KCl, and 20 mM Tris (pH 7.4) in 18 MΩ H2O. This buffer solution has previously been shown not to abolish fluorescence of 2-NBDG (Blodgett, Kothinti, Kamyshko, Petering, Kumar and Tabatabai, 2011) Lysate was placed in black 96 well plates and fluorescence was measured at an excitation/emission spectrum of 485/528 nm.
Gene Expression.
Real-time polymerase chain reaction (RT-PCR) was used to examine changes in the expression of glucose transporters SGLT-1 and GLUT2. Previously published primers were custom made (ThermoFisher Scientific) and sequences used were the following: GAPDH 5’-GACCACAGTCCATGACATCACT-3’ (forward), 5’-TCCCACCACCCTGTTGCTGTAG-3’ (reverse) (Tallkvist, Bowlus and Lonnerdal, 2000); SGLT1 5’-GCCCTGGTTTTGGTGGTTG-3’ (forward) 5’-CGAGATCTTGGTGAAAATGTAGAGC-3’ (reverse) (Kipp, Khoursandi, Scharlau and Kinne, 2003); GLUT2 5’-AGTTAGATGAGGAAGTCAAAGCAA-3’ (forward), 5’-TAGGCTGTCGGTAGCTGG-3’ (reverse) (Alzaid, Cheung, Preedy and Sharp, 2013). Cells were seeded onto well plates and grown for 14 days. On the day of the transport experiment, cells were glucose starved for 1 hour and exposed to 1.4 × 10⁻⁴ mg/mL 30 nm TiO2 nanoparticles and/or 103 CFU/mL Λ. rhamnosus for 4 hours. RNA was then extracted using an RNeasy RNA extraction kit (Qiagen, Hilden, Germany) following the manufacturer’s instructions. RNA yield and purity was quantified using a NanoDrop 2000 (ThermoFisher Scientific). Samples with an OD260/280 ratio of greater than 1.8 were considered suitable for gene expression measurements (Becker, Hammerle-Fickinger, Riedmaier and Pfaffl, 2010), and were diluted to 25 ng/μL before converting to cDNA using the iScript cDNA synthesis kit (Bio-Rad, Hercules, CA). RT-PCR was performed in a MiniOpticon Real-Time PCR Detection System (Biorad).The 20 μL PCR mixtures consisted of 10 μL of POWER SYBR Green PCR Master Mix (Applied Biosystem, Carlsbad, CA), 7 μL water, and 1 μL of each primer (10 mM concentration) that was added to 1 μL of the cDNA samples. All reactions were performed in triplicate and under the following conditions: 95°C for 3 min, 50 cycles of 95 °C for 60 s, 54 °C for 15s, and 72 °C for 30s. Melt curves were then determined from 65.0 °C to 95.0 °C with increments of 0.5 °C for 5s to ensure amplification of a single product. Gene expression was normalized to the expression of GADPH and compared with unexposed controls using the 2-ΔΔCt method (Livak and Schmittgen, 2001). Data were analyzed with Biorad CFX Manager Software.
Scanning Electron Microscopy.
Caco-2/HT29-MTX cells were seeded into 6-well plates containing sterilized cover slips coated with 8 μg/cm2 rat tail Type I collagen and cultured for 14 days. The monolayers were exposed to 103 CFU/mL L. rhamnosus and/or 1.4 × 10⁻⁴ mg/mL 30 nm TiO2 NP in DMEM for 4 hours. The samples were then fixed in 4% paraformaldehyde, rinsed with PBS, dehydrated using an ethanol gradient (50, 75, 95, and 100%), transferred to hexamethyl disilizane (HMDS) and dried overnight (1:2 HMDS: Ethanol, 2:1 HMDS: Ethanol, 100% HMDS). Samples were then mounted, carbon coated, and viewed using a Zeiss Supra 55 Scanning Electron Microscope at 5000 eV. Six microscope slides per condition were made. Image analysis was performed with ImageJ (Schneider, Rasband and Eliceiri, 2012).
D. melanogaster husbandry.
All experiments were conducted using Oregon-R (ORE-R), an inbred but robust wild type strain. The flies were maintained on a 12 h light/dark cycle in an incubator at 25°C on a standard yeast/dextrose media [1220 ml distilled water, 12 g agar, 100 g dextrose, 100 g inactive brewer’s yeast, 0.5 ml 8.3% phosphoric acid and 0.5 ml 83.6 % propionic acid (McGraw, Fiumera, Ramakrishnan, Madhavarapu, Clark and Wolfner, 2007)]. TiO2 nanoparticles were suspended in the food during cooking and four different concentrations were utilized, 0 (unexposed or control), 5 ppM, 50 ppM and 500 ppM. The parents of all the experimental flies were from ORE-R stocks that had not previously been exposed to TiO2 additions.
Development rate and dry body weight.
Adults flies that were aged approximately 2 to 6 days were placed onto grape plates [2714 ml H2O, 2275 ml grape juice, 110 g agar, 290 g dextrose, 115 g sucrose, 90 g inactive yeast, 110 ml of 1.25M NaOH, 28 ml of 8.3% phosphoric acid and 28 ml of 83.6% propionic acid (McGraw, Fiumera, Ramakrishnan, Madhavarapu, Clark and Wolfner, 2007)] and allowed to lay eggs for eight hours and then discarded. The grape plates did not contain any added TiO2 nanoparticles. Twenty-four hours later, first instar larvae (based on morphology) were picked from the grape plates using dissecting probes dabbed with yeast paste. Thirty first instar larvae were collected from the grape plates and haphazardly allocated to the four different TiO2 treatments where they were allowed to develop. Ten replicate vials of each concentration (each with 30 larvae) were used to measure developmental traits. Vials were checked daily until the first pupa was observed and then they were checked every 8–10 hours until all the adults emerged. Virgins were collected over CO2 within 10 hours of emergence and housed in single sex vials at densities below 10 flies per vial for 48 hours, flash frozen and stored at −80oC for further analyses. The number of larvae that pupated, the time of pupation for each, the proportion of larvae that emerged, the time of emergence and sex of each adult was recorded. Frozen flies were dried for 24 hours at 60oC and weighed individually on a Mettler Toledo MX5 scale. Three males and 3 females were measured from each vial and the average for males and females was taken prior to statistical analysis.
Wet body weight, protein and glucose concentrations.
Larvae were reared at controlled densities on the four different TiO2 treatments and virgins were collected and flash frozen as described above, except that the timing of development was not recorded. Thirty replicate vials of each concentration were used to measure protein levels. From each vial, four virgin flies of a single sex were weighed in a group and homogenized in 80 μl of homogenization buffer (10mM Tris, 1mM EDTA, 0.1% (v/v) Triton X, pH 7.4), spun at 7000g for 1 minute at 4oC and the supernatant diluted to 1:3. Protein was measured using a DC protein assay (BioRad, #500–0116) with BSA as a standard (Gbiosciences, #786–006) according to manufacturer’s protocols. A standard curve was run on each plate and each sample was run in duplicate and averaged prior to analysis. Glucose was measured in lysates using the Thermo Infinitry Glucose reagent as described previously (Musselman, Fink, Narzinski, Ramachandran, Hathiramani, Cagan and Baranski, 2011).
Statistical analyses.
In vitro results are expressed as mean ± standard error of the mean (SEM). A one-way ANOVA with Tukey’s post-test was used as an assessment between multiple groups, and an unpaired student’s t-test was used to assess statistical differences between two conditions. For the glucose transport studies, normality of distribution was determined with a D’Agostino & Pearson omnibus K2 test. Statistical significance was determined using a nonlinear regression model with replicates test for lack of fit. Out of the models tested, the quadratic model was accepted as the best fit. Curve fits were compared using the Akaike’s Information Criteria (AIC) from a quadratic model. All in vitro statistical comparisons were made using Graphpad Prism 5. All in vivo analyses were conducted in R(V3.3.1)(Team, 2014) initially considering treatment as a factor. Treatment is initially considered a factor so as to not make the assumption of a linear relationship between TiO2 concentration and effect size. When treatment was significant, post-hoc analyses were completed using TukeyHSD from the multicomp package (Hothorn, Bretz and Westfall, 2008). The potential for a non-monotonic response to TiO2 concentration was tested by considering treatment as a continuous covariate and comparing a model with only a linear term to a model with both a linear and quadratic term. The proportion of larvae that pupated and emerged were analyzed using generalized linear models (glm) of the binomial family and corrected for overdispersion when appropriate. Time to pupation (from the midpoint of egg laying to pupae), time to emergence (from the midpoint of egg laying to emergence), dry and wet body weight, protein levels and glucose levels were analyzed using linear models (lm). Only those larvae that pupated or emerged were used for the analyses of development time.
RESULTS
The morphology of the TiO2 nanoparticles was found to be approximately spherical when imaged using SEM (Supplementary Figure 1A, B). The dry size of the nanoparticles was measured from SEM images (Supplementary Table 1), and found to be consistent with manufacturer-reported values. TEM analysis (Supplementary Figure 1C, D) showed that the size of TiO2 NPs ranged from 20 to 40 nm in solution, although there was significant aggregation. The high TiO2 NP surface free energy causes TiO2 NPs in biological medium to adsorbed biological components such as proteins and amino acids (Mudunkotuwa and Grassian, 2015). Proteins in particular bind to the NP surface and form a protein corona (Tenzer, Docter, Kuharev, Musyanovych, Fetz, Hecht, Schlenk, Fischer, Kiouptsi, Reinhardt, Landfester, Schild, Maskos, Knauer and Stauber, 2013). As shown in Supplementary Figure 1D, TiO2 NPs in DMEM were bound by culture medium components.
The zeta potential and hydrodynamic size of TiO2 NP in 18MΩ water and serum free DMEM were acquired with DLS (Supplementary Table 1). The hydrodynamic diameters (332±42 nm in water, 355±70 in serum free DMEM) also suggested that TiO2 NPs were aggregated in solution. Polydispersity index (PdI) values in 18 MΩ water (0.34±0.02) and serum free DMEM (0.42±0.05) show that there are relatively monodisperse size distributions.
Human epithelial colorectal adenocarcinoma (Caco-2) and human intestinal goblet cell (HT29-MTX) were cocultured for two weeks at a ratio of 3:1, respectively, to represent the small intestinal epithelium as these cell lines in these conditions have been demonstrated to induce mature phenotypes and behavior analogous to that of the small intestine (Mahler, Shuler and Glahn, 2009, Walter, Janich, Roessler, Hilfinger and Amidon, 1996). The monolayers were cultured on Transwell inserts within 24-well plates and served as a barrier between the apical (top) chamber and basolateral (bottom) chamber (Figure 1). The top chamber represents the lumen of the small intestine, while the bottom chamber represents the blood stream.
Figure 1.
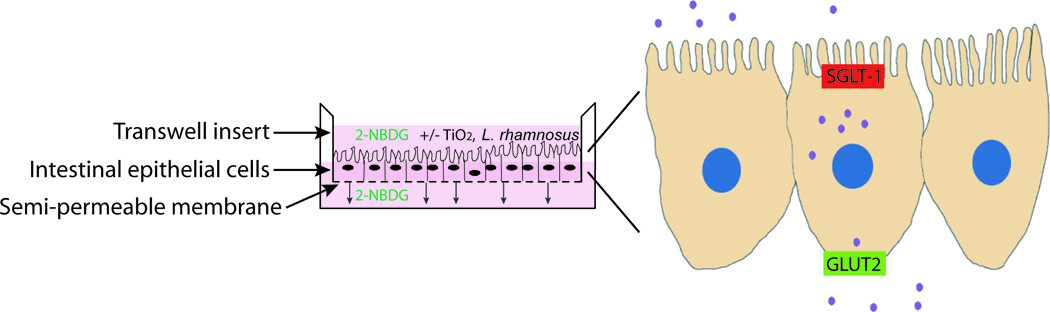
In vitro model of intestinal epithelium. Co-cultures of absorptive (Caco-2) and mucus producing (HT29-MTX) intestinal epithelial cells are seeded on a semi-permeable membrane and grown until confluent. The top chamber represents the lumen of the small intestine while the bottom chamber represents the bloodstream. 2-NBDG transport from the top to the bottom chamber represents transport of glucose into the body. Expanded view of cells shows apical and basolateral glucose transporters.
To successfully incorporate the beneficial bacteria L. rhamnosus into the in vitro model, epithelial cell viability in response to increasing amounts of bacteria and changes in bacterial viability due to nanoparticle exposure were assessed (Figure 2A, B). Intestinal epithelial cell monolayers were exposed to 0, 102, 103, 104, 105, and 106 CFU/mL of L. rhamnosus for four hours to assess epithelial cell viability in the presence of bacteria. Calcein-AM staining showed that at a bacterial concentration of 103 CFU/mL, 86 ± 1.5% of epithelial cells remained viable (Figure 2A). Bacterial viability was measured in the presence of nanoparticles by exposing 103 CFU/mL of L. rhamnosus to 1.4×10⁻⁴ mg/mL TiO2 for four hours using the Baclight LIVE/DEAD commercial assay (ThermoFisher Scientific). L. rhamnosus exposed to TiO2 emmitted 90 ± 7.0 % as much fluorescence as unexposed controls (Figure 2A). Fluorescence between unexposed controls and nano-TiO2 cultures was compared using a student’s t-test, and no significant differences resulting from the addition of TiO2 were found (t(16) = 1.30, p = 0.21).
Figure 2.
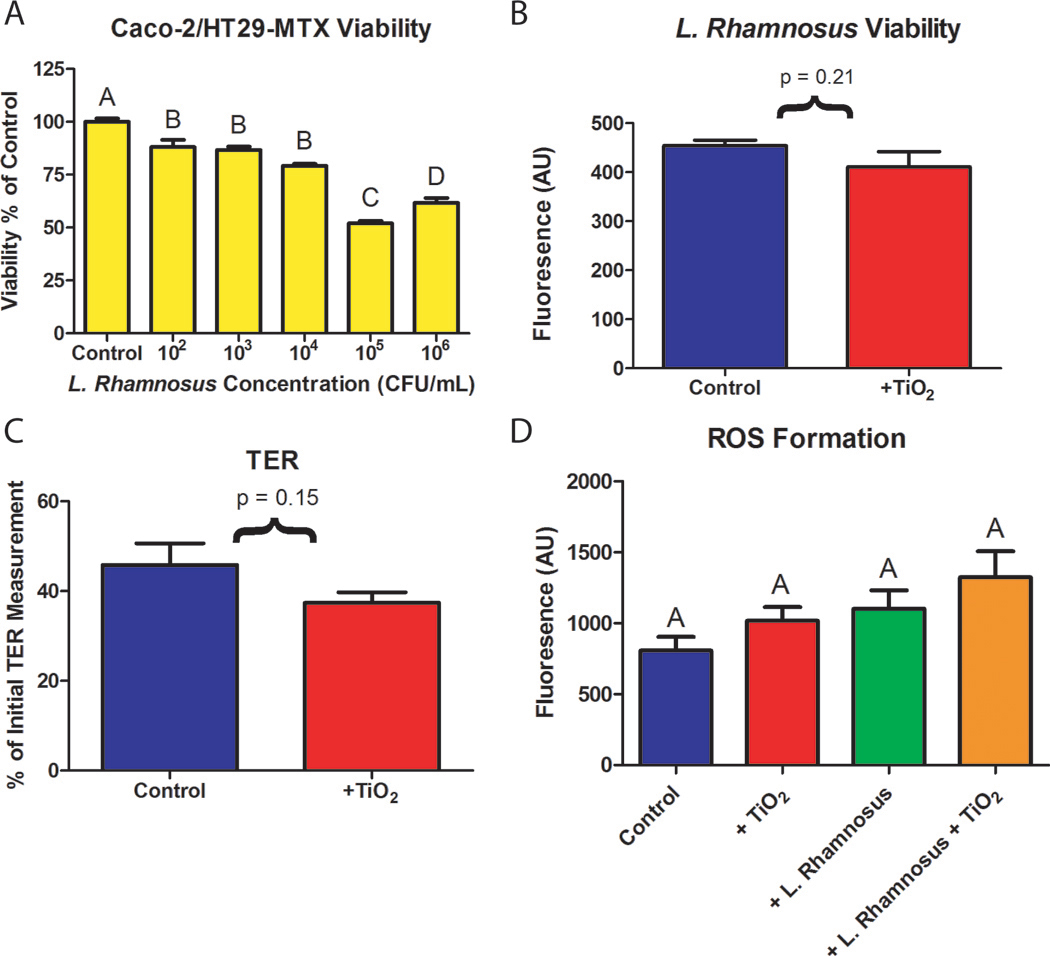
(A) Intestinal epithelial cell viability. Co-cultures of Caco-2 and HT29-MTX were grown for 14 days and exposed to varying concentrations of L. rhamnosus in DMEM for four hours. After a 4 hour exposure to L. rhamnosus, mammalian cell viability was significantly decreased for all concentrations of bacteria tested. Standard errors and Tukey groups are shown, n = 6. (B) L. rhamnosus viability. 103 CFU/mL L. rhamnosus in DMEM containing 1.4×10⁻⁴ mg/mL 30nm TiO2 nanoparticles were added to the top chamber of Caco-2/HT29-MTX intestinal cultures. After four hours, the viability of L. rhamnosus was not significantly decreased according to a student’s t test, t(16) = 1.30, p = 0.21, Standard errors are shown. (C) Representative transepithelial resistance (TER) measurements of cell monolayers before and after a four hour exposure to 1×10⁻⁴ mg/mL TiO2 nanoparticles. Data is presented as a percentage of TER measurements made in the same wells before and after the nanoparticle exposure and glucose transport experiments. Data is provided as a mean ± SEM (n = 5), results were not significantly different according to an upaired student’s t-test ( p > 0.05). (D) Reactive oxygen species (ROS) formation. Fluorescence resulting from CellROX dye in controls or following a four hour exposure to 1×10⁻⁴ mg/mL TiO2 naoparticles, 103 CFU/mL L. rhamnosus, or both 1×10⁻⁴ mg/mL TiO2 and 103 CFU/mL L. rhamnosus. No statistical difference was found between treatments according to a one-way ANOVA (p > 0.05). Data is provided as a mean ± SEM (n = 6).
To characterize the effects of TiO2 nanoparticles and L. rhamnosus on the intestinal epithelial monolayers, both transepithelial electrical resistance (TER) and reactive oxygen species (ROS) generation were measured. There were no statistically significant changes in TER following a four hour exposure to 1.4×10⁻⁴ mg/mL nano-TiO2 (Figure 2C, p = 0.15). ROS generation was measured after a four hour exposure to TiO2 nanoparticles and/or L. rhamnosus using CellROX® reagent, which binds to byproducts of oxidative stress (Alves, Celeghini, Andrade, Arruda, Batissaco and Almeida, 2015). The monolayers were rinsed with PBS following a 30 minute exposure to the CellROX® dye and the fluorescence of each monolayer was quantified using a fluorescent plate reader. There was no significant difference in ROS generation across the groups (Figure 2D, p = 0.08).
To characterize the functional effects of TiO2 nanoparticle exposure alone and in the presence of beneficial bacteria, we assessed changes in glucose transport across the in vitro intestinal epithelium. Fluorescent glucose analog 2-NBDG was used to quantify glucose uptake into cells and transport across the intestinal epithelial monolayer. The cell monolayers were starved of glucose for one hour in serum-free glucose free media to maximize glucose transport and minimize untraceable glucose from the system. Cells were then exposed to a solution consisting of 1.4×10⁻⁴ mg/mL TiO2 30nm nanoparticles, 99 μM 2-NBDG, and 103 CFU/mL L. rhamnosus for bacterial exposure experiments. A relatively high concentration of 2-NBDG was used to ensure that glucose transporters were saturated (Pielmeier, Andreassen, Nielsen, Chase and Haure, 2010). Glucose analog uptake into the cells was not significantly changed in the presence of TiO2 nanoparticles or in the presence of bacteria (Figure 3A, p = 0.15). Glucose analog transport across the intestinal epithelium model was significantly decreased in the presence of TiO2 nanoparticles (Figure 3B, n=72, p<0.0001). However, in the presence of 103CFU/mL L. rhamnosus glucose transport across the monolayer was not significantly altered with exposure to TiO2 nanoparticles (Figure 3B, n=60, p=0.64). Experiments were also conducted to measure 2-NBDG transport across a blank membrane (no intestinal epithelial cells) in the presence or absence of TiO2 nanoparticles and/or L. rhamnosus (Figure 3C). This data shows that in wells with or without TiO2 there are no significant differences in 2-NBDG transport (p = 0.87), indicating the the nanoparticles themselves are not interacting with the glucose analog and are not responsible for changes in 2-NBDG transport. There is also no significant difference (p = 0.96) in wells treated with L. rhamnosus with or without nano-TiO2, although the overall amount of 2-NBDG transport remains lower in wells with L. rhamnosus. The bacteria may therefore absorb some of the glucose analog.
Figure 3.
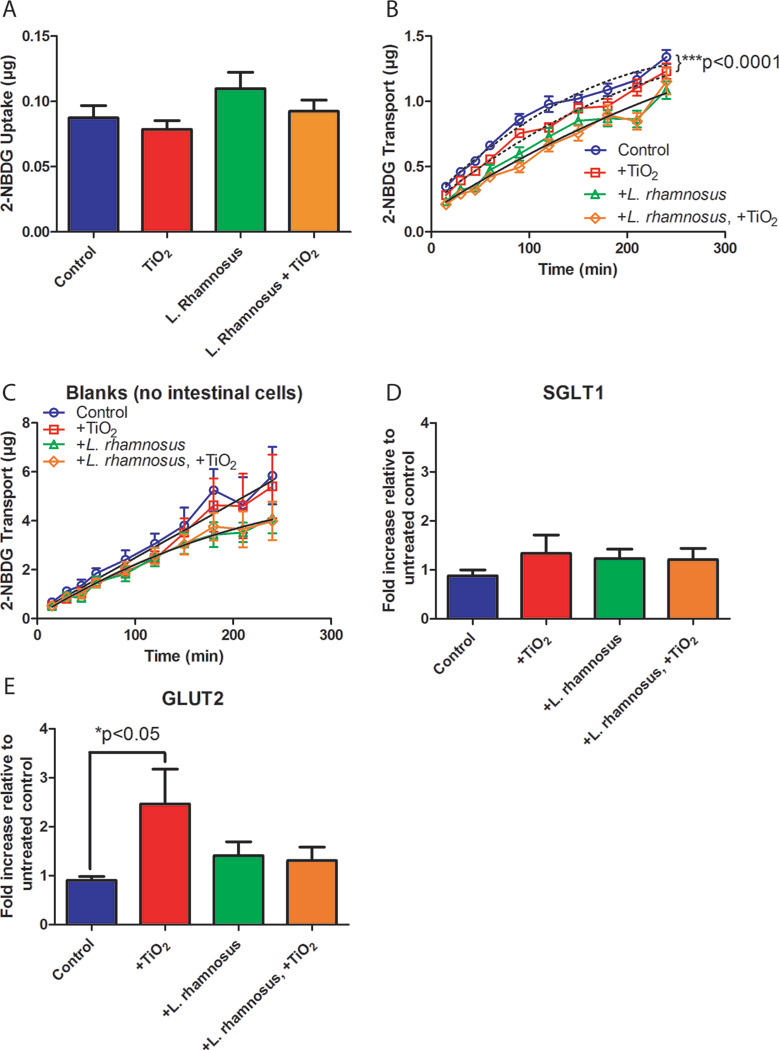
Glucose analog (2-NBDG) uptake (A) and transport (B, C) and glucose transporter gene expression (D, E). (A) 2-NBDG uptake into intestinal epithelial cells is not significantly altered after a four hour exposure to 1.4×10⁻⁴ mg/mL 30nm TiO2 nanoparticles (n=22), 103 CFU/mL L. rhamnosus (n=25), or 1.4×10⁻⁴ mg/mL TiO2 nanoparticles and 103 CFU/mL L. rhamnosus (n = 25) when compared with untreated controls according to a one-way ANOVA, p = 0.16. Standard errors are shown. (B) 2-NBDG transport across the in vitro intestinal epithelium model following exposure to exposure to 1.4×10⁻⁴ mg/mL 30nm TiO2 nanoparticles, L. rhamnosus, or 1.4×10⁻⁴ mg/mL TiO2 nanoparticles and L. rhamnosus. Glucose transport was significantly decreased following exposure to nanoparticles when compared with untreated controls (n=72 across 6 transport experiments, p< 0.0001), but is not significantly changed with nanoparticle exposure in the presence of beneficial bacteria (n=60, across 5 transport experiments, p = 0.64). Curve fits (dotted or solid black lines) were compared using the AICs from a quadratic model. (C) 2-NBDG transport across blank membranes following exposure to 1.4×10⁻⁴ mg/mL 30nm TiO2 nanoparticles, L. rhamnosus, or 1.4×10⁻⁴ mg/mL TiO2 nanoparticles and L. rhamnosus. Glucose transport was not significantly decreased following exposure to nanoparticles when compared with untreated controls (p = 0.87) and was not significantly changed with nanoparticle exposure in the presence of beneficial bacteria (p = 0.96). Curve fits were compared using the AICs from a quadratic model. (D, E) Gene expression of glucose transporters model following exposure to exposure to 1.4×10⁻⁴ mg/mL 30nm TiO2 nanoparticles, L. rhamnosus, or 1.4×10⁻⁴ mg/mL TiO2 nanoparticles and L. rhamnosus. Expression of the apical glucose transporter SGLT1 is not significantly altered following a four hour exposure to nanoparticles or bacteria according to a one-way ANOVA (p > 0.05). The basolateral glucose transporter GLUT2 expression is significantly increased with exposure to nanoparticles only in the absence of bacteria (p<0.05). Standard error is shown.
The gene expression of glucose transporters typically found on the apical (SGLT1), and basolateral (GLUT2) surfaces of the gut epithelium were next investigated. A glucose transport experiment was performed (+/−TiO2 nanoparticles, +/− L. rhamnosus) as previously described, followed by mRNA extraction from the monolayers and conversion into a cDNA library. SGLT1 expresion did not show any statistically significant changes across treatment groups (Figure 3D, p = 0.49). The expression of GLUT2 was significantly increased in the presence of TiO2 nanoparticles (n=24, p < 0.05), but not when cells were exposed to nano-TiO2 in the presence of beneficial bacteria (Figure 3E). This suggests that cells are working to regulate the transport mechanisms disturbed by nanoparticle ingestion.
To further investigate the mechanism of nanoparticle-induced changes in glucose transport, SEM images of the intestinal cell microvilli were obtained and analyzed (Figure 4). Similarly to results reported by Koeneman et al. (Koeneman, Zhang, Westerhoff, Chen, Crittenden and Capco, 2010) and Guo et al. (Guo, Martucci, Moreno-Olivas, Tako and Mahler, 2017), TiO2 nanoparticles significant decreased the number of absorptive cell microvilli when compared to untreated controls (Figures 4A and B). The damage to microvilli caused by TiO2, however, was remediated by beneficial bacteria (Figure 4D and E).
Figure 4.
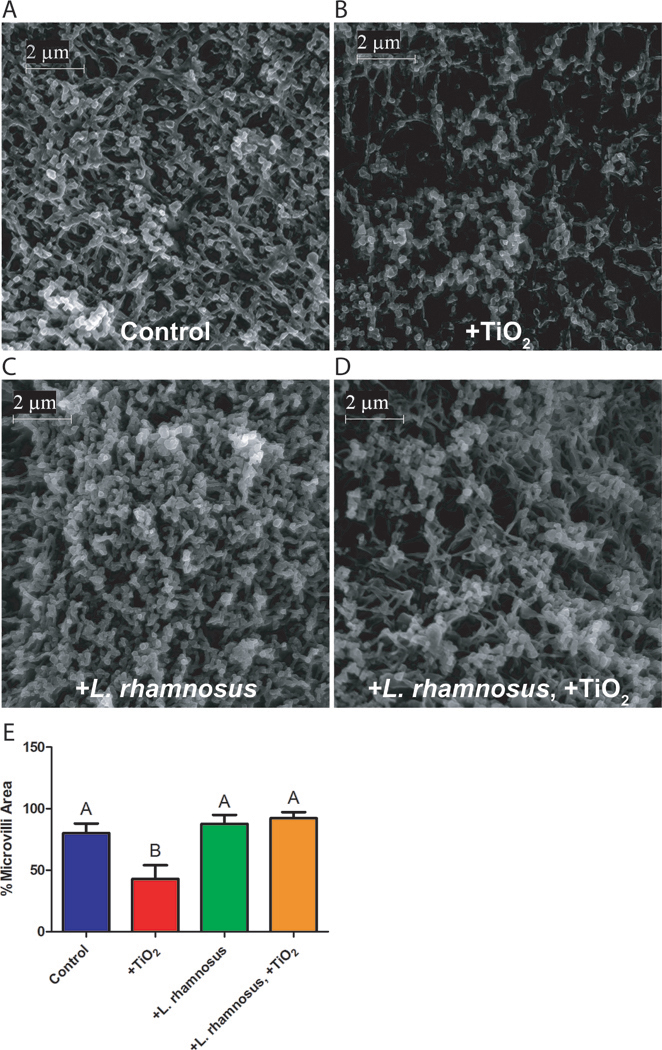
Scanning Electron Microscopy. Images show unexposed controls (A), or cells following a four hour exposure to 1.4×10⁻⁴ mg/mL 30nm TiO2 nanoparticles (B), 103 CFU/mL L. rhamnosus (C), or 1.4×10⁻⁴ mg/mL TiO2 nanoparticles and 103 CFU/mL L. rhamnosus (D). Scale bars are 2 μm (magnification 20K). (E) ImageJ was used to quantify the percent area covered by microvilli (n = 6). Cells exposed to TiO2 nanoparticles showed a significant decrease in microvilli according to a one-way ANOVA (p < 0.05). Standard error and Tukey groups are shown.
TiO2 nanoparticles were mixed into the diet at various concentrations on which flies were reared from first instar larvae to adulthood. TiO2 exposure had effects on a number of traits in D. melanogaster. Many of the traits showed non-monotonic dose response curves, where intermediate concentrations showed the largest effects. The proportion of larvae that pupated was significantly affected by TiO2 exposure (P 3, 1165 = 0.0006). Overall, flies exposed to 500 ppM TiO2 had the highest proportion that pupated (0.78 ± 0.001 S.E.) while flies exposed to 50 ppM had the lowest proportion that pupated (0.64 ± 0.001 S.E.). Control flies (0.68 ± 0.001 S.E.) and flies exposed to 5 ppM TiO2 (0.76 ± 0.001 S.E.) had intermediate proportions of flies that pupated (Figure 5A). There was also strong evidence for a non-monotonic response (P 1, 1165 = 0.0001). TiO2 exposure affected the time to pupation (P 3, 834 = 3.8 × 10⁻¹⁰) with flies exposed to 5 ppM TiO2 pupating the earliest (156.4 hrs± 0.07 S.E), and flies exposed to 500 ppM pupating the latest (162 hrs ± 0.06 S.E.) as shown in Figure 5B. The test for a non-monotonic response was not significant, however (P 1, 835 = 0.57). The proportion of adults that emerged was also affected by TiO2 exposure (P 3, 1165 = 0.0016). Similar to the proportion that pupated, flies exposed to 500 ppM TiO2 had the highest proportion emerge (0.77 ± 0.001 S.E.) and those exposed to 5 ppM had the lowest (0.64 ± 0.001 S.E.). Control flies (0.66 ± 0.001 S.E.) and those exposed to 50 ppM (0.75 ± 0.001 S.E.) had intermediate proportions that emerged (Figure 5C). There was only weak support, however, for a non-monotonic response (P 1, 1166 = 0.054). Time to emergence was significantly affected by TiO2 exposure for both males and females (P 3, 420 = 1.6 × 10⁻¹²; P 3, 394= 4.6 × 10⁻⁶, respectively). Flies exposed to 5 ppM TiO2 emerged the earliest in both males (247.3 hrs ± 0.12 S.E.) and females (243.9 hrs ± 0.18 S.E.) as shown in (Figure 5D). There was a significant non-monotonic response of time to emergence in males (P 1,421 = 0.0026) but not in females (P 1, 395 = 0.49).
Figure 5.
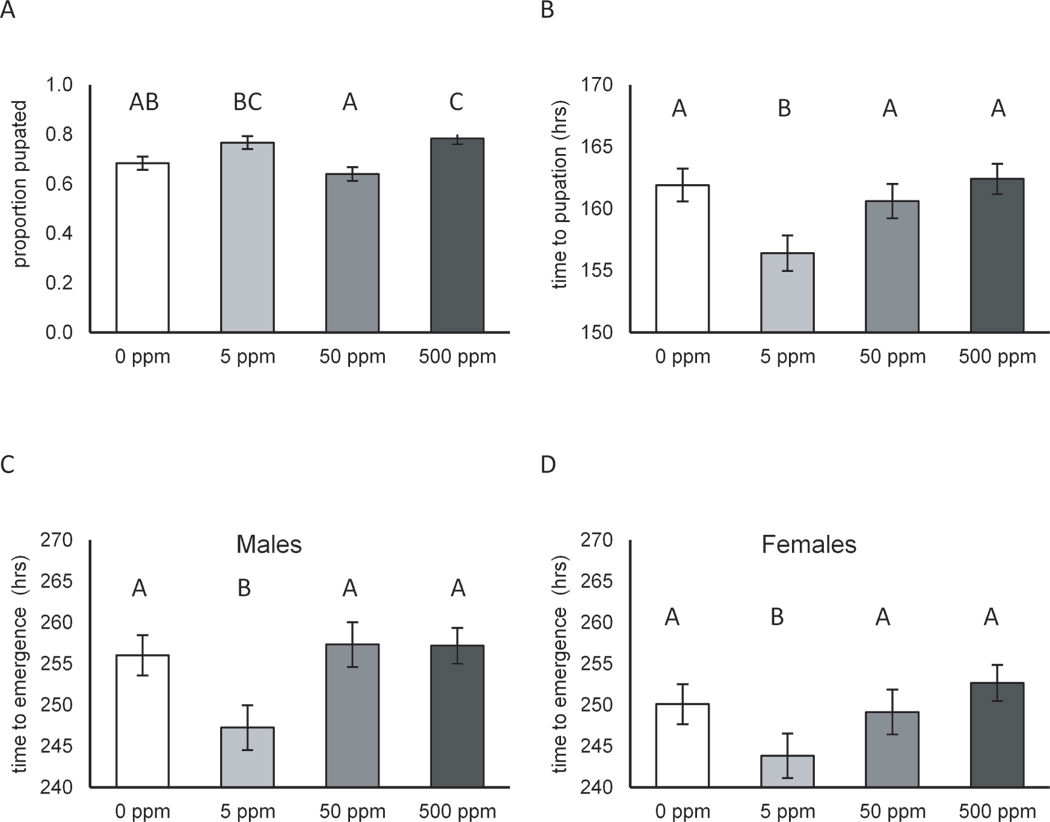
Developmental traits including proportion pupated, mean time to pupation, and mean time to emergency for male and female Drosophila melanogaster (D. melanogaster) instar larvae exposed to 5, 50, or 500 ppm 30 nm TiO2 nanoparticles (NP) suspended within food. Shown are the proportion pupated (A), mean time to pupation in hours (B) and mean time to emergence in hours for males (C) and females (D). Thirty first instar larvae were collected from grape plates without TiO2 NP and haphazardly allocated to the four different TiO2 treatments where they were allowed to develop. Ten replicate vials of each concentration (each with 30 larvae) were used to measure developmental traits. Standard errors and Tukey groups are indicated above each treatment.
Dry weight of both males and females was affected by TiO2 exposure (P 3,98 = 6.7 × 10⁻⁵; P 3,101 = 0.01, respectively). In both males and females, the control flies were the largest (0.26 mg ± 0.007 S.E. for males and 0.42 mg ± 0.007 for females) but in males the flies exposed to 50 ppM TiO2 were the smallest (0.22 mg ± 0.006 S.E) while in females the flies exposed to 5 ppM TiO2 were the smallest (0.37 mg ± 0.006 S.E) as shown in Figure 6A and B. There was evidence for a non-monotonic response to TiO2 in males (P 1,99 = 1.6 × 10⁻⁵) but not in females (P 1,102 = 0.18). TiO2 exposure also had a significant effect on glucose concentration in both males (P 3,57 = 0.027) and females (P 3,57 = 0.018). Exposure to TiO2 tended to decrease glucose concentrations (Figure 6C, D). In both cases, the control flies had the highest glucose concentration (171.6 mg/dL ± 9.9 S.E. for males and 261.5 ± 14.8 S.E. for females). The lowest glucose concentrations were observed among male flies exposed to the 500 ppM TiO2 (135.8 ± 10.3 S.E.) and female flies exposed to 50 ppM (217.6 ± 15.5 S.E.). TiO2 had no effect on total protein concentration (adjusted for wet weight) in either males (P 3,57=0.42) or females (P 3,57 =0.07, data not shown).
Figure 6.
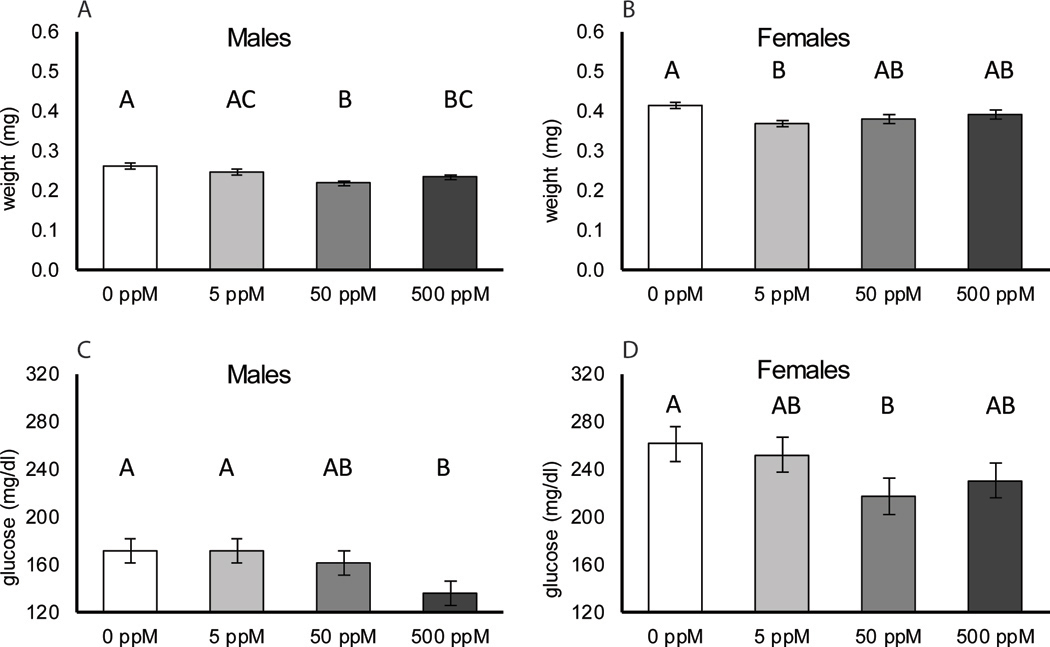
Wet body weight, protein and glucose concentrations for male and female Drosophila melanogaster (D. melanogaster) exposed to 5, 50, or 500 ppm 30 nm TiO2 nanoparticles (NP) suspended within food. Mean dry weight (mg) with standard errors for males (A) and females (B) across the four different TiO2 nanoparticle concentrations. Mean glucose concentrations with standard errors for males (C) and females (D) across the four different TiO2 nanoparticle concentrations. Tukey groupings are indicated above each treatment.
DISCUSSION
The small intestine is the primary site of nutrient absorption (DeSesso and Jacobson, 2001), and is exposed directly to ingested nano-TiO2. An in vitro model of the small intestine (shown in Figure 1) and an in vivo D. melanogaster model was used to examine the influence of physiologically relevant concentrations of TiO2 nanoparticles on intestinal function. A concentration of 103 CFU/mL L. rhamnosus was added the model of the intestinal epithelium to represent the beneficial bacterial population. Glucose absorption begins in the duodenum and is completed in the proximal jujenum (Borgström, Dahlqvist, Lundh and Sjövall, 1957). A 103 CFU/mL bacterial concentration is consistent with physiologically relevant bacterial concentrations in the proximal small intestine. The stomach and duodenum contain 101-103 CFU/mL as acid, bile, and pancreatic secretions inhibit colonization (O’Hara and Shanahan, 2006). The jejunum and ileum contain 104–107 CFU/mL (Sekirov, Russell, Antunes and Finlay, 2010). The primary sites of glucose absorption, the duodenum and jejunum, are inhabited by predominantly Gram-positive bacterial species (Sekirov, Russell, Antunes and Finlay, 2010, Muir and Hopfer, 1985, Lee, Prasad, Brewer and Owyang, 1989), primarily Lactobacillus, Bifidobacterium, Streptococcus, and Enterococcus (Sekirov, Russell, Antunes and Finlay, 2010). L. rhamnosus is considered beneficial, as clinical studies suggest that treatment with L. rhamnosus is capable of reducing intestinal permeability in patients of irritable bowel syndrome (Francavilla, Miniello, Magista, De Canio, Bucci, Gagliardi, Lionetti, Castellaneta, Polimeno, Peccarisi, Indrio and Cavallo, 2010), and pretreatment with L. rhamnosus can compensate for increases in gut permeability caused by agents such as alcohol (Wang, Liu, Sidhu, Ma, McClain and Feng, 2012) or enterohemorrhagic strains of Escheria coli (Johnson-Henry, Donato, Shen-Tu, Gordanpour and Sherman, 2008). The mechanism of action of this effect is not well characterized, but has been associated with the soluble proteins p40 and p75 (Seth, Yan, Polk and Rao, 2008). TiO2 nanoparticles have previouly been shown to have antibacterial activity against both gram negative and gram positive bacteria (Dizaj, Lotfipour, Barzegar-Jalali, Zarrintan and Adibkia, 2014, Kubacka, Diez, Rojo, Bargiela, Ciordia, Zapico, Albar, Barbas, Martins dos Santos, Fernández-García and Ferrer, 2014, Fu, Vary and Lin, 2005, Barnes, Molina, Xu, Dobson and Thompson, 2013), but results from the current study show that L. rhamnosus remains viable in the presence of 1.4×10⁻⁴ mg/mL nano-TiO2 over the duration of four hours.
TER is a commonly used method for evaluating epithelial monolayer integrity and tight junction functionality, has been shown to accurately gauge the paracellular permeability of cell monolayers (Narai, Arai and Shimizu, 1997). TER measurements were made before and after nano-TiO2 exposure to characterize changes in tight junction functionality. These results suggest that TiO2 nanoparticles at this concentration do not disrupt intestinal epithelial cell-cell junction integrity, and that alterations in nutrient transport were not due to changes in epithelial permeability. ROS generation has been extensively correlated with oxidative bursts induced by cells in an attempt to degrade and remove foreign material, and can be used to measure the oxidative stress experienced by cells (Mahida, Wu and Jewell, 1989). Additionally, ROS generation is a characteristic indicator of inflammation of the small intestine and is associated with increased gut permeability (Novak and Mollen, 2015). There were no significant increases in ROS found in cultures exposed to TiO2 and/or L. rhamnosus.
Our results suggest that TiO2 nanoparticles decrease glucose transport across the gut epithelium. There were no observed changes in overall monolayer permeability following exposure to nano-TiO2 and no significant increase in ROS formation (Figure 2C, D), suggesting that the mechanism of reduced glucose transport is changes in microvilli and, therefore, overall absorptive surface area. The changes in glucose transport are subtle, but when extended across the surface area of the human small intestine (2 × 106 cm2 compared with the 0.33 cm2 cell culture) would be magnified significantly (DeSesso and Jacobson, 2001). Changes in glucose absorption are associated with metabolic syndrome (Ludwig, 2002, Reaven, 1988, Cline, Petersen, Krssak, Shen, Hundal, Trajanoski, Inzucchi, Dresner, Rothman and Shulman, 1999). It should be noted that recognition between NP and cell membranes is largely protein corona-driven (Krüger, Schrader and Klempt, 2017, Lo Giudice, Herda, Polo and Dawson, 2016). These studies were performed in culture medium, but a simulated intestinal fluid containing pancreatin and bile extract would produce a more physiologically realistic protein corona (Brun, Barreau, Veronesi, Fayard, Sorieul, Chaneac, Carapito, Rabilloud, Mabondzo, Herlin-Boime and Carriere, 2014).
Changes in glucose absorption are mitigated in the presence of 103 CFU/mL of L. rhamnosus although the mechanism of bacterial “protection” remains unknown. Nanoparticles are known to adsorb onto the surface of bacteria (Jiang, Yang, Vachet and Xing, 2010). The presence of bacterial populations may therefore create a competitive adsorption, reducing the microvilli TiO2 bioavailability. If this is the case, areas of the GI tract where bacteria concentrations are low, such as the stomach and proximal duodenum, would be more suseptible to effects of ingested NP.
The fruit fly D. melanogaster was used to extend these in vitro findings into an in vivo system. The fly gut is composed of foregut, midgut, and hindgut; parallelling the esophagus, small intestine, and large intestine of humans (Apidianakis and Rahme, 2011). Like the human enterocytes, fly enterocytes contain apical-facing microvilli (Apidianakis and Rahme, 2011). D. melanogaster can tolerate TiO2 nanoparticles with low toxicity when fed concentrations typically found in the human diet (Jovanović, Cvetković and Mitrović, 2016). Previous work with D. melanogaster has shown some effects of TiO2 ingestion. For example, TiO2 exposure resulted in fewer eggs being laid (Philbrook, Winn, Afrooz, Saleh and Walker, 2011). The effects on development appear variable, however, as different studies have observed either no effect, (Philbrook, Winn, Afrooz, Saleh and Walker, 2011, Posgai, Cipolla-McCulloch, Murphy, Hussain, Rowe and Nielsen, 2011) an acceleration of development (this study) or a slowing of development (Lewandowski, Bentley, Yi, Rubloff, Payne and Ghodssi, 2008). The variable effects are likely due to myriad of differences between the studies, including the genetic backgrounds of the flies, the different types of TiO2 or sugar sources in the foods. Together these results suggest that the effects of TiO2 exposure will likely be influenced by the genotype of individuals and other components of their diet. Taken together, these data suggest that TiO2 has similar effects in in vitro gut cell co-cultures and the D. melanogaster gut.
CONCLUSION
An in vitro model of the small intestine including beneficial bacteria and an in vivo D. melanogaster model were used to characterize the effects of TiO2 nanoparticle exposure on glucose transport across the gut epithelium. In vitro, acute exposure to physiologically relevant TiO2 concentrations resulted in significantly decreased glucose transport across the monolayer due to microvilli damage in the absence of L. rhamnosus. These results are significant, as any change in glucose transport may be implicated in metabolic disorder. In vitro results were confirmed in vivo, where D. melanogaster fed TiO2 nanoparticles had significant changes in pupation, time to pupation, time to emergence, body size, and glucose content. Overall, these results show that the ingestion of TiO2 nanoparticles can alter metabolic homeostasis and influence normal physiological function.
Supplementary Material
ACKNOWLEDGEMENTS
Funding for this work was provided by the National Institutes of Health (1R15 ES022828), the Research Foundation of the State of New York, and by a grant to the State University of New York at Binghamton from the Howard Hughes Medical Institute through the Precollege and Undergraduate Science Education Program. We would also like to acknowledge Yizhong Liu and Fabiola Moreno-Olivas for assistance with electron microscopy.
Footnotes
DECLARATION OF INTEREST STATEMENT
None
REFERENCES
- Lomer MCE, Thompson RPH and Powell JJ. 2002. Fine and ultrafine particles of the diet: influence on the mucosal immune response and association with Crohn’s disease. Proceedings of the Nutrition Society 61:123–130. [DOI] [PubMed] [Google Scholar]
- Weir A, Westerhoff P, Fabricius L, Hristovski K and von Goetz N. 2012. Titanium Dioxide Nanoparticles in Food and Personal Care Products. Environ Sci Technol 46:2242–2250. [DOI] [PMC free article] [PubMed] [Google Scholar]
- Robichaud CO, Uyar AE, Darby MR, Zucker LG and Wiesner MR. 2009. Estimates of upper bounds and trends in nano-TiO2 production as a basis for exposure assessment. Environ Sci Technol 43:4227–4233. [DOI] [PubMed] [Google Scholar]
- Xia T, Li N and Nel AE. 2009. Potential health impact of nanoparticles. Annu Rev Public Health 30:137–150. [DOI] [PubMed] [Google Scholar]
- Maynard AD. 2006. Nanotechnology: assessing the risks. Nano Today 1:22–33. [Google Scholar]
- Wang J, Zhou G, Chen C, Yu H, Wang T, Ma Y, Jia G, Gao Y, Li B, Sun J, Li Y, Jiao F, Zhao Y and Chai Z. 2007. Acute toxicity and biodistribution of different sized titanium dioxide particles in mice after oral administration. Toxicology letters 168:176–185. [DOI] [PubMed] [Google Scholar]
- Cho WS, Kang BC, Lee JK, Jeong J, Che JH and Seok SH. 2013. Comparative absorption, distribution, and excretion of titanium dioxide and zinc oxide nanoparticles after repeated oral administration. Part Fibre Toxicol 10:9. [DOI] [PMC free article] [PubMed] [Google Scholar]
- Chow J, Lee SM, Shen Y, Khosravi A and Mazmanian SK. 2010. Host–Bacterial Symbiosis in Health and Disease. Advances in immunology 107:243–274. [DOI] [PMC free article] [PubMed] [Google Scholar]
- Wikman-Larhed A and Artursson P. 1995. Cocultures Of Human Intestinal Goblet (Ht29-H) And Absorptive (Caco-2) Cells For Studies Of Drug And Peptide Absorption. European Journal Of Pharmaceutical Sciences 3:171–183. [Google Scholar]
- Ley RE, Hamady M, Lozupone C, Turnbaugh PJ, Ramey RR, Bircher JS, Schlegel ML, Tucker TA, Schrenzel MD, Knight R and Gordon JI. 2008. Evolution of mammals and their gut microbes. Science 320:1647–1651. [DOI] [PMC free article] [PubMed] [Google Scholar]
- Guarner F and Malagelada J-R. 2003. Gut flora in health and disease. The Lancet 361:512–519. [DOI] [PubMed] [Google Scholar]
- Dizaj SM, Lotfipour F, Barzegar-Jalali M, Zarrintan MH and Adibkia K. 2014. Antimicrobial activity of the metals and metal oxide nanoparticles. Materials science & engineering C, Materials for biological applications 44:278–284. [DOI] [PubMed] [Google Scholar]
- Fondevila M, Herrer R, Casallas MC, Abecia L and Ducha JJ. 2009. Silver nanoparticles as a potential antimicrobial additive for weaned pigs. Animal Feed Science and Technology 150:259–269. [Google Scholar]
- Bergin IL, Wilding LA, Morishita M, Walacavage K, Ault AP and Axson JL. 2016. Effects of particle size and coating on toxicologic parameters, fecal elimination kinetics and tissue distribution of acutely ingested silver nanoparticles in a mouse model. Nanotoxicology 10. [DOI] [PMC free article] [PubMed] [Google Scholar]
- Chen H, Zhao R, Wang B, Cai C, Zheng L, Wang H, Wang M, Ouyang H, Zhou X, Chai Z, Zhao Y and Feng W. 2017. The effects of orally administered Ag, TiO2 and SiO2 nanoparticles on gut microbiota composition and colitis induction in mice. NanoImpact 8:80–88. [Google Scholar]
- Hadrup N, Loeschner K, Bergstrom A, Wilcks A, Gao X and Vogel U. 2012. Subacute oral toxicity investigation of nanoparticulate and ionic silver in rats. Arch Toxicol 86. [DOI] [PubMed] [Google Scholar]
- Leopold P and Perrimon N. 2007. Drosophila and the genetics of the internal milieu. Nature 450:186–188. [DOI] [PubMed] [Google Scholar]
- Baker KD and Thummel CS. 2007. Diabetic larvae and obese flies-emerging studies of metabolism in Drosophila. Cell Metab 6:257–266. [DOI] [PMC free article] [PubMed] [Google Scholar]
- Storelli G, Defaye A, Erkosar B, Hols P, Royet J and Leulier F. 2011. Lactobacillus plantarum promotes Drosophila systemic growth by modulating hormonal signals through TOR-dependent nutrient sensing. Cell Metab 14:403–414. [DOI] [PubMed] [Google Scholar]
- Shin SC, Kim SH, You H, Kim B, Kim AC, Lee KA, Yoon JH, Ryu JH and Lee WJ. 2011. Drosophila microbiome modulates host developmental and metabolic homeostasis via insulin signaling. Science 334:670–674. [DOI] [PubMed] [Google Scholar]
- Ridley EV, Wong AC, Westmiller S and Douglas AE. 2012. Impact of the resident microbiota on the nutritional phenotype of Drosophila melanogaster. PLoS One 7:e36765. [DOI] [PMC free article] [PubMed] [Google Scholar]
- Brown RP, Delp MD, Lindstedt SL, Rhomberg LR and Beliles RP. 1997. Physiological parameter values for physiologically based pharmacokinetic models. Toxicol Ind Health 13:407–484. [DOI] [PubMed] [Google Scholar]
- Guo Z, Martucci NJ, Moreno-Olivas F, Tako E and Mahler GJ. 2017. Titanium dioxide nanoparticle ingestion alters nutrient absorption in an in vitro model of the small intestine. NanoImpact 5:70–82. [DOI] [PMC free article] [PubMed] [Google Scholar]
- DeSesso JM and Jacobson CF. 2001. Anatomical and physiological parameters affecting gastrointestinal absorption in humans and rats. Food and Chemical Toxicology 39:209–228. [DOI] [PubMed] [Google Scholar]
- >U.S. Department of Agriculture and Office of Communications. (2003). Chapter 2 Profiling Food Consumption in America. Agriculture Fact Book; 2001–2002. [Google Scholar]
- Lesuffleur T, Barbat A, Dussaulx E and Zweibaum A. 1990. Growth adaptation to methotrexate of HT-29 human colon-carcinoma cells is associated with their ability to differentiate into columnar absorptive and mucus-secreting cells. Cancer Res 50:6334–6343. [PubMed] [Google Scholar]
- Mahler GJ, Shuler ML and Glahn RP. 2009. Characterization of Caco-2 and HT29-MTX cocultures in an in vitro digestion/cell culture model used to predict iron bioavailability. The Journal of Nutritional Biochemistry 20:494. [DOI] [PubMed] [Google Scholar]
- Tong T, Binh CT, Kelly JJ, Gaillard JF and Gray KA. 2013. Cytotoxicity of commercial nano-TiO2 to Escherichia coli assessed by high-throughput screening: effects of environmental factors. Water Res 47:2352–2362. [DOI] [PubMed] [Google Scholar]
- Blodgett AB, Kothinti RK, Kamyshko I, Petering DH, Kumar S and Tabatabai NM. 2011. A fluorescence method for measurement of glucose transport in kidney cells. Diabetes technology & therapeutics 13:743–751. [DOI] [PMC free article] [PubMed] [Google Scholar]
- Tallkvist J, Bowlus CL and Lonnerdal B. 2000. Functional and molecular responses of human intestinal Caco-2 cells to iron treatment. Am J Clin Nutr 72:770–775. [DOI] [PubMed] [Google Scholar]
- Kipp H, Khoursandi S, Scharlau D and Kinne RK. 2003. More than apical: Distribution of SGLT1 in Caco-2 cells. American journal of physiology Cell physiology 285:C737–749. [DOI] [PubMed] [Google Scholar]
- Alzaid F, Cheung HM, Preedy VR and Sharp PA. 2013. Regulation of glucose transporter expression in human intestinal Caco-2 cells following exposure to an anthocyanin-rich berry extract. PLoS One 8:e78932. [DOI] [PMC free article] [PubMed] [Google Scholar]
- Becker C, Hammerle-Fickinger A, Riedmaier I and Pfaffl MW. 2010. mRNA and microRNA quality control for RT-qPCR analysis. Methods (San Diego, Calif) 50:237–243. [DOI] [PubMed] [Google Scholar]
- Livak KJ and Schmittgen TD. 2001. Analysis of relative gene expression data using real-time quantitative PCR and the 2(-Delta Delta C(T)) Method. Methods (San Diego, Calif) 25:402–408. [DOI] [PubMed] [Google Scholar]
- Schneider CA, Rasband WS and Eliceiri KW. 2012. NIH Image to ImageJ: 25 years of image analysis. Nat Meth 9:671–675. [DOI] [PMC free article] [PubMed] [Google Scholar]
- McGraw LA, Fiumera AC, Ramakrishnan M, Madhavarapu S, Clark AG and Wolfner MF. 2007. Larval rearing environment affects several post-copulatory traits in Drosophila melanogaster. Biology Lett 3:607–610. [DOI] [PMC free article] [PubMed] [Google Scholar]
- Musselman LP, Fink JL, Narzinski K, Ramachandran PV, Hathiramani SS, Cagan RL and Baranski TJ. 2011. A high-sugar diet produces obesity and insulin resistance in wild-type Drosophila. Disease models & mechanisms 4:842–849. [DOI] [PMC free article] [PubMed] [Google Scholar]
- Team RC. (2014). R: A language and environment for statistical computing. R Foundation for Statistical Computing, Vienna, Austria: 2013. [Google Scholar]
- Hothorn T, Bretz F and Westfall P. 2008. Simultaneous inference in general parametric models. Biometrical journal Biometrische Zeitschrift 50:346–363. [DOI] [PubMed] [Google Scholar]
- Mudunkotuwa IA and Grassian VH. 2015. Biological and environmental media control oxide nanoparticle surface composition: the roles of biological components (proteins and amino acids), inorganic oxyanions and humic acid. Environmental Science: Nano 2:429–439. [Google Scholar]
- Tenzer S, Docter D, Kuharev J, Musyanovych A, Fetz V, Hecht R, Schlenk F, Fischer D, Kiouptsi K, Reinhardt C, Landfester K, Schild H, Maskos M, Knauer SK and Stauber RH. 2013. Rapid formation of plasma protein corona critically affects nanoparticle pathophysiology. Nat Nano 8:772–781. [DOI] [PubMed] [Google Scholar]
- Walter E, Janich S, Roessler BJ, Hilfinger JM and Amidon GL. 1996. HT29-MTX/Caco-2 cocultures as an in vitro model for the intestinal epithelium: in vitro-in vivo correlation with permeability data from rats and humans. Journal of pharmaceutical sciences 85:1070–1076. [DOI] [PubMed] [Google Scholar]
- Alves MBR, Celeghini ECC, Andrade AFC, Arruda RP, Batissaco L and Almeida TG. 2015. Cellrox deep red® for the detection of oxidative stress in ram sperm by in vitro induction. Animal Reproduction; Animal Reproduction, v 11, n 3 (2014). [Google Scholar]
- Pielmeier U, Andreassen S, Nielsen BS, Chase JG and Haure P. 2010. A simulation model of insulin saturation and glucose balance for glycemic control in ICU patients. Computer methods and programs in biomedicine 97:211–222. [DOI] [PubMed] [Google Scholar]
- Koeneman BA, Zhang Y, Westerhoff P, Chen Y, Crittenden JC and Capco DG. 2010. Toxicity and cellular responses of intestinal cells exposed to titanium dioxide. Cell Biology and Toxicology 26:225–238. [DOI] [PubMed] [Google Scholar]
- Borgström B, Dahlqvist A, Lundh G and Sjövall J. 1957. Studies of Intestinal Digestion and Absorption in the Human. J Clin Invest 36:1521–1536. [DOI] [PMC free article] [PubMed] [Google Scholar]
- O’Hara AM and Shanahan F. 2006. The gut flora as a forgotten organ. EMBO Rep 7:688–693. [DOI] [PMC free article] [PubMed] [Google Scholar]
- Sekirov I, Russell SL, Antunes LCM and Finlay BB. 2010. Gut Microbiota in Health and Disease. Physiological Reviews 90:859–904. [DOI] [PubMed] [Google Scholar]
- Muir A and Hopfer U. 1985. Regional specificity of iron uptake by small intestinal brush-border membranes from normal and iron-deficient mice. Am J Physiol-Gastr L 248:G376–G379. [DOI] [PubMed] [Google Scholar]
- Lee HH, Prasad AS, Brewer GJ and Owyang C. 1989. Zinc absorption in human small intestine. American Journal of Physiology - Gastrointestinal and Liver Physiology 256:G87–G91. [DOI] [PubMed] [Google Scholar]
- Francavilla R, Miniello V, Magista AM, De Canio A, Bucci N, Gagliardi F, Lionetti E, Castellaneta S, Polimeno L, Peccarisi L, Indrio F and Cavallo L. 2010. A randomized controlled trial of Lactobacillus GG in children with functional abdominal pain. Pediatrics 126:e1445–1452. [DOI] [PubMed] [Google Scholar]
- Wang Y, Liu Y, Sidhu A, Ma Z, McClain C and Feng W. 2012. Lactobacillus rhamnosus GG culture supernatant ameliorates acute alcohol-induced intestinal permeability and liver injury. Am J Physiol Gastrointest Liver Physiol 303:G32–41. [DOI] [PMC free article] [PubMed] [Google Scholar]
- Johnson-Henry KC, Donato KA, Shen-Tu G, Gordanpour M and Sherman PM. 2008. Lactobacillus rhamnosus Strain GG Prevents Enterohemorrhagic Escherichia coli O157:H7-Induced Changes in Epithelial Barrier Function. Infection and Immunity 76:1340–1348. [DOI] [PMC free article] [PubMed] [Google Scholar]
- Seth A, Yan F, Polk D and Rao RK. 2008. Probiotics ameliorate the hydrogen peroxide-induced epithelial barrier disruption by a PKC- and MAP kinase-dependent mechanism. American journal of physiology Gastrointestinal and liver physiology 294:G1060–G1069. [DOI] [PMC free article] [PubMed] [Google Scholar]
- Kubacka A, Diez MS, Rojo D, Bargiela R, Ciordia S, Zapico I, Albar JP, Barbas C, Martins dos Santos VAP, Fernández-García M and Ferrer M. 2014. Understanding the antimicrobial mechanism of TiO(2)-based nanocomposite films in a pathogenic bacterium. Scientific Reports 4:4134. [DOI] [PMC free article] [PubMed] [Google Scholar]
- Fu G, Vary PS and Lin CT. 2005. Anatase TiO2 nanocomposites for antimicrobial coatings. The journal of physical chemistry B 109:8889–8898. [DOI] [PubMed] [Google Scholar]
- Barnes RJ, Molina R, Xu J, Dobson PJ and Thompson IP. 2013. Comparison of TiO2 and ZnO nanoparticles for photocatalytic degradation of methylene blue and the correlated inactivation of gram-positive and gram-negative bacteria. Journal of Nanoparticle Research 15:1432. [Google Scholar]
- Narai A, Arai S and Shimizu M. 1997. Rapid decrease in transepithelial electrical resistance of human intestinal Caco-2 cell monolayers by cytotoxic membrane perturbents. Toxicol In Vitro 11:347. [DOI] [PubMed] [Google Scholar]
- Mahida YR, Wu KC and Jewell DP. 1989. Respiratory burst activity of intestinal macrophages in normal and inflammatory bowel disease. Gut 30:1362–1370. [DOI] [PMC free article] [PubMed] [Google Scholar]
- Novak EA and Mollen KP. 2015. Mitochondrial dysfunction in inflammatory bowel disease. Frontiers in Cell and Developmental Biology 3:62. [DOI] [PMC free article] [PubMed] [Google Scholar]
- Ludwig DS. 2002. The glycemic index: Physiological mechanisms relating to obesity, diabetes, and cardiovascular disease. JAMA 287:2414–2423. [DOI] [PubMed] [Google Scholar]
- Reaven GM. 1988. Role of Insulin Resistance in Human Disease. Diabetes 37:1595–1607. [DOI] [PubMed] [Google Scholar]
- Cline GW, Petersen KF, Krssak M, Shen J, Hundal RS, Trajanoski Z, Inzucchi S, Dresner A, Rothman DL and Shulman GI. 1999. Impaired Glucose Transport as a Cause of Decreased Insulin-Stimulated Muscle Glycogen Synthesis in Type 2 Diabetes. New England Journal of Medicine 341:240–246. [DOI] [PubMed] [Google Scholar]
- Krüger K, Schrader K and Klempt M. 2017. Cellular Response to Titanium Dioxide Nanoparticles in Intestinal Epithelial Caco-2 Cells is Dependent on Endocytosis-Associated Structures and Mediated by EGFR. Nanomaterials 7. [DOI] [PMC free article] [PubMed] [Google Scholar]
- Lo Giudice MC, Herda LM, Polo E and Dawson KA. 2016. In situ characterization of nanoparticle biomolecular interactions in complex biological media by flow cytometry. Nature Communications 7:13475. [DOI] [PMC free article] [PubMed] [Google Scholar]
- Brun E, Barreau F, Veronesi G, Fayard B, Sorieul S, Chaneac C, Carapito C, Rabilloud T, Mabondzo A, Herlin-Boime N and Carriere M. 2014. Titanium dioxide nanoparticle impact and translocation through ex vivo, in vivo and in vitro gut epithelia. Part Fibre Toxicol 11:13. [DOI] [PMC free article] [PubMed] [Google Scholar]
- Jiang W, Yang K, Vachet RW and Xing B. 2010. Interaction between oxide nanoparticles and biomolecules of the bacterial cell envelope as examined by infrared spectroscopy. Langmuir : the ACS journal of surfaces and colloids 26:18071–18077. [DOI] [PubMed] [Google Scholar]
- Apidianakis Y and Rahme LG. 2011. Drosophila melanogaster as a model for human intestinal infection and pathology. Disease Models & Mechanisms 4:21–30. [DOI] [PMC free article] [PubMed] [Google Scholar]
- Jovanović B, Cvetković VJ and Mitrović TL. 2016. Effects of human food grade titanium dioxide nanoparticle dietary exposure on Drosophila melanogaster survival, fecundity, pupation and expression of antioxidant genes. Chemosphere 144:43–49. [DOI] [PubMed] [Google Scholar]
- Philbrook NA, Winn LM, Afrooz ARMN, Saleh NB and Walker VK. 2011. The effect of TiO2 and Ag nanoparticles on reproduction and development of Drosophila melanogaster and CD-1 mice. Toxicol Appl Pharm 257:429–436. [DOI] [PubMed] [Google Scholar]
- Posgai R, Cipolla-McCulloch CB, Murphy KR, Hussain SM, Rowe JJ and Nielsen MG. 2011. Differential toxicity of silver and titanium dioxide nanoparticles on Drosophila melanogaster development, reproductive effort, and viability: Size, coatings and antioxidants matter. Chemosphere 85:34–42. [DOI] [PubMed] [Google Scholar]
- Lewandowski AT, Bentley WE, Yi H, Rubloff GW, Payne GF and Ghodssi R. 2008. Towards area-based in vitro metabolic engineering: Assembly of Pfs enzyme onto patterned microfabricated chips. Biotechnol Prog 24:1042–1051. [DOI] [PubMed] [Google Scholar]
Associated Data
This section collects any data citations, data availability statements, or supplementary materials included in this article.