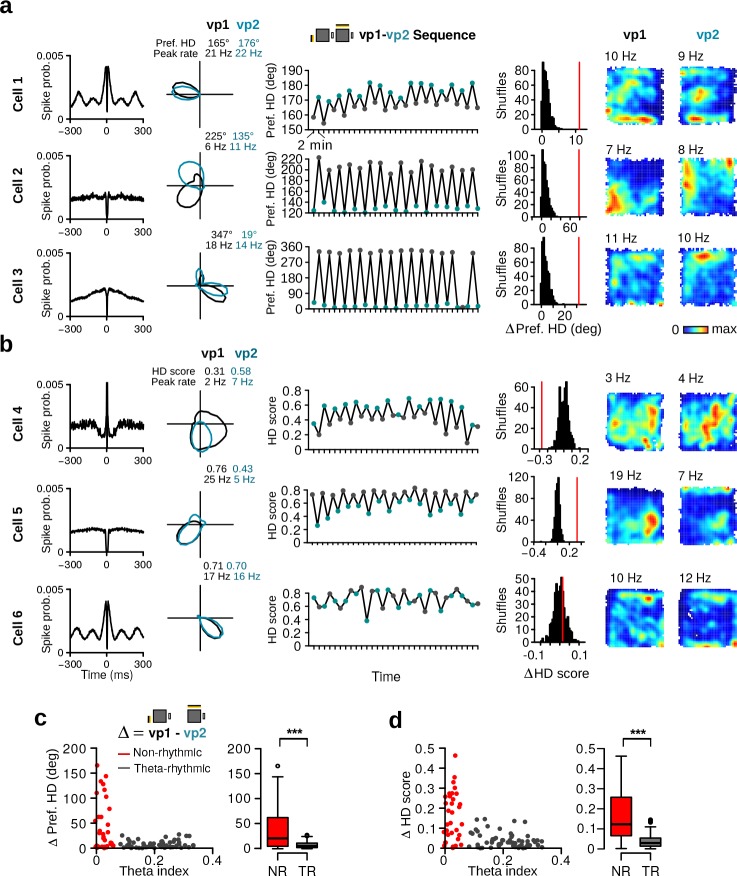
Figure 4. Alteration of preferred HD and HD selectivity following visual landmark manipulation.
(a) Examples of three HD cells that changed their preferred direction between vp1 and vp2 trials. One cell per row. From left to right: Spike-time autocorrelation, HD tuning curves during vp1 (black) and vp2 (blue) trials, preferred HD during individual 2-min trials, observed change in preferred HD between vp1 and vp2 trials (red line) with distribution of preferred HD changes when trial labels were reassigned randomly, and firing rate maps during vp1 and vp2 trials. Numbers above the firing rate maps are peak firing rates. (b) Examples of three HD cells with different HD selectivity during vp1 and vp2 trials. From left to right: Same as in a) but the third and forth columns show HD scores instead of preferred directions. (c) Left: Scatter plot of the theta index of each HD cell against its change in preferred HD. Right: Change in preferred HD between vp1 and vp2 trials for non-rhythmic and theta-rhythmic cells. (d) Same as (c) but for HD scores. ***: p 0.001.
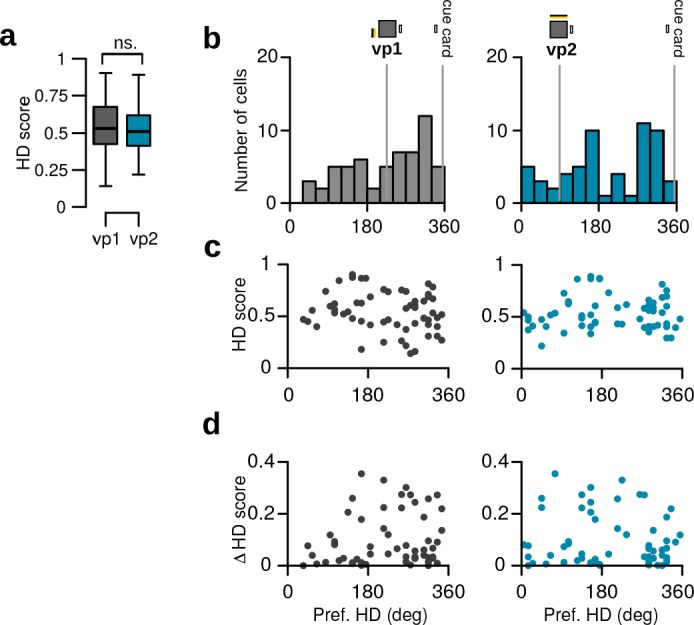
Figure 4—figure supplement 1. Distribution of changes in HD tuning.

Figure 4—figure supplement 2. Properties of HD cells changing their preferred HD between vp1 and vp2 trials (N = 59 cells).


