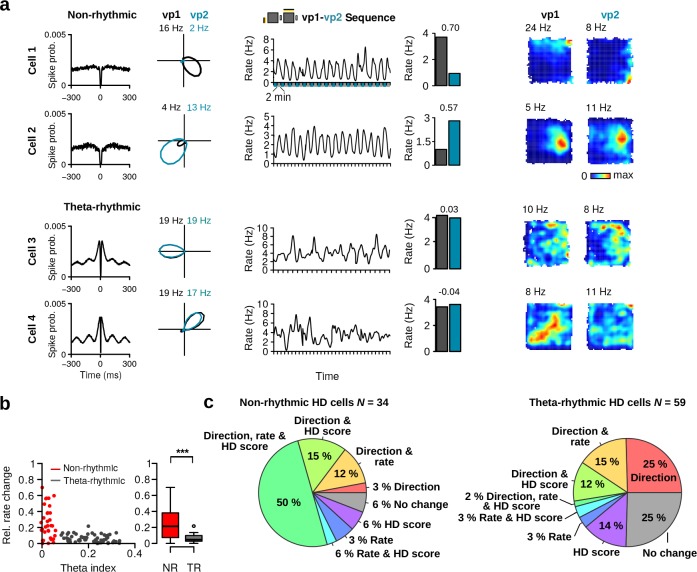
Figure 5. Firing rate changes induced by visual landmark manipulation.
(a) For each cell from left to right: Spike-time autocorrelation, HD tuning curves during vp1 (black) and vp2 (blue) trials, instantaneous firing rates (standard deviation Gaussian kernel 25 s, window size 1 s) as a function of time, mean firing rate during vp1 and vp2 trials, and firing rate maps during vp1 and vp2 trials. Numbers above the histograms indicate the relative change in rate. Numbers above the firing rate maps are peak firing rates. (b) Left: Scatter plot of the theta index of each HD cell against its relative firing rate change across trial types. Right: Relative firing rate change between vp1 and vp2 trials for non-rhythmic and theta-rhythmic HD cells. (c) Pie charts illustrating the percentages of non-rhythmic (left) and theta-rhythmic (right) HD cells with significant changes in preferred direction, HD score or mean firing rate. ***: P 0.001.


