

Abstract
Objective:
SBP variability may be a target for mitigating end-organ damage associated with vascular disease. We evaluated the relationship between increased SBP variability and risk of incident diabetic foot ulceration.
Methods:
Using a nested case-control design, we followed patients diagnosed with diabetes and treated within the US Department of Veterans Affairs Healthcare system for development of a diabetic foot ulcer (event) between 2006 and 2010. Each case was randomly matched to up to five controls based on age, sex, race/ethnicity, and calendar time. SBP variability was computed using at least three blood pressure measurements from the year preceding the event. The association between SBP variability and foot ulceration was examined using conditional logistic regression. Potential protective effects of calcium channel blockers, which blunt SBP variability, were also explored.
Results:
The study sample included 51 111 cases and 129 247 controls. Compared with those in quartile 1 (lowest variability), patients in quartiles 2–4 had higher adjusted odds ratios for diabetic foot ulcer development: 1.11 (95% CI 1.07–1.16), 1.20 (95% CI 1.15–1.25), 1.29 (95% CI 1.24–1.34) (P for trend <0.001). Calcium channel blockers were associated with reduced risks of ulceration for those without peripheral vascular disease (OR = 0.87, 95% CI 0.84–0.90, P< 0.001) or neuropathy (OR = 0.85, 95% CI 0.82–0.89, P< 0.001) in adjusted subgroup analyses.
Conclusion:
This study describes a graded relationship between SBP variability and risk of diabetic foot ulceration, providing a potential new and modifiable target to reduce this common complication.
Keywords: diabetic complication, foot ulceration, SBP variability
INTRODUCTION
Excessive SBP variability may offer a potential new target for mitigating end-organ damage associated with microvascular and macrovascular disease, such as diabetic foot ulcers [1—6]. Foot ulcers typically arise whenever a minor injury goes unnoticed because of peripheral neuropathy (a microvascular complication) and fails to heal because of limb ischemia (a macrovascular complication) [7,8]. Diabetic foot ulcers are one of the most common, yet neglected, manifestations of vascular disease [9]. Each year in the United States, an estimated 1.2 million patients develop a diabetic foot ulcer [10,11]. In 2010, inpatient costs for diabetic foot ulcer treatment exceeded $790 million, and are trending upwards [12]. Emergency room care is also on the rise, with a 28% increase in the number of visits for treatment of diabetic foot ulcers [13]. Healthcare providers need novel targets to reduce the risk of foot ulceration and curb the burden of this common complication.
Over half of the 24 million Americans with diabetes are also hypertensive [10,14]. Blood pressure (BP) control has both microvascular and macrovascular benefits in patients with diabetes [15]. However, focusing solely on reducing the absolute SBP (≤130mmHg) may have diminishing returns for patients with diabetes [16]. Targeting SBP variability in addition to the absolute value, may help reduce the high risk of vascular complications faced by patients with diabetes. Increased SBP variability has previously been linked to myocardial infarction, stroke, peripheral neuropathy, retinopathy, and limb amputation [1—7]. The goal of this study is to determine whether the risk of incident diabetic foot ulceration increases as SBP variability increases. SBP variability is modifiable and may provide a new therapeutic target for reducing diabetic foot ulcers at a time when their incidence is rising relatively unchecked [12,13].
METHODS
Study design and data sources
We used a nested case-control design to account for the time-dependent nature of SBP variability and to minimize selection bias [17,18]. We selected cases and controls from a retrospective cohort of patients with diabetes. We defined cases as those patients who developed incident diabetic foot ulcers. Controls were required to be ulcer-free at least until the date when their corresponding case was diagnosed with a diabetic foot ulcer (index date). Controls could subsequently develop a foot ulcer and be included at that time as a case. Data were obtained from the Department of Veterans Affairs (VA) National Patient Care Database, the VA Decision Support System Pharmacy Datasets and National Clinical Data Extracts, the VA Corporate Data Warehouse, and the Centers for Medicare and Medicaid Services Medicare (Medicare) claims files, including Part D event files, all of which are available through the VA Information Resource Center. A table of ICD-9-CM codes used to generate variables is included in the Supplemental Digital Content 1, http://links.lww.com/HJH/A942. The Hines VA Hospital Institutional Review Board approved this study.
Cohort
The cohort from which we selected cases and controls included all patients with diabetes treated in the VA healthcare system during the fiscal year 2003 (1 October 2002 to 30 September 2003; all years henceforth are fiscal). Our cohort consisted of patients with diabetes who had one or more diabetic medication prescriptions filled in 2003, or at least one hospitalization or at least two outpatient visits with a diagnostic code for diabetes recorded in VA or Medicare files during 2002–2003, a definition with 93% sensitivity and 97% specificity [19]. We imposed a 2-year run-in period to exclude patients diagnosed with a diabetic foot ulcer or who died before 2006. The cohort was followed from 1 October 2005 (baseline) until 30 September 2010.
Cases
We defined cases as those individuals in the cohort who were diagnosed with an incident diabetic foot ulcer during the 5-year follow-up period [20,21]. The cohort run-in period allowed us to identify incident, rather than prevalent, foot ulcers. Foot ulceration was identified using validated ICD-9-CM codes present in in-patient and out-patient datasets (n = 85 086) [21]. For patients with multiple foot ulcerations, either because of recurrence or development on the contralateral foot, we used the first diagnosis only.
Controls
Controls were selected from all individuals in the cohort who did not develop an incident foot ulcer by the corresponding case’s index date. Controls were matched for age, sex, race/ethnicity, and calendar time. Up to five controls were randomly selected for each case (n = 340 344; average four controls per case) [17,18].
SBP variability
All out-patient BP measurements obtained in the VA system (excluding the emergency room) in the 365 days preceding the index date were considered. We excluded measures taken between 2200 and 0800 h because they were most likely measured during hospital stays or emergency room visits. Those with SBP readings between 50 and 300 mmHg and those with DBP readings between 30 and 180 mmHg were accepted. Multiple BP readings taken on the same day were averaged and counted as one reading. For patients with more than 12 BP measurements during the 365 days preceding the index date, we randomly selected 12 to use when calculating the mean SBP and SBP variability, in accordance with Rothwell et al.’s [3] established method for calculating SBP variability. Cases and controls with less than three accepted BP measurements in the preceding year were excluded (leaving n = 52748 cases, 202 302 controls). After these exclusions, we dropped 1637 cases because of lack of controls and 73 055 controls missing a case. The final sample included 180 358 individuals, of whom 51111 were cases and 129 247 were controls (Fig. 1).
FIGURE 1.
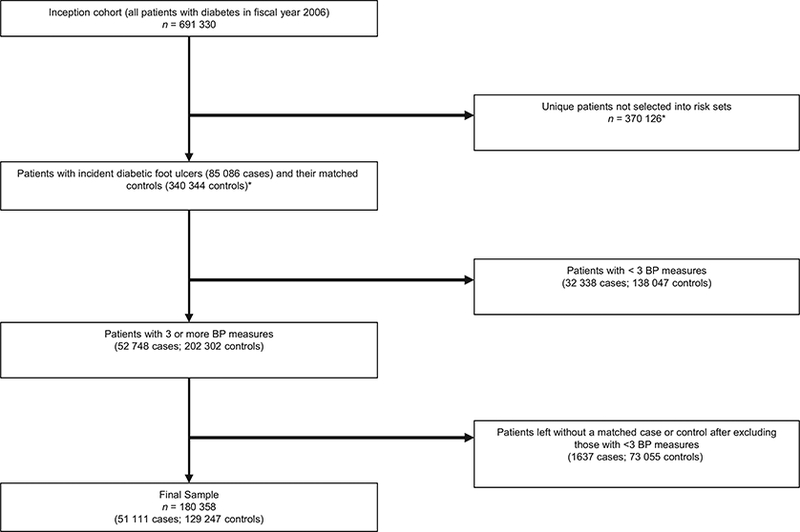
Sample flow diagram. *As the same individual could be selected into multiple risk sets as both cases and controls, we reported the unique number of excluded patients from the inception cohort. For this reason, the numbers in the two boxes with asterisks do not add up to the total number in the inception cohort.
We computed the within-subject mean and SD of SBP and DBPs based on all accepted BP measurements. We calculated the SBP variability independent of the mean because mean and SD in BP tend to be correlated, such that persons with higher BP readings tend to have more variability [3,22]. Calculating SBP variability in this manner allows any subsequent associations to be attributed to the SBP variability rather than the SBP mean.
Covariates
We identified covariates known to be associated with the risk of diabetic foot ulcers to reduce confounding [23–26]. Demographic variables were assessed at baseline only. All other variables were time-dependent and assessed in the 365-day period preceding the index date. When more than one measurement or result was available, we used the average value. When no measurement or result was available, we categorized the value as ‘unknown’ and kept the patients in the analysis. When assessing medications, we defined patients as users of a medication if they had received at least a 30-day supply in the preceding year. For antihypertensive medications, we separately identified the use of calcium channel blockers, beta blockers, and all other antihypertensive medications. These groups are not mutually exclusive because patients could be on combination therapies.
Demographic factors
As we matched cases and controls on age, sex, and race/ ethnicity, these were not included in the regression models. The only demographic variable we included in the model was baseline marital status.
Diabetes-related variables
We estimated diabetes severity using the following metrics: duration of diabetes, hemoglobin A1C level, hypoglycemic medications, and diabetes complications such as neuropathy. We determined diabetes duration by identifying the first time, between 1997 and the baseline, for which an ICD-9-CM code for diabetes was recorded. We used the year 1997 because this is when VA electronic medical records data are available for research. We assessed the following diabetes complications as a measure of diabetes severity and risk factors for foot ulceration: renal failure, retinopathy, neuropathy, Charcot arthropathy, and the presence of a foot deformity [23,25,26]. We included the number of podiatry clinic visits in the preceding year to help account for characteristics that may have placed the patient at high risk of ulceration but may not have been captured in claims coding.
Variables related to vascular disease
We included the following parameters associated with vascular disease because this is also a major risk factor for ulceration: chronic venous stasis, peripheral vascular disease, low-density lipoprotein (LDL) cholesterol values, and use of cholesterol-lowering agents [23,24].
Other systemic factors
We included BMI, calculated using measured heights and weights, and serum albumin levels as a marker of overall nutritional status [27]. To further ensure that any measured differences were attributed to SBP variability, rather than the SBP mean, we controlled for the mean SBP in all adjusted models.
Statistical analysis
We examined the association between SBP variability and development of a diabetic foot ulcer using conditional logistic regression to account for the matched case-control design. To model SBP variability, cases and controls were divided into quartiles with quartile 1 as the lowest variability group. We obtained odds ratios (ORs) and 95% confidence intervals (CIs) from unadjusted and adjusted models that included all covariates described above.
We conducted sensitivity analyses to test whether any relationship between SBP variability and foot ulceration was influenced by the presence of hypertension, or the number of BP readings used to calculate variability. Hypertension was defined as a mean, absolute blood pressure greater than or equal to 130/80 mmHg or use of antihypertensive agents. Participants were categorized as having six or fewer (versus seven or more) BP readings used to calculate their SBP variability. Interaction terms between SBP variability and hypertenstion, or the number of BP readings were entered into the main, adjusted model.
We also conducted a secondary analysis to explore the possible protective effects of calcium channel blockers, which have been associated with reduced blood pressure variability and may moderate the effect of SBP variability on foot ulceration [22,28]. If vascular and neurologic damage mediates the association between SBP variability and diabetic foot complications, as we previously hypothesized, then taking calcium channel blockers may be protective for patients who have not yet developed vascular or neurologic deficits [4]. However, this drug class would be less likely to reduce the risk of foot ulcers for patients with existing peripheral vascular disease or neuropathy. To test our hypothesis, we constructed three models. First, we added use of antihypertensives (calcium channel blockers, beta blockers, or other antihypertensives) to the main model. We expected that calcium channel blocker use would protect against foot ulcers, but not use of beta blockers or other antihypertensive medications. Second, we added an interaction term between peripheral vascular disease and our three antihypertensive drug class variables. Third, we added an interaction term between neuropathy and our antihypertensive drug classes. We expected that the interaction terms would not meet statistical significance, indicating that any protective association of the antihypertensive seen in the first model would be limited largely to patients without peripheral vascular disease (model 2) or neuropathy (model 3). All analysis was conducted using SAS 9.4 (SAS Institute, Cary, North Carolina, USA) and Stata SE 14 (StataCorp, College Station, Texas, USA).
RESULTS
Over half the sample was at least 55 years old; 98.3% were men, and 73.7% were non-Hispanic whites. Cases (n = 51111) and controls (n = 129 247) were well matched in terms of age, sex, and race/ethnicity (Supplemental Digital Content 2, http://links.lww.com/HJH/A942). Cases tended to have more BP measures than controls (7.8 vs 7.0, P< 0.001). Cases tended to have more poorly controlled diabetes despite more aggressive hypoglycemic regimens than controls. Compared with controls, they were also more likely to be diagnosed with peripheral vascular disease despite lower LDL cholesterol values. Cases also were more likely to have hypoalbuminemia and chronic venous stasis (Table 1). These comorbidities were associated with increased odds of foot ulceration. Cases also had a shorter duration of diabetes than controls, which was associated with increased odds of foot ulceration in this study. All of these variables remained significant in the adjusted models.
Table 1.
Estimated odds ratios for the association between SBP variability quartiles and development of a diabetic foot ulcer
| Unadjusted model | Adjusted modela | ||||||
|---|---|---|---|---|---|---|---|
| Independent variable | Cases, n=51111 (%) | Controls, n=129247 (%) | Crude incidence (%) | OR (95% CI) | P value | OR (95% CI) | P value |
| SBP variability quartiles | |||||||
| 1 (lowest) | 10296 (20.1%) | 34 794 (26.9%) | 22.8 | Ref | Ref | ||
| 2 | 11 894 (23.3%) | 33 195 (25.7%) | 26.4 | 1.238 (1.200–1.277) | <0.001 | 1.114 (1.071–1.159) | <0.001 |
| 3 | 13 440 (26.3%) | 31 650 (24.5%) | 29.8 | 1.467 (1.423–1.512) | <0.001 | 1.199 (1.153–1.247) | <0.001 |
| 4 (highest) | 15 481 (30.3%) | 29 608 (22.9%) | 34.3 | 1.799 (1.746–1.854) | <0.001 | 1.286 (1.236–1.337) | <0.001 |
| Mean SBP (mmHg) (SD) | 135.0 (15.0) | 135.5 (13.8) | - | 0.998 (0.997–0.999) | <0.001 | 0.997 (0.996–0.998) | <0.001 |
| Married | 30406 (59.5%) | 81 291 (62.9%) | 27.2 | 0.839 (0.821–0.857) | <0.001 | 0.838 (0.815–0.862) | <0.001 |
| Duration of diabetes (years) | |||||||
| <6 | 8190 (16.0%) | 15 482 (12.0%) | 34.6 | Ref | Ref | ||
| 6–10 | 32 800 (64.2%) | 81 139 (62.8%) | 28.8 | 0.631 (0.609–0.654) | <0.001 | 0.811 (0.774–0.849) | <0.001 |
| ≥10 | 10121 (19.8%) | 32 626 (25.2%) | 23.7 | 0.416 (0.397–0.436) | <0.001 | 0.710 (0.668–0.755) | <0.001 |
| Hemoglobin A1C (%) | |||||||
| <7 | 18519 (36.2%) | 51 978 (40.2%) | 26.3 | Ref | Ref | ||
| 7–8.9 | 18662 (36.5%) | 46 587 (36.0%) | 28.6 | 1.155 (1.127–1.184) | <0.001 | 1.051 (1.017–1.087) | 0.003 |
| ≥9 | 7459 (14.6%) | 13 675 (10.6%) | 35.3 | 1.699 (1.641–1.758) | <0.001 | 1.431 (1.367–1.499) | <0.001 |
| Unknown | 6471 (12.7%) | 17007 (13.2%) | 27.6 | 1.059 (1.023–1.095) | 0.001 | 1.026 (0.977–1.077) | 0.298 |
| Hypoglycemic medications | |||||||
| None | 9241 (18.1%) | 27 811 (21.5%) | 24.9 | Ref | Ref | ||
| Oral only | 17 553 (34.3%) | 58 244 (45.1%) | 23.2 | 0.940 (0.912–0.970) | <0.001 | 1.069 (1.025–1.115) | 0.002 |
| Insulin only | 11 967 (23.4%) | 17 272 (13.4%) | 40.9 | 2.288 (2.208–2.371) | <0.001 | 1.352 (1.284–1.422) | <0.001 |
| Insulin and oral | 12 350 (24.2%) | 25 920 (20.1%) | 32.3 | 1.625 (1.570–1.683) | <0.001 | 1.354 (1.288–1.424) | <0.001 |
| Renal failure | 15 225 (29.8%) | 3186 (2.5%) | 82.7 | 16.837 (16.085–17.624)<0.001 | 8.334 (7.916–8.774) | <0.001 | |
| Retinopathy | 16279 (31.9%) | 25 294 (19.6%) | 39.2 | 1.949 (1.903–1.996) | <0.001 | 1.253 (1.212–1.294) | <0.001 |
| Neuropathy | 20497 (40.1%) | 27 101 (21.0%) | 43.1 | 2.541 (2.483–2.601) | <0.001 | 1.546 (1.499–1.594) | <0.001 |
| Charcot arthropathy | 507 (1.0%) | 222 (0.2%) | 69.5 | 6.139 (5.227–7.211) | <0.001 | 2.721 (2.220–3.335) | <0.001 |
| Foot deformity | 2101 (4.1%) | 2909 (2.3%) | 41.9 | 1.883 (1.777–1.996) | <0.001 | 1.261 (1.166–1.364) | <0.001 |
| Number of podiatry visits (SD) | 2.38 (4.12) | 1.03 (2.34) | 1.181 (1.176–1.186) | <0.001 | 1.096 (1.090–1.102) | <0.001 | |
| BMI (kg/m2) | |||||||
| <25 | 7653 (15.0%) | 16 627 (12.9%) | 31.5 | Ref | Ref | ||
| 25–29.9 | 13 342 (26.1%) | 37 435 (29.0%) | 26.3 | 0.783 (0.756–0.810) | <0.001 | 0.846 (0.808–0.886) | <0.001 |
| 30–34.9 | 11 076 (21.7%) | 31 612 (24.5%) | 25.9 | 0.793 (0.765–0.822) | <0.001 | 0.826 (0.787–0.866) | <0.001 |
| 35–39.9 | 6127 (12.0%) | 15 278 (11.8%) | 28.6 | 0.938 (0.899–0.978) | 0.003 | 0.904 (0.856–0.956) | <0.001 |
| ≥40 | 5252 (10.3%) | 9204 (7.1%) | 36.3 | 1.379 (1.317–1.443) | <0.001 | 1.199 (1.128–1.273) | <0.001 |
| Unknown | 7661 (15.0%) | 19 091 (14.8%) | 28.6 | 0.902 (0.867–0.937) | <0.001 | 0.912 (0.866–0.961) | <0.001 |
| Serum albumin <3.5mg/dL | 10210 (20.0%) | 11185 (8.7%) | 47.7 | 2.687 (2.607–2.769) | <0.001 | 1.761 (1.691–1.835) | <0.001 |
| Chronic venous stasis | 7375 (14.4%) | 5072 (3.9%) | 59.3 | 4.057 (3.902–4.218) | <0.001 | 2.762 (2.625–2.907) | <0.001 |
| Peripheral vascular disease | 16097 (31.5%) | 3219 (2.5%) | 83.3 | 17.989 (17.180–18.835)<0.001 | 9.291 (8.830–9.777) | <0.001 | |
| LDL cholesterol (mg/dl) | |||||||
| <100 | 31173 (61.0%) | 77 403 (59.9%) | 28.7 | Ref | Ref | ||
| 100–129.9 | 6640 (13.0%) | 19 423 (15.0%) | 25.5 | 0.862 (0.835–0.889) | <0.001 | 0.982 (0.944–1.023) | 0.390 |
| 130–159.9 | 2341 (4.6%) | 6962 (5.4%) | 25.2 | 0.867 (0.825–0.911) | <0.001 | 0.987 (0.927–1.052) | 0.693 |
| ≥160 | 1039 (2.0%) | 3056 (2.4%) | 25.4 | 0.883 (0.821–0.950) | 0.001 | 0.936 (0.853–1.028) | 0.167 |
| Unknown | 9918 (19.4%) | 22 403 (17.3%) | 30.7 | 1.084 (1.054–1.115) | <0.001 | 1.104 (1.061–1.149) | <0.001 |
| Cholesterol-lowering medication | 36570 (71.6%) | 943 (73.4%) | 27.8 | 0.907 (0.885–0.930) | <0.001 | 0.813 (0.786–0.841) | <0.001 |
LDL, low density lipoprotein; SBP, systolic blood pressure.
The adjusted model includes all covariates shown in the table.
Mean SBP was slightly lower for cases than controls (135.0±15.0 versus 135.5±13.8mmHg, P <0.001). Mean (median) within-subject SDs of SBP were 4.5±2.3 (4.9)), 9.5±1.2 (9.5), 13.2±1.4 (13.1), and 20.3±4.7 (18.9)) mmHg for patients in quartiles 1–4, respectively. The proportions of all patients in each quartile who were cases, or the crude incidence rates, were: 22.8, 26.4, 29.8, and 34.3% for quartiles 1–4, respectively (Table 1).
Both the unadjusted and adjusted conditional logistic regression results showed a significant graded relationship between SBP variability and the risk of developing an incident diabetic foot ulcer. Compared with patients with the lowest SBP variability (quartile 1), patients in quartiles 2–4 had significantly higher adjusted ORs for development of a diabetic foot ulcer: 1.11 (95% CI 1.07–1.16), 1.20 (95% CI 1.15–1.25), and 1.29 (95% CI 1.24–1.34; all P values <0.001). Compared with those in quartile 2, patients in quartile 3 had about 8% higher risk (OR = 1.08; 95% CI 1.04–1.12) and, compared with those in quartile 3, patients in quartile 4 had 7% higher risk (OR = 1.07; 95% CI 1.03–1.11) of foot ulceration. There was also a significant graded relationship between SBP variability and foot ulceration risk (P value for trend <0.001; Table 1). Our sensitivity analysis confirmed that the relationship between SBP variability and foot ulceration held in those with and without hypertension, as well as those whose SBP variability was calculated using less than six or seven or more BP measurements (P for trend <0.001 for both groups; Table 2).
Table 2.
Estimated, adjusted odds ratios for developing an incident diabetic foot ulcer based on the interaction terms between SBP variability and hypertension and number of blood pressure measurements used to calculate variabilitya
| SBP variability quartiles (ref = quartile 1, least variability) | |||||
|---|---|---|---|---|---|
| N | 2 | 3 | 4 (most variability) | P for trend | |
| By Hypertension | |||||
| Normotensive | 7432 | 1.132 (0.940–1.363) | 1.039 (0.860–1.255) | 1.276 (1.048–1.553) | <0.001 |
| Hypertensive | 172 926 | 1.113 (1.069–1.159) | 1.207 (1.159–1.256) | 1.286 (1.235–1.339) | <0.001 |
| By number of BP measures | |||||
| 6 or fewer | 90 652 | 1.041 (0.987–1.098) | 1.110 (1.050–1.174) | 1.254 (1.188–1.323) | <0.001 |
| 7 or more | 89 706 | 1.111 (1.040–1.187) | 1.180 (1.106–1.259) | 1.235 (1.157–1.319) | <0.001 |
All results are adjusted for covariates listed in Table 1. The normotensive patients were defined as those having mean blood pressures (BPs) less than 130/80mmHg without any use of antihypertensive medications; all other patients were classified as hypertensive.
Increased SBP variability remained associated with an increased risk of incident foot ulcers in the antihypertensive secondary analysis (Table 3). Calcium channel blockers were protective against developing a foot ulcer, a finding that was specific to this antihypertensive drug class (OR = 0.88; 95% CI 0.86–0.91; P< 0.001, Model 1, Table 3). They remained protective for those without peripheral vascular disease (OR = 0.89; 95% CI 0.86–0.92; P< 0.001, Model 2) and for those without peripheral neuropathy (OR = 0.88; 95% CI 0.84–0.91; P< 0.001, Model 3), but not with either comorbidity (P for interaction = 0.150 for peripheral vascular disease; 0.303 for neuropathy). Table C shows that SBP mean and variability were greater among users compared with nonusers for all three classes of antihypertensive medications (P< 0.001 for all comparisons, Supplemental Digital Content 4, http://links.lww.com/HJH/A942).
Table 3.
Estimated, adjusted odds ratios for the association between antihypertensive drug classes and development of a diabetic foot ulcera
| Model 1 (antihypertensives) | Model 2 (PVD × antihyypertensives) | Model 3 (neuropathy × antihypertensives) | ||||
|---|---|---|---|---|---|---|
| Variables | OR (95% CI) | P value | OR (95% CI) | P value | OR (95% CI) | P value |
| SBP variability quartiles (ref= quartile 1, lowest variability) | ||||||
| 2 | 1.112 (1.069–1.157) | <0.001 | 1.112 (1.069–1.157) | <0.001 | 1.112 (1.069–1.157) | <0.001 |
| 3 | 1.197 (1.151–1.245) | <0.001 | 1.197 (1.151–1.245) | <0.001 | 1.197 (1.151–1.245) | <0.001 |
| 4 (highest variability) | 1.284 (1.234–1.336) | <0.001 | 1.284 (1.234–1.336) | <0.001 | 1.285 (1.235–1.337) | <0.001 |
| PVD | 9.291 (8.830–9.777) | <0.001 | 9.260 (8.122–10.558) | <0.001 | 9.294 (8.832–9.780) | <0.001 |
| Neuropathy | 1.545 (1.498–1.594) | <0.001 | 1.545 (1.498–1.594) | <0.001 | 1.675 (1.542–1.820) | <0.001 |
| Antihypertensive use | ||||||
| CCB | 0.884 (0.857–0.912) | <0.001 | 0.890 (0.861–0.919) | <0.001 | 0.875 (0.843–0.907) | <0.001 |
| BB | 1.030 (1.001–1.061) | 0.045 | 1.035 (1.004–1.067) | 0.025 | 1.062 (1.025–1.099) | 0.001 |
| Other drugs | 1.044 (0.997–1.093) | 0.067 | 1.037 (0.989–1.088) | 0.133 | 1.057 (1.003–1.114) | 0.037 |
| Interaction terms | ||||||
| PVD × CCB use | 0.927 (0.835–1.028) | 0.150 | ||||
| PVD × BB use | 0.940 (0.849–1.041) | 0.237 | ||||
| PVD × other use | 1.078 (0.931–1.248) | 0.317 | ||||
| Neuropathy × CCB use | 1.035 (0.970–1.104) | 0.303 | ||||
| Neuropathy × BB use | 0.907 (0.853–0.965) | 0.002 | ||||
| Neuropathy × other use | 0.953 (0.870–1.045) | 0.310 | ||||
BB, beta blocker; CCB, calcium channel blocker; PVD, peripheral vascular disease.
All models are adjusted for marital status, duration of diabetes, hemoglobin A1C, hypoglycemic medication use, renal failure, retinopathy, PVD, neuropathy, Charcot arthropathy, foot deformity, number of podiatry visits, BMI, serum albumin, chronic venous stasis, LDL cholesterol, and cholesterol-lowering medication use.
DISCUSSION
This is the first study to demonstrate a graded relationship between excessive SBP variability and increased risk of developing a diabetic foot ulcer, independent of the mean SBP. After controlling for most major risk factors for foot ulceration such as peripheral vascular disease, peripheral neuropathy, and foot deformity, the risk of ulceration increased linearly in each successive quartile and the largest variability group (quartile 4) had almost 30% higher risk of foot ulceration than the least variability group (quartile 1). We also found similar graded relationships for both nor-motensive and hypertensive patients as determined by both BP 130/80 mmHg thresholds and antihypertensive use. This graded relationship, which held for individuals with and without hypertension, suggests that SBP variability is not just an epiphenomenon of elevated absolute SBP but a potential, independent, and modifiable risk factor warranting further study.
Excessive SBP variability has been previously linked to increased risk of macrovascular complications such as myocardial infarction, stroke, and above-ankle (major) amputation [1—4]. SBP variability has also been associated with increased risk of microvascular complications, such as nephropathy and retinopathy [5,6]. Underlying macrovas-cular and microvascular diseases are dominant risk factors for development of a diabetic foot ulcer; therefore, our finding that excessive SBP variability is associated with an increased risk in foot ulceration is consistent with prior knowledge. SBP variability offers a potential new and modifiable target for clinicians to reduce the burden of diabetic foot ulcers. Comparisons between SBP variability quartiles suggest that the relationship between SBP variability and incident foot ulceration is linear and may have a potential inflection point around the within-patient SD of 5mmHg (the cut-off between quartiles 1 and 2), corresponding to an increased risk of ~11%. This threshold is consistent with previous studies [3,29].
Our analysis confirms the importance of classic risk factors for incident foot ulceration. Elevated hemoglobin A1C levels, vascular disease, foot deformities, and micro-vascular complications such as renal failure, neuropathy, and retinopathy, remained predictive of developing an incident ulcer in our model. In our study, a longer duration of diabetes was associated with a reduced risk of incident foot ulceration. Although the exact reason for this finding is unknown, we suggest three possibilities. First, it may be a result of studying incident, rather than prevalent, foot ulcers. Prevalence increases with duration of diabetes, but incident ulcers may peak in those with shorter durations [30]. Second, it is possible that patients with newly diagnosed diabetes had suboptimal diagnosis and control of comorbid risk factors, placing them at increased risk of foot ulceration. As the length of diagnosed diabetes increased, it may have provided time to diagnosis and manage those comorbidities, thereby reducing the risk of foot ulceration. Third, many of the risk factors that predispose to ulceration also increase the risk of death, introducing the possibility of survival bias [31].
In our secondary analysis, we found that calcium channel blockers were associated with a reduced risk of incident diabetic foot ulcers. Previous studies suggested that calcium channel blockers (especially the dihydropyridine subclass) blunt within-patient SBP variability [32]. Comparisons between calcium channel blocker users and nonusers in our data found a higher SBP variability in those taking calcium channel blockers. As our data set is cross-sectional, not longitudinal, it does not contain information on individual patients before and after drug administration that would be needed to comment on whether calcium channel blockers decrease SBP variability within individuals. Our results do suggest that potential benefits of calcium channel blockers were limited to patients without previously diagnosed peripheral vascular disease or neuropathy. Once vascular and neurologic damage has occurred, it may be too late for calcium channel blockers to decrease the risk of ulceration. In our prior study demonstrating that increased SBP variability was associated with an increased risk of major amputation, calcium channel blockers were not protective in a model that included more proximal determinants of major amputation, such as foot ulcers, neuropathy, and vascular disease [4]. Taken together, our current and prior studies suggest that if calcium channel blockers mitigate the risk of diabetic foot ulcers, their impact is likely to be maximized when they are initiated soon after diabetes is diagnosed and before vascular comorbidities, such as peripheral vascular disease and neuropathy, can develop. Early use of calcium channel blocker is aligned with current antihypertensive guidelines, which state that, for patients without albuminuria for whom vascular disease prevention is the primary goal, dihydropyridine calcium channel blockers may be considered instead of, or in addition to, an angiotensin-converting enzyme (ACE) inhibitor or angiotensin II receptor blocker (ARB) [33].
Although our nested case-control study cannot establish a causal relationship between SBP variability and incident diabetic foot ulcers, it contributes to building a case for it. In Table 4, we review epidemiologic guidelines used to determine whether an association is causal, highlighting areas of established strength and current weaknesses ripe for further investigation [34]. Key contributions from this study include: establishing an association between SBP variability and incident diabetic foot ulcers comparable with known risk factors such as neuropathy, quantifying a dose-response relationship between SBP variability and foot ulceration, and documenting that calcium channel blockers, which reduce exposure to SBP variability, are associated with a reduced risk of ulceration [32]. Establishing a causal relationship would require prospectively replicating the findings in different populations using stronger study designs. Potential future studies include prospective cohorts and randomized clinical trials of interventions that might blunt SBP variability among patients with newly diagnosed diabetes to prevent foot ulceration. Additional pathophysiologic work would also bolster the argument for a causal relationship between SBP variability and diabetic foot ulcers.
Table 4.
Evaluation of the potential causal relationship between SBP variability and diabetic foot ulceration using epidemiologic criteria
| Expected relationship | Evidence | |
|---|---|---|
| Temporal relationship | Exposure to the potential causative agent should occur before disease develops | Cases were limited to patients with incident diabetic foot ulcers and BP measures taken during 1-year period before foot ulceration were used to compute SBP variability. Therefore, SBP variability preceded foot ulceration in our study |
| Strength of the association | Stronger associations are more likely to be causal | In our model, the adjusted odds ratios for SBP variability were similar in magnitude to established risk factors for foot ulceration, such as neuropathy |
| Dose-response relationship | As the dose of exposure increases, so should the risk | As SBP variability increased across the quartiles, so did the risk of foot ulceration |
| Replication of the findings | A causal relationship should be found across different studies and populations | This is the first study identifying an association between SBP variability and foot ulceration |
| Biologic plausibility | A reasonable biologic mechanism should underpin the epidemiologic association | Pathophysiologic pathways need to be explored further, although there is evidence to support biologic plausibility [29,31,33,35] |
| Consideration of alternative explanations | Is the association causal or confounding? | Our models attempt to control for factors known to increase the risk of developing a foot ulcer, however, residual confounding will always be a concern in case-control and cohort studies. Prospective, randomized trials would better address this |
| Cessation of exposure | The risk of a disease should decline when exposure to the potential causative agent is reduced or eliminated | Calcium channel blockers reduce exposure to SBP variability and were protective in our analysis |
| Consistency with other knowledge | The potential causative association should fit with what is known more generally about both the causative agent and disease state | In addition to diabetic foot ulcers, increasing SBP variability has been associated with other microvascular and macrovascular complications [1–6] |
Data from [34].
The current study’s design strengths include that the cohort was compiled from the VA national databases and represented a geographically diverse population with SBP measurements extracted from real-life clinical data. We carefully selected these measures to reflect the SBP variability individuals experience during routine, outpatient care, excluding any readings taken from hospitalizations, emergency room visits or in the night time. We used sensitivity analyses to exclude potential confounding by the number of BP measures as an alternative explanation for the relationship between SBP variability and foot ulceration risk.
We also recognize several limitations to be considered when interpreting our results. First, this is a retrospective observational study, which raises concern for bias because of confounding. We did not have access to some potential confounding factors that may have affected both SBP variability and the risk of amputation, such as smoking or medication adherence, in our dataset. Medication adherence, for example, can affect both SBP variability and the risk of foot ulceration. Although we controlled for other risk factors, such as the extent of diabetes control and hypoglycemic regimens, cases had many more risk factors for ulceration than controls, raising the possibility of residual confounding. Second, retrospective observational studies are also prone to selection bias. The nested case-control design by which controls were randomly selected from a large cohort of individuals at risk of developing a foot ulcer during the timespan in which a case occurred, helps to mitigate this bias [18]. Third, we relied on administrative claims data to identify comorbidities and the clinical outcome, raising the possibility of misclassification. Even though foot ulcers can be determined with very high accuracy using VA administrative data, we acknowledge that nonsymptomatic peripheral vascular disease may have been under-identified in our data set [21]. Lastly, as is typical with VA studies, the cohort from which cases and controls were selected was largely men, which raises the question as to whether results are generalizable to women with diabetes.
In conclusion, excessive SBP variability is associated with an increased risk of developing a diabetic foot ulcer. This study lays a foundation for further investigations into a causal relationship. Firmly establishing increased SBP variability as a causative factor leading to diabetic foot ulcers would allow providers to target this modifiable risk. Reducing SBP variability soon after the initial diagnosis of diabetes may prove useful in preventing one of the most common, debilitating, and costly complications of diabetes [7,9,12].
Supplementary Material
ACKNOWLEDGEMENTS
This work has not been presented previously, in whole or part.
This study was funded by Agency for Healthcare Research and Quality (AHRQ) grant R01HS018542 (E.H. and M.S.) and National Institutes of Health (NIH) grants UL1TR000427 and KL2TR000428 (M.B. and B.S.).
Abbreviations
- ACE
angiotensin-converting enzyme inhibitor
- ARB
angiotensin II receptor blocker
- BP
blood pressure
- VA
Department of Veterans Affairs
Footnotes
Conflicts of interest
There are no conflict of interests.
REFERENCES
- 1.Muntner P, Whittle J, Lynch AI, Colantonio LD, Simpson LM, Einhorn PT, et al. Visit-to-visit variability of blood pressure and coronary heart disease, stroke, heart failure, and mortality: a cohort study. Ann Intern Med 2015; 163:329–338. [DOI] [PMC free article] [PubMed] [Google Scholar]
- 2.Parati G, Ochoa JE, Salvi P, Lombardi C, Bilo G. Prognostic value of blood pressure variability and average blood pressure levels in patients with hypertension and diabetes. Diabetes Care 2013; 36 (Suppl 2):S312–3224. [DOI] [PMC free article] [PubMed] [Google Scholar]
- 3.Rothwell PM, Howard SC, Dolan E, O’Brien E, Dobson JE, Dahlöf B, et al. Prognostic significance of visit-to-visit variability, maximum systolic blood pressure, and episodic hypertension. Lancet 2010; 375:895–905. [DOI] [PubMed] [Google Scholar]
- 4.Budiman-Mak E, Epsein N, Brennan M, Stuck R, Guihan M, Huo Z, et al. Systolic blood pressure variability and lower extremity amputation in a nonelderly population with diabetes. Diabetes Res Clin Pract 2016; 114:75–82. [DOI] [PMC free article] [PubMed] [Google Scholar]
- 5.Hata J, Arima H, Rothwell PM, Woodward M, Zoungas S, Anderon C, et al. , ADVANCE Collaborative Group. Effects of vist-to-vist variability in systolic blood pressure on macrovascular and microvascular complications in patients with type 2 diabetes mellitus: the ADVANCE trial. Circulation 2013; 128:1325–1334. [DOI] [PubMed] [Google Scholar]
- 6.Sohn MW, Epstein N, Huang ES, Huo Z, Emanuele N, Stukenborg G, et al. Visit-to-visit systolic blood pressure variability and microvascular complications among patients with diabetes. J Diabetes Complications 2017; 31:195–201. [DOI] [PMC free article] [PubMed] [Google Scholar]
- 7.Prompers L, Huijberts M, Apelqvist J, Jude E, Piaggesi A, Bakker K, et al. High prevalence of ischaemia, infection and serious comorbidity in patients with diabetic foot disease in Europe. Baseline results from the Eurodiale study. Diabetologia 2007; 50:18–25. [DOI] [PubMed] [Google Scholar]
- 8.Boulton AJ, Kirsner RS, Vileikyte L. Neuropathic diabetic foot ulcers. N Engl J Med 2004; 351:48–55. [DOI] [PubMed] [Google Scholar]
- 9.Schaper NC. Lessons from Eurodiale. Diabetes Metab Res Rev 2012; 28 (Suppl 1):21–26. [DOI] [PubMed] [Google Scholar]
- 10.Menke A, Casagrande S, Geiss L, Cowie CC. Prevalence of and trends in diabetes among adults in the United States, 1988—2012. JAMA 2015; 314:1021–1029. [DOI] [PubMed] [Google Scholar]
- 11.Ramsey SD, Newton K, Blough D, McCulloch DK, Sandhu N, Reiber GE, et al. Incidence, outcomes, and cost of foot ulcers in patients with diabetes. Diabetes Care 1999; 22:382–387. [DOI] [PubMed] [Google Scholar]
- 12.Hicks CW, Selvarajah S, Mathioudakis N, Perler BA, Freischlag JA, Black JH 3rd, et al. Trends and determinants of costs associated with the inpatient care of diabetic foot ulcers. J Vasc Surg 2014; 60: 1247–1254. e1–e2. [DOI] [PMC free article] [PubMed] [Google Scholar]
- 13.Skrepnek GH, Mills JL Sr, Armstrong DG. A diabetic emergency one million feet long: disparities and burdens of illness among diabetic foot ulcer cases within Emergency Departments in the United States, 2006— 2010. PLoS One 2015; 10:e0134914. [DOI] [PMC free article] [PubMed] [Google Scholar]
- 14.Resnick HE, Foster GL, Bardsley J, Ratner RE. Achievement of American Diabetes Association clinical practice recommendations among U.S. adults with diabetes, 1999—2002: the National Health and Nutrition Examination Survey. Diabetes Care 2006; 29:531–537. [DOI] [PubMed] [Google Scholar]
- 15.Tight blood pressure control and risk of macrovascular and microvas-cular complications in type 2 diabetes: UKPDS 38. UK Prospective Diabetes Study Group. BMJ 1998; 317:703–713. [PMC free article] [PubMed] [Google Scholar]
- 16.ACCORD Study Group Cushman WC, Evans GW, Byington RP, Goff DC Jr, Grimm RH Jr, et al. . Effects of intensive blood-pressure control in type 2 diabetes mellitus. N Engl J Med 2010; 362:1575–1585. [DOI] [PMC free article] [PubMed] [Google Scholar]
- 17.Essebag V, Genest J Jr, Suissa S, Pilote L. The nested case-control study in cardiology. Am Heart J 2003; 146:581–590. [DOI] [PubMed] [Google Scholar]
- 18.Sedgwick P Nested case-control studies [abstract]. BMJ 2010; 340:c2582A. [DOI] [PubMed] [Google Scholar]
- 19.Miller DR, Safford MM, Pogach LM. Who has diabetes? Best estimates of diabetes prevalence in the Department of Veterans Affairs based on computerized patient data. Diabetes Care 2004; 27 (Suppl 2):B10–B21. [DOI] [PubMed] [Google Scholar]
- 20.Dubsky M, Jirkovska A, Bern R, Fejfarova V, Skibova J, Schaper NC, Lipsky BA. Risk factors for recurrence of diabetic foot ulcers: prospective follow-up analysis in the Eurodiale subgroup. Int Wound J 2013; 10:555–561. [DOI] [PMC free article] [PubMed] [Google Scholar]
- 21.Sohn MW, Budiman-Mak E, Stuck RM, Siddiqui F, Lee TA. Diagnostic accuracy of existing methods for identifying diabetic foot ulcers from inpatient and outpatient datasets. J Foot Ankle Res 2010; 3:27. [DOI] [PMC free article] [PubMed] [Google Scholar]
- 22.Rothwell PM, Howard SC, Dolan E, O’Brien E, Dobson JE, Dahlöf B, et al. , ASCOT-BPLA and MRC Trial Investigators. Effects of beta blockers and calcium-channel blockers on within-individual variability in blood pressure and risk of stroke. Lancet Neurol 2010; 9:469–480. [DOI] [PubMed] [Google Scholar]
- 23.Hingorani A, LaMuraglia GM, Henke P, Meissner MH, Loretz L, Zinszer KM, et al. The management of diabeticfoot: a clinical practice guideline by the Society for Vascular Surgery in collaboration with the American Podiatric Medical Association and Society for Vascular Medicine. J Vasc Surg 2016; 63 (Suppl 2):3S–21S. [DOI] [PubMed] [Google Scholar]
- 24.Lipsky BA, Berendt AR, Cornia PB, Pile JC, Peters EJG, Armstrong DG, et al. , Infectious Diseases Society of America. 2012 Infectious Diseases Society of America clinical practice guideline for the diagnosis and treatment of diabetic foot infections. 2012 Infectious Disease Society of America Clinical Practice Guideline for the Diagnosis and Treatment of Diabetic Foot Infections. Clin Infect Dis 2012; 54:e132–e173. [DOI] [PubMed] [Google Scholar]
- 25.Frykberg RG, Zgonis T, Armstrong DG, Driver VR, Giurini JM, Kravitz SR, et al. , American College of Foot and Ankle Surgeons. Diabetic foot disorders. A clinical practice guideline (2006 revision). J Foot Ankle Surg 2006; 45 (5 Suppl):S1–S66. [DOI] [PubMed] [Google Scholar]
- 26.Sohn MW, Lee TA, Stuck RM, Frykberg RG, Budiman-Mak E. Mortality risk of Charcot arthropathy compared with that of diabetic foot ulcer and diabetes alone. Diabetes Care 2009; 32:816–821. [DOI] [PMC free article] [PubMed] [Google Scholar]
- 27.Sohn M-W, Budiman-Mak E, Lee TA, Oh E, Stuck RM. Significant J-shaped association between body mass index (BMI) and diabetic foot ulcers. Diabetes Metab Res Rev 2011; 27:402–409. [DOI] [PubMed] [Google Scholar]
- 28.Su DF. Treatment of hypertension based on measurement of blood pressure variability: lessons from animal studies. Curr Opin Cardiol 2006; 21:486–491. [DOI] [PubMed] [Google Scholar]
- 29.Muntner P, Shimbo D, Tonelli M, Reynolds K, Arnett DK, Oparil S. The relationship between visit-to-visit variability in systolic blood pressure and all-cause mortality in the general population: findings from NHANES III, 1988 to 1994. Hypertension 2011; 57:160–166. [DOI] [PubMed] [Google Scholar]
- 30.Prompers L, Schaper N, Apelqvist J, Edmonds M, Jude E, Mauricio D, et al. Prediction of outcome in individuals with diabetic foot ulcers: focus on the difference between individuals with and without peripheral arterial disease. The EURODIALE study. Diabetologia 2008; 51:747–755. [DOI] [PMC free article] [PubMed] [Google Scholar]
- 31.Walsh JW, Hoffstad OJ, Sullivan MO, Margolis DJ. Association of diabetic foot ulcer and death in a population-based cohort from the United Kingdom. Diabet Med 2016; 33:1493–1498. [DOI] [PubMed] [Google Scholar]
- 32.Webb AJ, Fischer U, Mehta Z, Rothwell PM. Effects of antihypertensive-drug class on interindividual variation in blood pressure and risk of stroke: a systematic review and meta-analysis. Lancet 2010; 375: 906–915. [DOI] [PubMed] [Google Scholar]
- 33.American Diabetes Association. 9. Cardiovascular disease and risk management. Diabetes Care 2017; 40 (Suppl 1):S75–S87. [DOI] [PubMed] [Google Scholar]
- 34.Gordis L. Epidemiology, 4th ed. Philadelphia: Saunders Elsevier; 2004. [Google Scholar]
- 35.Manios E, Stamatelopoulus K, Tsivgoulis G, Barlas G, Koroboki E, Tsagalis G, et al. Time rate of blood pressure variation: a new factor associated with coronary atherosclerosis. J Hypertens 2011; 29:1109–1114. [DOI] [PubMed] [Google Scholar]
Associated Data
This section collects any data citations, data availability statements, or supplementary materials included in this article.