

Abstract
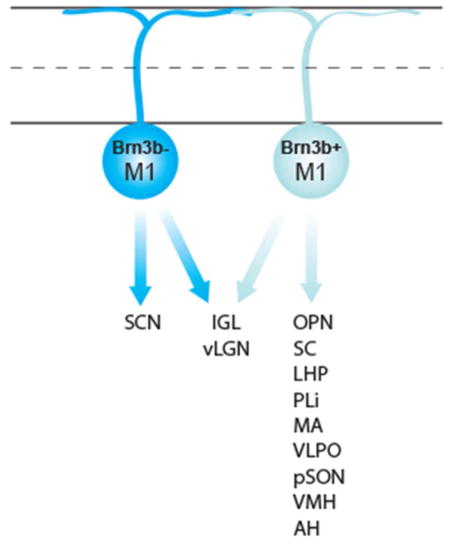
In addition to its well-known role in pattern vision, light influences a wide range of non-image forming, subconscious visual behaviors including circadian photoentrainment, sleep, mood, learning, and the pupillary light reflex. Each of these behaviors is thought to require input from the M1 subtype of melanopsin-expressing, intrinsically photosensitive retinal ganglion cell (ipRGC). Recent work has demonstrated that the M1 subtype of ipRGC can be further subdivided based on expression of the transcription factor Brn3b. Brn3b-positive M1 ipRGCs project to the olivary pretectal nucleus and are necessary for the pupillary light reflex, while Brn3b-negative M1 ipRGCs project to the suprachiasmatic nucleus (SCN) and are sufficient for circadian photoentrainment. However, beyond the circadian and pupil systems, little is known about the projection patterns of M1 ipRGC subtypes. Here we show that Brn3b-positive M1 ipRGCs comprise the majority of sparse M1 ipRGC inputs to the thalamus, midbrain, and hypothalamus. Our data demonstrate that very few brain targets receive convergent input from both M1 ipRGC subpopulations, suggesting that each subpopulation drives a specific subset of light-driven behaviors.
Keywords: retinal ganglion cells, melanopsin, circadian rhythms, pupillary light reflex, hypothalamus RRID:MGI:5285915
Graphical Abstract
We mapped the projection patterns of Brn3b-positive and Brn3b-negative M1 ipRGCs using X-gal labeling of M1 ipRGC axons. Brn3b-positive M1 ipRGCs form the majority of sparse M1 ipRGC innervation of thalamus, midbrain, and hypothalamus, with few brain regions receiving overlapping input. Thus, molecularly distinct ipRGC subsets likely drive distinct behaviors.
1. Introduction
Light influences a wide array of visual behaviors that occur outside of conscious perception including circadian photoentrainment, the pupillary light reflex, sleep, and modulation of mood and learning (Altimus et al., 2008; Güler et al., 2008; Hatori et al., 2008; LeGates et al., 2012). Ablation of the M1 subtype of melanopsin-expressing, intrinsically photosensitive retinal ganglion cells (ipRGCs) results in a loss of these subconscious behaviors but retention of normal image forming vision (Altimus et al., 2008; Güler et al., 2008; Schmidt et al., 2014). In agreement with these findings, mapping of M1 ipRGC projections to the brain reveals innervation of multiple areas involved in these same subconscious visual behaviors, such as the suprachiasmatic nucleus of the hypothalamus (SCN; involved in circadian photoentrainment), the olivary pretectal nucleus (OPN; involved in the pupillary light reflex), the intergeniculate leaflet (IGL), and the ventral lateral geniculate nucleus (vLGN) (Hattar et al., 2002, 2006; Chen et al., 2011).
There are at least five subtypes of ipRGC (M1–M5) and each type exhibits a distinct complement of morphological and physiological characteristics, central projections, and behavioral roles (Güler et al., 2008; Schmidt and Kofuji, 2009, 2011; Ecker et al., 2010; Schmidt et al., 2011, 2014). The M1 subtype is characterized by dendritic stratification in the OFF sublamina of the inner plexiform layer, high melanopsin expression, and innervation of more than a dozen brain areas involved primarily in subconscious, non-image forming behaviors (Hattar et al., 2006; Schmidt and Kofuji, 2009; Berson et al., 2010; Ecker et al., 2010; Schmidt et al., 2011, 2014; Estevez et al., 2012; Dellapolla et al., 2017). Until recently, M1 ipRGCs were thought to constitute a single, uniform subtype of ipRGC. However, we now know that M1 ipRGCs can be molecularly subdivided based on whether they express the basic helix-loop-helix transcription factor Brn3b (Pou4f2). Non-M1 ipRGCs, in contrast, all express Brn3b. Ablation of Brn3b-positive ipRGCs via conditional expression of diphtheria toxin (DTA) (Figure 1), selectively eliminates M1 ipRGC innervation of the OPN but not the SCN, resulting in a severely diminished pupillary light reflex while circadian photoentrainment is retained (Chen et al., 2011). Thus, Brn3b-positive M1 ipRGCs are necessary for the pupillary light reflex and Brn3b-negative M1 ipRGCs are sufficient for circadian photoentrainment, demonstrating divergent projections and behavioral roles for Brn3b-positive and Brn3b-negative M1 ipRGCs.
Figure 1. Mouse lines used to label Brn3b-positive and Brn3b-negative subpopulations of M1 ipRGCs.

Schematic showing ipRGC subtypes present and positive for tau-LacZ in both Control (top panel) and Brn3bDTA (bottom panel) mice. Blue cells indicate cells that are labeled by the X-gal stain in each mouse line. Non-M1 cells and a subset of M1 cells express Brn3b and are ablated in Brn3bDTA mice (ablation indicated by dashed gray line in bottom panel). Non-M1 cells are not labeled by the X-gal stain in either mouse line. Therefore, this strategy can be used to label Brn3b-positive and Brn3b-negative M1 ipRGCs in Control animals and Brn3b-negative M1 cells in Brn3bDTA animals.
Despite this recent discovery of M1 ipRGC diversity, little is known about the projection patterns of M1 subtypes beyond the brain areas that mediate circadian behaviors and the pupillary light reflex (Hattar et al., 2006; Chen et al., 2011). Here, we utilize a mouse line where all M1 ipRGC projections are labeled (Hattar et al., 2006) and one where only Brn3b-negative M1 ipRGC projections are labeled (Chen et al., 2011) to generate a comprehensive characterization of Brn3b-positive and Brn3b-negative M1 ipRGC projections to the brain (Figure 1). We find that Brn3b-positive M1 ipRGCs constitute the majority of sparse M1 ipRGC innervation of the thalamus, hypothalamus, and midbrain. Our data demonstrate the Brn3b-positive and Brn3b-negative M1 ipRGCs show very little overlap in their projection patterns, thus establishing the groundwork for future behavioral studies of the role of M1 subpopulations in non-image forming behaviors.
2. Materials and Methods
Animals
All procedures were conducted in accordance with NIH guidelines and approved by the Institutional Animal Care and Use Committee of Northwestern University. Opn4Cre and Opn4tau-LacZ (provided by Dr. Samer Hattar) and Brn3bz-dta (provided by Dr. William Klein) were maintained on a mixed C57Bl/6J; 129Sv/J background. (Hattar et al., 2002, 2006; Mu et al., 2005). Animals were given food and water ad libitum and kept on a 12:12 light/dark cycle. Male and female littermate animals between the ages of 2 and 4 months were used. Opn4Cre/tau-LacZ (n = 5, referred to as “Control” within the text) mice where all ipRGCs are intact but only M1 ipRGCs express tau-LacZ were used to label all M1 ipRGC projections (Hattar et al., 2002, 2006) and Opn4Cre/tau-LacZ; Brn3bz-dta/+ (n = 5, referred to as “Brn3bDTA” within the text; RRID:MGI:5285915) mice where all Brn3b-positive ipRGCs (including all non-M1 ipRGCs and Brn3b-positive M1 ipRGCs) are ablated but only M1 ipRGCs express tau-LacZ were used to label Brn3b-negative M1 ipRGC projections (Chen et al., 2011). This strategy is outlined in Figure 1.
X-Gal Staining
Mice were perfused with 25 mL of 4% paraformaldehyde (PFA) in phosphate-buffered saline (PBS; pH 7.4) and the brain was cryoprotected in 30% sucrose in PBS overnight. Serial 50 μm coronal cryosections were collected and all sections were stained on glass slides at room temperature. Sections were washed with PBS and incubated twice in Buffer B for 10 min (100 mM phosphate buffer [pH 7.4], 2 mM MgCl2, 0.01% Na-deoxycholate, and 0.02% [octylphenoxy] polyethoxyethanol [IGEPAL]). Sections were then incubated in Buffer C (100 mM phosphate buffer [pH 7.4], 2mM MgCl2, 0.01% Na-deoxycholate, 0.02% IGEPAL, 5 mM K3Fe(CN)6, 5 mM K4Fe(CN)6, and X-gal [1 mg/mL, diluted from 100 mg/mL stock in dimethylformamide (DMF) right before staining]). Slices were postfixed in 4% PFA for 30 minutes and coverslipped with 70% glycerol and imaged on a Leica DM2500 SPE microscope. Coronal plates used in Figure 5 are modified from Paxino and Franklin’s The Mouse Brain in Stereotaxic Coordinates (Franklin and Paxinos, 2008). For certain brain areas, some Brn3bDTA animals showed a complete absence of M1 ipRGC innervation while some animals showed only a severe reduction in staining. In these cases, images depicting conditions where remaining innervation was observed are shown and the distribution of phenotypes are summarized in the text and in Figure 6.
3. Results
Major M1 ipRGC targets show divergent innervation by Brn3-positive and Brn3b-negative M1 ipRGCs
M1 ipRGCs have been shown to send projections to more than a dozen targets within the hypothalamus, thalamus, and midbrain (Hattar et al., 2006). However, the relative contributions of Brn3b-positive and Brn3b-negative M1 ipRGCs to innervation of these targets have only been examined for the suprachiasmatic nucleus (SCN), the intergeniculate leaflet (IGL), the ventral lateral geniculate nucleus (vLGN), and the olivary pretectal nucleus (OPN) (Chen et al., 2011). We first sought to ensure that, in our hands, projection patterns of Brn3b-positive and Brn3b-negative M1 ipRGCs to the OPN, SCN, IGL, and vLGN matched those reported previously. To do this, we utilized littermates from the same mouse lines used previously where all M1 ipRGCs are present (Opn4tau-LacZ/+; Brn3bZ-dta/+; hereafter referred to as Control, n = 5) or where only Brn3b-negative M1 ipRGCs are present (Opn4tau-LacZ/Cre; Brn3bZ-dta/+; hereafter referred to as Brn3bDTA, n = 5) (Hattar et al., 2002; Chen et al., 2011). In both the Control and Brn3bDTA lines, M1 ipRGC axons can be visualized with X-gal staining (Hattar et al., 2006), allowing us to specify whether known M1 ipRGC targets are innervated primarily by Brn3b-positive M1 ipRGCs, Brn3b-negative M1 ipRGCs, or both (Figure 1). In agreement with the initial report, we found that Brn3bDTA mice showed loss of M1 ipRGC innervation of the OPN, partial reduction of innervation in the IGL and vLGN, and normal innervation of the SCN (Figure 2) (Chen et al., 2011).
Figure 2. Projections of M1 ipRGC subtypes to circadian and pupil centers.

Innervation of OPN (a–b), IGL, vLGN (c–d), and SCN (e–f) in Control (a,c,e)(n=5) and Brn3bDTA (b,d,f)(n=5) mice visualized with X-gal staining. M1 ipRGC innervation is severely reduced in Brn3bDTA mice in the OPN, reduced in the IGL and vLGN, but normal in the SCN, as reported previously (Chen et al., 2011). Scale Bars: 100 μm. OPN: Olivary Pretectal Nucleus, IGL: Intergeniculate Leaflet, vLGN: Ventral Lateral Geniculate Nucleus, SCN: Suprachiasmatic Nucleus.
Brn3b-positive M1 ipRGCs constitute the majority of projections to minor thalamic and midbrain targets of M1 ipRGCs
M1 ipRGCs show sparse innervation of multiple targets in the thalamus and midbrain including the posterior limitans (PLi), the lateral habenula (LHb), the superior colliculus (SC) and the rostral dorsal lateral geniculate nucleus (dLGN) (Hattar et al., 2006; Ecker et al., 2010). The contribution of Brn3b-positive and Brn3b-negative M1 ipRGC axons to innervation of these brain areas has never been tested. To determine what proportion of these projections arise from Brn3b-positve and Brn3b-negative M1 ipRGCs, we compared M1 ipRGC innervation of these targets in Control and Brn3bDTA mice. In all experiments, comparisons were limited to areas that showed consistent labeling in all Control mice to exclude the possibility that loss of innervation was simply due to low staining intensity. In contrast to the M1 ipRGC axons in the LHb, PLi, and SC visible in Control animals, labeled axons were absent or reduced to single fibers per section in these regions in Brn3bDTA mice (Figure 3a–f). Specifically, 3/5 Brn3bDTA animals showed a single fiber in LHb while 2/5 animals had no innervation (Figure 3b). For PLi, 4/5 Brn3bDTA animals had a single fiber remaining in this brain region, while 1/5 animals showed no M1 ipRGC innervation (Figure 3d). In the SC, 2/5 Brn3bDTA animals had a single fiber remaining while 3/5 animals showed no innervation (Figure 3f). Beta-galactosidase positive cell bodies were also clearly visible in the SC of both Control and Brn3bDTA lines (Figure 3e′, f′), consistent with reports that the stratum opticum layer of the SC contains Brn3b-positive cells, which would be labeled in the Brn3bz-dta line (Byun et al., 2016). The sparse innervation observed in the rostral dLGN of Control mice (Figure 3g) was reduced completely (2/5) or to no more than a single fiber visible in adjacent sections in Brn3bDTA mice (3/5; Figure 3h). Thus, the vast majority of M1 ipRGC innervation of the LHb, PLi, SC, and dLGN arise from Brn3b-positive M1 ipRGCs.
Figure 3. Brn3b-positive M1 ipRGCs constitute the majority of minor projections from M1 ipRGCs to the thalamus and midbrain.

M1 innervation of LHb (a–b), PLi (c–d), SC (e–f), and rostral dLGN (g–h) in Control (a,c,e,g)(n = 5) and Brn3bDTA (b,d,f,h)(n = 5) mice visualized with X-gal staining. Insets from SC in e′ and f′ show Brn3b-positive cell bodies (arrowheads) in both Control (e′) and Brn3bDTA (f′) brains. Arrows in b,d, e′, and h indicate single M1 ipRGC axons. Brn3bDTA mice have no or very sparse M1 ipRGC innervation of each of these targets. Scale Bars: 200 μm. LHB: Lateral Habenula, PLi: Posterior Limitans, SC: Superior Colliculus, dLGN: Dorsal Lateral Geniculate Nucleus. SGS: Stratum Griseum Superficiale. SO: Stratum Opticum
Brn3b-positive M1 ipRGCs are the major M1 ipRGC input to non-SCN hypothalamic targets
M1 ipRGC innervation of the SCN of the hypothalamus is largely preserved in Brn3bDTA mice (Figure 2e,f and (Chen et al., 2011)). M1 ipRGCs have been shown to innervate multiple targets in the hypothalamus in addition to the SCN, but the contribution of Brn3b-positive and Brn3b-negative M1 ipRGCs to these projections is unknown (Hattar et al., 2006). Therefore, we next asked whether innervation of hypothalamic targets outside of the SCN were intact in mice lacking Brn3b-positive M1 ipRGCs. Control mice showed sparse, but reproducible M1 ipRGC innervation of the ventral medial hypothalamus (VMH), the peri supraoptic nucleus (pSON), and the ventrolateral pre-optic area (VLPO), in agreement with previous reports (Figure 4c,e,g) (Hattar et al., 2006). In contrast, these three structures were devoid of M1 ipRGC innervation in Brn3bDTA animals (Figure 4d,f,h). The optic tract, which is visible in sections at this rostro-caudal level, also contained densely packed beta-galactosidase positive fibers that were greatly reduced in Brn3bDTA animals (Figure 4a–b). Collectively, our anatomical data indicate that Brn3b-positive M1 ipRGCs account for the majority of projections to midbrain and non-SCN hypothalamic targets. A complete anatomical summary of total M1 ipRGC (Control line) vs. Brn3b-negative M1 ipRGC (Brn3bDTA line) innervation patterns is provided in Figure 5 and the phenotypic frequency is quantified in Figure 6.
Figure 4. Brn3b-positive M1 ipRGCs constitute the majority of hypothalamic innervation to non-SCN targets.

X-gal labeling of M1 ipRGC axons in the OT (a–b), VMH (c–d), pSON (e–f), and VLPO (g–h) in Control (a,c,e,g)(n = 5) and Brn3bDTA (b,d,f,h)(n = 5) mice. Brn3bDTA mice show no M1 ipRGC innervation of these targets. Scale Bars: 200 μm. OT: Optic Tract, VMH: Ventromedial Hypothalamus, pSON: Peri Supraoptic Nucleus, VLPO: Ventrolateral Preoptic Area.
Figure 5. Summary diagram of total M1 vs. Brn3b-negative M1 ipRGC innervation across multiple brain areas.

Charting of total M1 ipRGC (Control; shown in black) and Brn3b-negative M1 ipRGC (Brn3bDTA; shown in blue) innervation to multiple brain areas plotted on coronal sections from atlas of the adult mouse brain (Franklin and Paxinos, 2008). Abbreviations for each structure are defined in Figure 6.
Figure 6. Summary of Brn3bDTA Phenotypes and List of Abbreviations.

(a) Summary of M1 innervation patterns across all 5 animals in Brn3bDTA line compared to Control. Normal: No visible reduction in staining. Reduced: Observable decrease in staining, but substantial innervation remains. Severely Reduced: Innervation reduced to single or just a few fibers per section. Absent: No fibers visible in any Brn3bDTA section. (b) Definition of anatomical abbreviations used throughout manuscript.
4. Discussion
Here, we have used mouse lines where all M1 ipRGCs or only Brn3b-negative M1 ipRGCs are labeled to define the projections of Brn3b-positive and Brn3b-negative M1 ipRGCs throughout the brain. Though previous work had described the relative contribution of these ipRGCs to pupillary and circadian brain areas, the contribution of Brn3b-positive and Brn3b-negative M1 ipRGC inputs to other brain areas remained unknown. We find that Brn3b-positive M1 ipRGCs constitute the majority of M1 ipRGC innervation to non-circadian targets in the midbrain, thalamus, and hypothalamus.
The projection of Brn3b-positive M1 ipRGCs to areas such as the LHb, pSON, and VMH implicate these ipRGCs in light-evoked behaviors linked to these brain regions including: modulation of mood, body temperature, and feeding among others (Saper et al., 2005; HOEBEL and TEITELUM, 1962; Hattar et al., 2006; Stephenson et al., 2012; LeGates et al., 2014). The VLPO is another hypothalamic area that receives innervation specifically from Brn3b-positive ipRGCs. This region has been implicated in sleep induction and it is possible that these two subpopulations of M1 ipRGC could correspond to the recently reported melanopsin-regulated pathways that promote arousal (Brn3b-negative M1 cells) versus sleep (Brn3b-positive M1 cells) (Pilorz et al., 2016). It is also possible that non-M1 cells are involved in light-driven behaviors arising from the hypothalamus and are the source of these divergent pathways (Pilorz et al., 2016), but projections of non-M1 ipRGCs to these hypothalamic regions have not yet been examined. Brn3b-positive M1 ipRGCs also project to the dLGN, and although it is a well-known thalamic region in the image-forming visual pathway, the role of M1 ipRGC input in this area has not yet been uncovered. The IGL and vLGN have been studied in the context of circadian rhythms and Brn3b-positive M1 ipRGC projections to the IGL have been suggested to contribute to period lengthening under constant light conditions (Harrington, 1997; Chen et al., 2011; Morin, 2013).
Interestingly, the only brain area that appears to have normal innervation in the Brn3bDTA animal is the SCN, indicating that Brn3b-positive M1 cells are poised to exert major influence on subconscious visual behaviors. Previous reports have indicated that the SCN does receive some input from Brn3b-positive ipRGCs (Badea et al., 2009; Chen et al., 2011). Given the dense innervation by Brn3b-negative M1 ipRGCs in the SCN, loss of projections from Brn3b-positive M1 ipRGCs in this area in the Brn3bDTA mouse line could not be discerned. Therefore, it is unclear whether hypothalamic areas outside of the SCN are the sole target of Brn3b-positive M1 ipRGCs or if this innervation arises from axon collaterals of SCN-projecting, Brn3b-positive M1 ipRGCs (Fernandez et al., 2016).
Though we identified 12 brain areas innervated by M1 ipRGCs, we were not able to consistently identify all previously described M1 ipRGC projections in Control mice in our studies (e.g. the periaqueductal gray area, lateral hypothalamus, stria terminalis). This is likely due to the fact that technical limitations requiring one Cre-expressing allele at the Opn4 locus prevented our using the homozygous Opn4LacZ/LacZ mice used in previous studies, which would produce more robust and complete labeling of sparsely innervated targets (Hattar et al., 2006). Thus, only brain regions where consistent staining was observed in Control animals were used for comparison to the Brn3bDTA line to avoid confounding actual changes in projection patterns with variability in staining of sparse projections. Identification of the contribution of Brn3b-positive and Brn3b-negative M1 ipRGCs to these additional targets will be an important avenue for future research as new reagents become available to label M1 axons more robustly. Collectively, these findings provide a reference that will facilitate future work to map the anatomical and behavioral circuits underlying multiple subconscious visual behaviors.
Acknowledgments
We would like to thank Samer Hattar for the gift of the Opn4Cre and Opn4LacZ mice and William Klein for the gift of the Brn3bz-dta line. This work was funded by a Karl Kirchgessner Foundation Vision Research Grant, a Klingenstein-Simons Fellowship in the Neurosciences, and NIH 1DP2EY027983 to T.M.S.
Footnotes
Conflict of Interest: The authors declare no competing financial interests.
References
- Altimus CM, Güler AD, Villa KL, McNeill DS, Legates TA, Hattar S. Rods-cones and melanopsin detect light and dark to modulate sleep independent of image formation. Proc Natl Acad Sci USA. 2008;105:19998–20003. doi: 10.1073/pnas.0808312105. [DOI] [PMC free article] [PubMed] [Google Scholar]
- Badea TC, Cahill H, Ecker J, Hattar S, Nathans J. Distinct roles of transcription factors brn3a and brn3b in controlling the development, morphology, and function of retinal ganglion cells. Neuron. 2009;61:852–64. doi: 10.1016/j.neuron.2009.01.020. [DOI] [PMC free article] [PubMed] [Google Scholar]
- Berson DM, Castrucci AM, Provencio I. Morphology and mosaics of melanopsin-expressing retinal ganglion cell types in mice. J Comp Neurol. 2010;518:2405–22. doi: 10.1002/cne.22381. [DOI] [PMC free article] [PubMed] [Google Scholar]
- Byun H, Kwon S, Ahn H-J, Liu H, Forrest D, Demb J, Kim I-J. Molecular features distinguish ten neuronal types in the mouse superficial superior colliculus. The Journal of comparative neurology. 2016;524:2300–21. doi: 10.1002/cne.23952. [DOI] [PMC free article] [PubMed] [Google Scholar]
- Chen S-KK, Badea TC, Hattar S. Photoentrainment and pupillary light reflex are mediated by distinct populations of ipRGCs. Nature. 2011;476:92–5. doi: 10.1038/nature10206. [DOI] [PMC free article] [PubMed] [Google Scholar]
- Dellapolla A, Kloehn I, Pancholi H, Callif B, Wertz D, Rohr KE, Hurley MM, Baker KM, Hattar S, Gilmartin MR, Evans JA. Long days enhance recognition memory and increase insulin-like growth factor 2 in the hippocampus. Sci Rep. 2017;7:3925. doi: 10.1038/s41598-017-03896-2. [DOI] [PMC free article] [PubMed] [Google Scholar]
- Ecker JL, Dumitrescu ON, Wong KY, Alam NM, Chen S-KK, LeGates T, Renna JM, Prusky GT, Berson DM, Hattar S. Melanopsin-expressing retinal ganglion-cell photoreceptors: cellular diversity and role in pattern vision. Neuron. 2010;67:49–60. doi: 10.1016/j.neuron.2010.05.023. [DOI] [PMC free article] [PubMed] [Google Scholar]
- Estevez ME, Fogerson PM, Ilardi MC, Borghuis BG, Chan E, Weng S, Auferkorte ON, Demb JB, Berson DM. Form and function of the M4 cell, an intrinsically photosensitive retinal ganglion cell type contributing to geniculocortical vision. J Neurosci. 2012;32:13608–20. doi: 10.1523/JNEUROSCI.1422-12.2012. [DOI] [PMC free article] [PubMed] [Google Scholar]
- Fernandez DC, Chang Y-TT, Hattar S, Chen S-KK. Architecture of retinal projections to the central circadian pacemaker. Proc Natl Acad Sci USA. 2016;113:6047–52. doi: 10.1073/pnas.1523629113. [DOI] [PMC free article] [PubMed] [Google Scholar]
- Franklin KBJ, Paxinos G. The Mouse Brain in Stereotaxic Coordinates, Compact, Third Addition: The Coronal Plates and Diagrams. 3. Academic Press; 2008. [Google Scholar]
- Güler AD, Ecker JL, Lall GS, Haq S, Altimus CM, Liao H-WW, Barnard AR, Cahill H, Badea TC, Zhao H, Hankins MW, Berson DM, Lucas RJ, Yau K-WW, Hattar S. Melanopsin cells are the principal conduits for rod-cone input to non-image-forming vision. Nature. 2008;453:102–5. doi: 10.1038/nature06829. [DOI] [PMC free article] [PubMed] [Google Scholar]
- Harrington ME. The ventral lateral geniculate nucleus and the intergeniculate leaflet: interrelated structures in the visual and circadian systems. Neurosci Biobehav Rev. 1997;21:705–27. doi: 10.1016/s0149-7634(96)00019-x. [DOI] [PubMed] [Google Scholar]
- Hatori M, Le H, Vollmers C, Keding SR, Tanaka N, Buch T, Waisman A, Schmedt C, Jegla T, Panda S. Inducible ablation of melanopsin-expressing retinal ganglion cells reveals their central role in non-image forming visual responses. PLoS ONE. 2008;3:e2451. doi: 10.1371/journal.pone.0002451. [DOI] [PMC free article] [PubMed] [Google Scholar]
- Hattar S, Kumar M, Park A, Tong P, Tung J, Yau K-WW, Berson DM. Central projections of melanopsin-expressing retinal ganglion cells in the mouse. J Comp Neurol. 2006;497:326–49. doi: 10.1002/cne.20970. [DOI] [PMC free article] [PubMed] [Google Scholar]
- Hattar S, Liao HW, Takao M, Berson DM, Yau KW. Melanopsin-containing retinal ganglion cells: architecture, projections, and intrinsic photosensitivity. Science. 2002;295:1065–70. doi: 10.1126/science.1069609. [DOI] [PMC free article] [PubMed] [Google Scholar]
- HOEBEL TEITELUM. Hypothalamic control of feeding and self-stimulation. Science (New York, NY) 1962;135:375–7. doi: 10.1126/science.135.3501.375. [DOI] [PubMed] [Google Scholar]
- LeGates TA, Altimus CM, Wang H, Lee H-KK, Yang S, Zhao H, Kirkwood A, Weber ET, Hattar S. Aberrant light directly impairs mood and learning through melanopsin-expressing neurons. Nature. 2012;491:594–8. doi: 10.1038/nature11673. [DOI] [PMC free article] [PubMed] [Google Scholar]
- LeGates TA, Fernandez DC, Hattar S. Light as a central modulator of circadian rhythms, sleep and affect. Nat Rev Neurosci. 2014;15:443–54. doi: 10.1038/nrn3743. [DOI] [PMC free article] [PubMed] [Google Scholar]
- Morin LP. Neuroanatomy of the extended circadian rhythm system. Exp Neurol. 2013;243:4–20. doi: 10.1016/j.expneurol.2012.06.026. [DOI] [PMC free article] [PubMed] [Google Scholar]
- Mu X, Fu X, Sun H, Liang S, Maeda H, Frishman L, Klein W. Ganglion cells are required for normal progenitor-cell proliferation but not cell-fate determination or patterning in the developing mouse retina. Current biologyT: CB. 2005;15:525–30. doi: 10.1016/j.cub.2005.01.043. [DOI] [PubMed] [Google Scholar]
- Pilorz V, Tam SK, Hughes S, Pothecary CA, Jagannath A, Hankins MW, Bannerman DM, Lightman SL, Vyazovskiy VV, Nolan PM, Foster RG, Peirson SN. Melanopsin Regulates Both Sleep-Promoting and Arousal-Promoting Responses to Light. PLoS Biol. 2016;14:e1002482. doi: 10.1371/journal.pbio.1002482. [DOI] [PMC free article] [PubMed] [Google Scholar]
- Saper C, Scammell T, Lu J. Hypothalamic regulation of sleep and circadian rhythms. Nature. 2005;437:1257–63. doi: 10.1038/nature04284. [DOI] [PubMed] [Google Scholar]
- Schmidt TM, Alam NM, Chen S, Kofuji P, Li W, Prusky GT, Hattar S. A role for melanopsin in alpha retinal ganglion cells and contrast detection. Neuron. 2014;82:781–8. doi: 10.1016/j.neuron.2014.03.022. [DOI] [PMC free article] [PubMed] [Google Scholar]
- Schmidt TM, Chen S-KK, Hattar S. Intrinsically photosensitive retinal ganglion cells: many subtypes, diverse functions. Trends Neurosci. 2011;34:572–80. doi: 10.1016/j.tins.2011.07.001. [DOI] [PMC free article] [PubMed] [Google Scholar]
- Schmidt TM, Kofuji P. Functional and morphological differences among intrinsically photosensitive retinal ganglion cells. J Neurosci. 2009;29:476–82. doi: 10.1523/JNEUROSCI.4117-08.2009. [DOI] [PMC free article] [PubMed] [Google Scholar]
- Schmidt TM, Kofuji P. Structure and function of bistratified intrinsically photosensitive retinal ganglion cells in the mouse. J Comp Neurol. 2011;519:1492–504. doi: 10.1002/cne.22579. [DOI] [PMC free article] [PubMed] [Google Scholar]
- Stephenson K, Schroder C, Bertschy G, Bourgin P. Complex interaction of circadian and non-circadian effects of light on mood: shedding new light on an old story. Sleep medicine reviews. 2012;16:445–54. doi: 10.1016/j.smrv.2011.09.002. [DOI] [PubMed] [Google Scholar]